

Analys
What is behind the recent fall in US crude oil stocks?
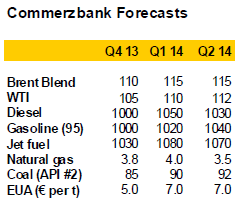
 US crude oil stocks have fallen significantly during the summer months. This was mainly attributable to an increase in crude oil processing. In this way US refineries reacted to robust demand for middle distillates, which is reflected in low US distillate stocks and record US distillate exports. As crude oil processing declines, US crude oil stocks will likely rise again in the fourth quarter. Robust US distillate exports are exerting pressure on refinery margins in Europe, which will probably increase Europe’s dependency on imports of oil products.
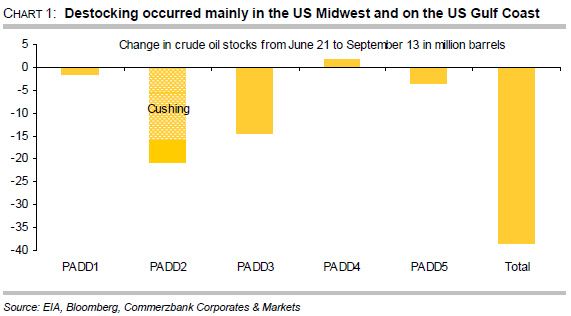
 US crude oil stocks have fallen significantly during the summer months. Since the end of June they have declined by 38m barrels and in mid-September reached their lowest level for 18 months. Destocking has been concentrated on two regions: in the Midwest (PADD 2) stocks have fallen by more than 20m barrels, and on the US Gulf Coast (PADD 3) by more than 14m barrels (chart 1). The lion’s share of the destocking in the Midwest related to the storage hub in Cushing, where stocks have fallen by a total of 16.5m barrels for 13 weeks in succession. What is the reason for this surprising trend and will the destocking continue?
The trend in stock levels can be divided into three sub-components: on the supply side are US oil production and US oil imports, and on the demand side, crude oil processing by refineries. US oil production has increased until recently. In mid-September it reached its highest level since May 1989 of more than 7.4m barrels per day. This component cannot therefore explain the destocking of recent weeks. On the other hand, imports of crude oil have fallen sharply. In the summer months they were, on average, 1m barrels per day lower than in the previous year. However, this will not be sufficient to balance out the simultaneous increase in US oil production. Between the end of June and mid-September this was, on average, 1.4m barrels per day above the previous year’s level. The trend on the supply side would therefore have been an indication of stockbuilding. The main reason for the significant destocking this summer is therefore to be found on the demand side, i.e. from the higher volumes of crude oil processed at refineries.
Crude oil processing in the USA was higher than usual this summer
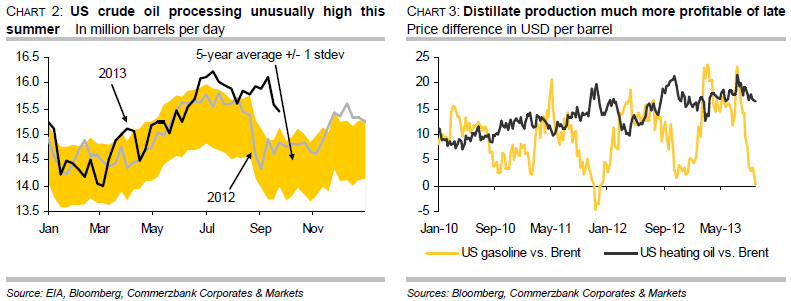
US refineries stepped up crude oil processing much more significantly than usual this summer. Between the end of June and mid-September, an average of 16m barrels of crude oil was processed daily. This was 600,000 barrels per day more than in the corresponding period last year, and 900,000 barrels per day more than the long-term average level (chart 2). At the beginning of July, more crude oil was processed than at any time in the last eight years. It was also striking that refineries maintained processing rates at their high levels of July and August up to mid-September. Normally, refineries scale back their utilisation from the end of August as the summer driving season approaches an end. Refineries usually use the time in early autumn to carry out maintenance and to switch operations to the winter season. Hence, significantly more crude oil has been processed this summer than would otherwise be normal at this time of the year. This has only been possible by consistently dipping into crude oil stocks, although more crude oil has also been available as a result of the increased level of domestic oil production.
This cannot be explained with trends in the US gasoline market…
The fact that US refineries have increased their crude oil processing so strongly over an extended period this summer cannot be explained by trends in the US gasoline market, which is normally the most important driver of refinery activity in the summer months. Demand for gasoline in the US during the summer driving season showed virtually no increase compared to last year. US gasoline stocks have remained consistently 5 to 6 per cent above their long-term average for weeks with a few exceptions. US gasoline production was just slightly higher this summer than in the previous years. Moreover, the US exported less gasoline between March and July than one year ago, according to the EIA.
…but is attributable to distillate production in particular
The reason for the unusually high level of refinery activity over a prolonged period is above all attributable to middle distillates. US refineries have significantly increased the production of middle distillates in particular. This increased to an average of 5m barrels per day in the summer months, which was 13% higher than average for the last five years. More than half of the increase in crude oil processing this summer is therefore attributable to the middle distillates segment. The varying trend in processing margins is likely to have played a part here. While margins for gasoline production have fallen to the lowest level since end of 2011, they are still relatively high for middle distillates (chart 3). The fact that margins for middle distillates have held up much better is attributable to low US distillate stocks, which have remained well below their long-term average levels despite robust production of middle distillates.
Strong demand for distillates in and outside the USA
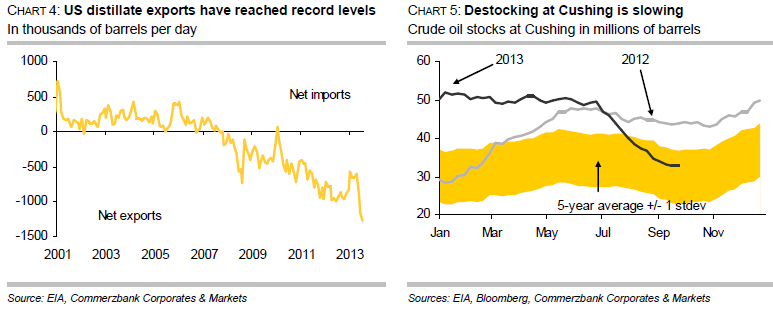
This is mainly the result of higher domestic demand and robust demand for distillates from abroad. Distillate demand from US consumers was 10% higher than last year during the summer months and 6% above the average of the last five years. Moreover, the USA exported 1.276m barrels of middle distillates per day on balance in July after having reached a level nearly as high in June (chart 4, page 3). Daily net distillate exports were almost twice as high in June and July as in the first four months of the year and also 26% above the same period last year. Weekly estimates from the US Energy Information Administration also indicate that distillate exports remained at a similarly high level in August and September.
Refinery activity is unlikely to sustain these exceptionally high levels
US refineries have benefited from cheaper crude oil from the country’s interior until recently, which, thanks to new pipeline capacity, can be transported to the US Gulf Coast, where roughly half of US refinery capacity is situated. This also enables US refineries to avoid the continuing restrictions on crude oil exports from the USA, since these restrictions do not apply to the export of oil products. Despite everything, US refineries are unlikely to maintain their distinctly high levels of crude oil processing of recent months, given lower margins. The EIA expects average crude oil processing of 15.3m barrels per day in the fourth quarter. This would still be more than 500,000 barrels per day above the average of the last five years, but some 600,000 barrels per day less than in the third quarter. The lower demand for crude oil from refineries indicates higher stock levels, if US oil imports are not being reduced markedly, as US oil production is likely to increase further as a result of the surge in shale oil production in North Dakota and Texas. In fact, the decline in US crude oil stocks seems to have come to an end. In the second half of September stocks were already increasing by roughly 8m barrels, due to lower volume of crude oil processing and higher oil imports.
Decline in crude oil stocks has recently also slowed at Cushing
The 13-week long decline in crude oil stocks at Cushing has also weakened visibly in recent weeks (chart 5). Whereas, between the beginning of July and the end of August, on balance an average of 1.36m barrels of crude oil per week were drained off Cushing, in September the figure had fallen to an average of less than 500,000 barrels per week. At the end of September, the decline in stocks at Cushing had almost come to an end. Should stocks be built up also at Cushing in the weeks ahead, this would not be attributable to a lack of transport or processing capacities. These are now sufficient – as the steady fall in Cushing stocks over the summer months despite rising shale oil production in the Midwest demonstrated. In fact, once the Southern leg of the Keystone XL pipeline is completed, additional transport capacities of 700,000 barrels per day will be available by year-end. A stock build-up would instead be attributable to lower crude oil processing at refineries. This should exert pressure on the WTI price in particular.
Record US distillate exports creating problems for refineries in Europe
What are the implications of these trends for Europe? According to data from the EIA, the USA was already exporting record volumes of middle distillates to Europe in May and June. Based on shipping data, this trend has continued in September. The high levels of US distillate exports will exert pressure on refinery margins in Europe. Despite low gasoil stocks, the price differential between gasoil and Brent oil has been moving in a narrow range around USD 15 per barrel for some months, which is hardly sufficient to offset the very low margins in gasoline production. The situation has been compounded by the fact that the USA itself has now become a net gasoline exporter. As a result the US market – formerly the most important sales market for European refineries – has been lost. At the same time, the USA is also competing in gasoline on other sales markets such as South America, for instance. Further refinery closures in Europe are thus on the cards, which would further increase Europe’s dependency on imports of oil products.

When it starts to move lower it moves rather quickly. Gaza, China, IEA. Brent crude is down 2.1% today to $62/b after having traded as high as $66.58/b last Thursday and above $70/b in late September. The sell-off follows the truce/peace in Gaze, a flareup in US-China trade and yet another bearish oil outlook from the IEA.

A lasting peace in Gaze could drive crude oil at sea to onshore stocks. A lasting peace in Gaza would probably calm down the Houthis and thus allow more normal shipments of crude oil to sail through the Suez Canal, the Red Sea and out through the Bab-el-Mandeb Strait. Crude oil at sea has risen from 48 mb in April to now 91 mb versus a pre-Covid normal of about 50-60 mb. The rise to 91 mb is probably the result of crude sailing around Africa to be shot to pieces by the Houthis. If sailings were to normalize through the Suez Canal, then it could free up some 40 mb in transit at sea moving onshore into stocks.
The US-China trade conflict is of course bearish for demand if it continues.
Bearish IEA yet again. Getting closer to 2026. Credibility rises. We expect OPEC to cut end of 2025. The bearish monthly report from the IEA is what it is, but the closer we get to 2026, the more likely the IEA is of being ball-park right in its outlook. In its monthly report today the IEA estimates that the need for crude oil from OPEC in 2026 will be 25.4 mb/d versus production by the group in September of 29.1 mb/d. The group thus needs to do some serious cutting at the end of 2025 if it wants to keep the market balanced and avoid inventories from skyrocketing. Given that IEA is correct that is. We do however expect OPEC to implement cuts to avoid a large increase in inventories in Q1-26. The group will probably revert to cuts either at its early December meeting when they discuss production for January or in early January when they discuss production for February. The oil price will likely head yet lower until the group reverts to cuts.
Dubai: The Mid-East anchor dragging crude oil lower. Surplus emerging in Mid-East pricing. Crude oil prices held surprisingly strong all through the summer. A sign and a key source of that strength came from the strength in the front-end backwardation of the Dubai crude oil curve. It held out strong from mid-June and all until late September with an average 1-3mth time-spread premium of $1.8/b from mid-June to end of September. The 1-3mth time-spreads for Brent and WTI however were in steady deterioration from late June while their flat prices probably were held up by the strength coming from the Persian Gulf. Then in late September the strength in the Dubai curve suddenly collapsed. Since the start of October it has been weaker than both the Brent and the WTI curves. The Dubai 1-3mth time-spread now only stands at $0.25/b. The Middle East is now exporting more as it is producing more and also consuming less following elevated summer crude burn for power (Aircon) etc.
The only bear-element missing is a sudden and solid rise in OECD stocks. The only thing that is missing for the bear-case everyone have been waiting for is a solid, visible rise in OECD stocks in general and US oil stocks specifically. So watch out for US API indications tomorrow and official US oil inventories on Thursday.
No sign of any kind of fire-sale of oil from Saudi Arabia yet. To what we can see, Saudi Arabia is not at all struggling to sell its oil. It only lowered its Official Selling Prices (OSPs) to Asia marginally for November. A surplus market + Saudi determination to sell its oil to the market would normally lead to a sharp lowering of Saudi OSPs to Asia. Not yet at least and not for November.
The 5yr contract close to fixed at $68/b. Of importance with respect to how far down oil can/will go. When the oil market moves into a surplus then the spot price starts to trade in a large discount to the 5yr contract. Typically $10-15/b below the 5yr contract on average in bear-years (2009, 2015, 2016, 2020). But the 5yr contract is usually pulled lower as well thus making this approach a moving target. But the 5yr contract price has now been rock solidly been pegged to $68/b since 2022. And in the 2022 bull-year (Brent spot average $99/b), the 5yr contract only went to $72/b on average. If we assume that the same goes for the downside and that 2026 is a bear-year then the 5yr goes to $64/b while the spot is trading at a $10-15/b discount to that. That would imply an average spot price next year of $49-54/b. But that is if OPEC doesn’t revert to cuts and instead keeps production flowing. We think OPEC(+) will trim/cut production as needed into 2026 to prevent a huge build-up in global oil stocks and a crash in prices. But for now we are still heading lower. Into the $50ies/b.
Some rebound but not much. Brent crude rebounded 1.5% yesterday to $65.47/b. This morning it is inching 0.2% up to $65.6/b. The lowest close last week was on Thursday at $64.11/b.
The curve structure is almost as week as it was before the weekend. The rebound we now have gotten post the message from OPEC+ over the weekend is to a large degree a rebound along the curve rather than much strengthening at the front-end of the curve. That part of the curve structure is almost as weak as it was last Thursday.
We are still on a weakening path. The message from OPEC+ over the weekend was we are still on a weakening path with rising supply from the group. It is just not as rapidly weakening as was feared ahead of the weekend when a quota hike of 500 kb/d/mth for November was discussed.
The Brent curve is on its way to full contango with Brent dipping into the $50ies/b. Thus the ongoing weakening we have had in the crude curve since the start of the year, and especially since early June, will continue until the Brent crude oil forward curve is in full contango along with visibly rising US and OECD oil inventories. The front-month Brent contract will then flip down towards the $60/b-line and below into the $50ies/b.
At what point will OPEC+ turn to cuts? The big question then becomes: When will OPEC+ turn around to make some cuts? At what (price) point will they choose to stabilize the market? Because for sure they will. Higher oil inventories, some more shedding of drilling rigs in US shale and Brent into the 50ies somewhere is probably where the group will step in.
There is nothing we have seen from the group so far which indicates that they will close their eyes, let the world drown in oil and the oil price crash to $40/b or below.
The message from OPEC+ is also about balance and stability. The world won’t drown in oil in 2026. The message from the group as far as we manage to interpret it is twofold: 1) Taking back market share which requires a lower price for non-OPEC+ to back off a bit, and 2) Oil market stability and balance. It is not just about 1. Thus fretting about how we are all going to drown in oil in 2026 is totally off the mark by just focusing on point 1.
When to buy cal 2026? Before Christmas when Brent hits $55/b and before OPEC+ holds its last meeting of the year which is likely to be in early December.
Brent crude oil prices have rebounded a bit along the forward curve. Not much strengthening in the structure of the curve. The front-end backwardation is not much stronger today than on its weakest level so far this year which was on Thursday last week.

The front-end backwardation fell to its weakest level so far this year on Thursday last week. A slight pickup yesterday and today, but still very close to the weakest year to date. More oil from OPEC+ in the coming months and softer demand and rising inventories. We are heading for yet softer levels.

Down to the lowest since early May. Brent crude has fallen sharply the latest four days. It closed at USD 64.11/b yesterday which is the lowest since early May. It is staging a 1.3% rebound this morning along with gains in both equities and industrial metals with an added touch of support from a softer USD on top.
What stands out the most to us this week is the collapse in the Dubai one to three months time-spread.
Dubai is medium sour crude. OPEC+ is in general medium sour crude production. Asian refineries are predominantly designed to process medium sour crude. So Dubai is the real measure of the balance between OPEC+ holding back or not versus Asian oil demand for consumption and stock building.
A sharp weakening of the front-end of the Dubai curve. The front-end of the Dubai crude curve has been holding out very solidly throughout this summer while the front-end of the Brent and WTI curves have been steadily softening. But the strength in the Dubai curve in our view was carrying the crude oil market in general. A source of strength in the crude oil market. The core of the strength.
The now finally sharp decline of the front-end of the Dubai crude curve is thus a strong shift. Weakness in the Dubai crude marker is weakness in the core of the oil market. The core which has helped to hold the oil market elevated.
Facts supports the weakening. Add in facts of Iraq lifting production from Kurdistan through Turkey. Saudi Arabia lifting production to 10 mb/d in September (normal production level) and lifting exports as well as domestic demand for oil for power for air con is fading along with summer heat. Add also in counter seasonal rise in US crude and product stocks last week. US oil stocks usually decline by 1.3 mb/week this time of year. Last week they instead rose 6.4 mb/week (+7.2 mb if including SPR). Total US commercial oil stocks are now only 2.1 mb below the 2015-19 seasonal average. US oil stocks normally decline from now to Christmas. If they instead continue to rise, then it will be strongly counter seasonal rise and will create a very strong bearish pressure on oil prices.
Will OPEC+ lift its voluntary quotas by zero, 137 kb/d, 500 kb/d or 1.5 mb/d? On Sunday of course OPEC+ will decide on how much to unwind of the remaining 1.5 mb/d of voluntary quotas for November. Will it be 137 kb/d yet again as for October? Will it be 500 kb/d as was talked about earlier this week? Or will it be a full unwind in one go of 1.5 mb/d? We think most likely now it will be at least 500 kb/d and possibly a full unwind. We discussed this in a not earlier this week: ”500 kb/d of voluntary quotas in October. But a full unwind of 1.5 mb/d”
The strength in the front-end of the Dubai curve held out through summer while Brent and WTI curve structures weakened steadily. That core strength helped to keep flat crude oil prices elevated close to the 70-line. Now also the Dubai curve has given in.

Brent crude oil forward curves

Total US commercial stocks now close to normal. Counter seasonal rise last week. Rest of year?

Total US crude and product stocks on a steady trend higher.


Guld och silver stiger hela tiden mot nya höjder
The Mid-East anchor dragging crude oil lower

Samtal om sällsynta jordartsmetaller, guld och silver

Brookfield köper bränsleceller för 5 miljarder USD av Bloom Energy för att driva AI-datacenter

Teck Resources kan förse Nordamerika och kanske hela G7 med all germanium som behövs

Tyskland har så höga elpriser att företag inte har råd att använda elektricitet

OPEC+ missar produktionsmål, stöder oljepriserna

Ett samtal om guld, olja, fjärrvärme och förnybar energi

Guld nära 4000 USD och silver 50 USD, därför kan de fortsätta stiga
Are Ukraine’s attacks on Russian energy infrastructure working?
-
Nyheter4 veckor sedan
Tyskland har så höga elpriser att företag inte har råd att använda elektricitet
-
 Nyheter3 veckor sedan
OPEC+ missar produktionsmål, stöder oljepriserna
-
 Nyheter3 veckor sedan
Ett samtal om guld, olja, fjärrvärme och förnybar energi
-
 Nyheter2 veckor sedan
Guld nära 4000 USD och silver 50 USD, därför kan de fortsätta stiga
-
Analys3 veckor sedan
Are Ukraine’s attacks on Russian energy infrastructure working?
-

 Nyheter1 vecka sedan
Goldman Sachs höjer prognosen för guld, tror priset når 4900 USD
-

 Nyheter2 veckor sedan
Blykalla och amerikanska Oklo inleder ett samarbete
-

 Nyheter3 veckor sedan
Guldpriset uppe på nya höjder, nu 3750 USD