

Analys
Trump holds the key for commodities

![]() In a summer when investors have been caught off guard by everything from emerging market woes and the dollar’s tailwind to a brewing trade war, commodity markets have once again appeared in the crosshairs in terms of market turbulence. This time, it is not China, OPEC or oil which are central to crisis, but rather it is the USD-financed emerging markets and their mined metal and soft commodity production. We do not think the emerging markets crisis will be a China crisis and we believe that copper and zinc are set to rebound.
In a summer when investors have been caught off guard by everything from emerging market woes and the dollar’s tailwind to a brewing trade war, commodity markets have once again appeared in the crosshairs in terms of market turbulence. This time, it is not China, OPEC or oil which are central to crisis, but rather it is the USD-financed emerging markets and their mined metal and soft commodity production. We do not think the emerging markets crisis will be a China crisis and we believe that copper and zinc are set to rebound.
Starting point is Trump’s politics
Three major President Trump-related developments are having a significant impact on the commodity universe right now. First, the US decision to leave the Iran agreement and impose sanctions in two stages against Tehran laid the ground for a more direct market pricing of any similar actions against other countries.
Second, sanctions were imposed on Russia, and and most recently, US import tariffs on steel and aluminium were doubled on Turkey.
Third, on top of sanctions, developments in the trade war stalled during the summer and the positions of the various sides appeared to become locked.
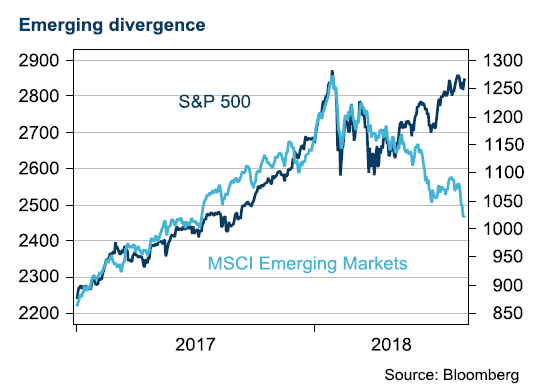
These developments served to illustrate the US approach to emerging markets, in our view, and changed market pricing, kicking off a divergence between the pricing of US assets and those of emerging markets.
Turkey will not spread to Asia
If the Turkish currency crisis is not staved off, the risk of a financial system meltdown and, ultimately, a government debt default is high. But even though Spanish banks are vulnerable, Turkey’s problems should not hurt the overall eurozone economy to a significant degree. Euro weakness and European stock market declines due to the escalation of Turkey’s crisis therefore seem to be overdone. However, Turkey is far from out of the woods yet and the situation might need to worsen still to convince Turkey to adopt a painful, but more sustainable, path toward regaining financial markets’ trust. Other emerging markets with similar challenges, such as South Africa, Argentina and Pakistan, also face tough times ahead.
China stands out
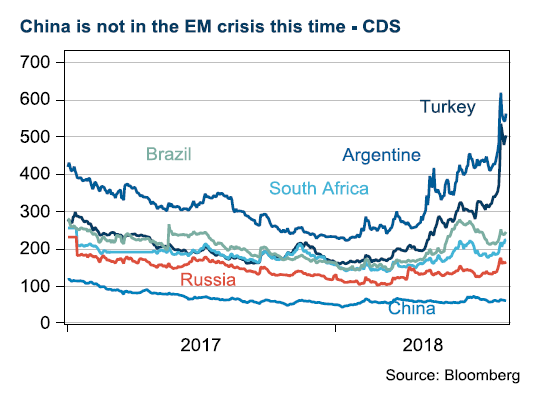
What ties the affected emerging market countries together this time is expensive USD financing. China is not among them. This is can be seen clearly by studying developments in the cost of credit default swaps, or CDS.
China has barely moved while Turkey and Argentina have gone through the roof. Among the worst hit are Brazil, South Africa and Russia. These countries have also seen their currencies underperform along with their local equity markets.
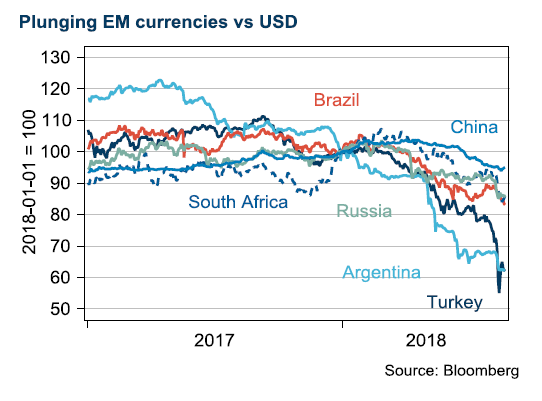 As currencies have fallen, investors have started to anticipate an increase in the export of commodities to secure income. We have seen agricultural commodities trading lower, as seasonal stockpiles are expected to be shipped at a higher rate than normal.
Numbers point to a brighter future
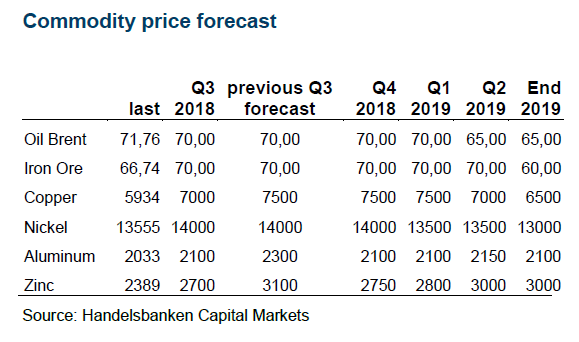
The idea that fear is stronger than greed is relevant here, in our view. We think the first phase of President Trump’s threatening of the emerging markets is over. Running the numbers on the impact of tariffs still points to a bright future. It is hard to prove that tariffs will take a meaningful toll on growth in consumption, we believe. The impact on corporate investment is more difficult to judge. Typically, there are many negative assumptions made ahead of investments decisions. After President Trump’s “flip flop” policies, there is scope for many more multinational companies. Our base case is that President Trump will sign a deal with China in November, in time to influence the midterm elections. In such a scenario, we think base metals would recover, especially copper. Within base metals, it is clear that those more exposed to the Asian construction sector, e.g. copper and zinc, have been the greatest losers, while nickel has done much better, supported by a larger share of demand coming from the US and Europe, posting positive data during the summer.
Oil is all about Iran
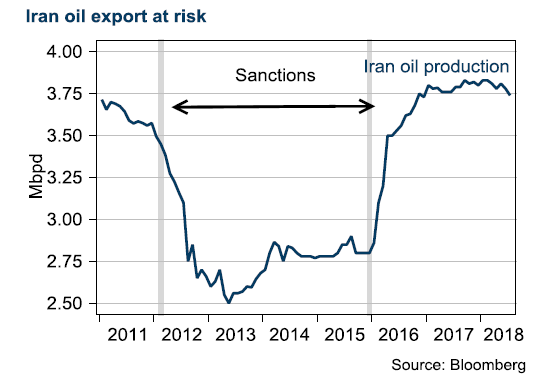
The first phase of the new US sanctions against Iran came into force in August. Among other things, this means that Iran cannot use USD. However, sanctions on oil exports will not come into effect until November. These sanctions will probably not hit the country as hard as the previous ones, as they do not have the support of the rest of the world.
 Oil prices rose after, among other things, the French oil company Total announced at the OPEC meeting in June that it had already stopped buying oil from Iran. This decision was a typical action in line with American sanctions, whereby a company safeguards its activities in the US and prioritises trade with the US as the larger market. President Trump also always has the option of taking sanctions against Iran to the next level. As with the last occasion that the US used sanctions against Iran, the country could forbid all companies that trade with Iran from having access to the huge US market, and prevent dollar funding. This makes the US sanctions very effective.
In the first half of the year, leaders from the EU tried to get the US to remain in the Iran agreement and presented a series of measures to instead put pressure on Iran, including closing down the missile programme. The Trump administration considered the measures to be insufficient, and chose to withdraw from the agreement. Now, the administration has urged Iran to return to the negotiating table to formulate a more comprehensive agreement than the previous one; however, Iran has stated that the US must first revert to the agreement before negotiations can recommence.
In our view, the current sanctions are fully accounted for in the oil price and a certain amount of ‘over-compliance’, such as in the example of Total, is also priced in. However, what has not been included in the oil price, in our view, is the reality of President Trump taking a step further and cutting off Iran from the global economy completely. In that case, for example, China would not be able to import oil from Iran. The latest decrease in the oil price (from around USD 78/barrel in early July to USD 72) can mainly be attributed to the escalating trade war between the US and China, in our view, but this does not mean that the situation with Iran has become any less significant.
Sparkling electricity market
 Power markets have surged during the summer as because of weak hydro supply and high temperatures (Nordic reservoirs now 18% below seasonal norm). Prices also supported by strong fuels complex and Emission Rights hitting a 7-year high EUR 19.33 at the time of this being published.


Selling down on a ”deal”. Brent crude fell 6.2% last week with accelerated weakness towards the end of the week. Close of the week at $87.33/b and low of the week (and on Friday) of $85.8/b. Brent is falling another 4% this morning to $83.7/b on confirmation by Iran that a MoU text has been reached and that it will be signed on Friday this week.

So what is this ”deal” worth? Talk on the desk here this morning is that it is much like ”putting lipstick on a pig” where Trump has to sell this at home as a victory where ”the SoH has reopened”, the nuclear issue will be ironed out over the coming 60 days (or maybe 600 days?) and US consumers are getting a lower gasoline price and maybe US republicans survives the midterm elections.
The importance for Iran is that it emerges as the defacto winner of this war in the eyes of the non-US public world. That Iran now onwards is the ”ruler of the SoH” (combo of geography and new weapons systems like drones) or more softer: ”the guarantor of safe passage through the SoH”.
Iran doesn’t need nuclear weapons any more. Nuclear deterrence doesn’t work any more. Ukraine has made many attacks deep into Russia without being nuked in return. Plenty of Iranian ballistic rockets blasts over Israel but Iran wasn’t nuked in return.
There is no trust between the US and Iran. We don’t know all the details yet of the MoU. But what we do know is that there is no trust between the US and Iran what so ever. This is probably more like a descriptive text on how they can cooperate in a way where both sides keeps tactical leverage. Neither side makes irreversible concessions. Violations can be punished quickly. Cooperation produces immediate benefits.
This is a fragile structure. It can easily break down. There may be details which cannot be overcome. To be seen on Friday. The US has to show that it is willing put enough force behind managing and restraining Israel versus Hezbollah in Lebanon. We have seen that Netanyahu hasn’t listened all that much to Trump’s directives and wishes. This could be a major obstacle.
A gradual reopening is tactically preferable for Iran. A tactical leverage for Iran right now is that global oil stocks have been drawn down towards painful and increasingly dangerous levels with increasing risks for oil price spikes in mid-July to August. This together with US midterm elections on 3 November gives tactical leverage to Iran. Iran probably doesn’t want to fully give up on that leverage. A rapid, full reopening where global stocks are able to refill over the coming 60 days will significantly erode that leverage. If Iran reinstates a closure of the SoH after 60 days (if talks break down again), then the effect won’t be that impactful in terms of prices and the US midterm elections.
So a gradual and partial reopening where global markets gets the oil they need while they are unable to rebuild stocks could be a practical middle way for both parties. Trump can sell it as ”the SoH has reopened” and get affordable gasoline for US consumers. Iran can sell it as ”the SoH has fully reopened, but there is some friction” so flow is only 60-80% of normal.
Not much real demand destruction below $100/b. What we do know is that there is not much real price pain demand destruction for oil globally at an oil price below $100/b. A lot of demand-shock destruction. Fear. But demand should now come roaring back towards normal with fear for exceptionally high prices now is rapidly receding.
Sudden China demand destruction due to EVs? Bullocks. EV share of total Chinese carpool now around 13%. Share of new sales of EVs has reached 50%. This is a very gradual process. It doesn’t make oil demand fall like a rock over night. When EV new sales share reaches 100%, then the gasoline car pool will contract by some 5-10% per year. But that is only gasoline. Sudden reduction in Chinese oil demand is more about shock and risk.
Chinese crude oil imports will come roaring back. At what price? Today’s ”neutral” oil price is $70/b. That is the five year price which has steadily traded around the $70/b mark over the past 3-4 years. With still a risky picture one would think that China and the rest of the world will be big buyers of oil in the range of $70-85/b.
Global demand will likely snap back towards normal, forecasted demand and growth at such prices.
Physical reopening is a gradual process. The physical and practical reopening of the SoH will likely be gradual rather than sudden. And that probably suites Iran tactically as well.
Brent M1 price versus the Brent 5-yr (today’s ”normal” price)

Market is starting to take US/Iran headlines with a pinch of salt. Brent crude rose $2.8/b yesterday to an official close of $112.1/b. But after that it traded as low as $108.05/b before ending late night at around $109.7/b. Through the day it traded in a range of $106.87 – 112.72/b amid a flurry of news or rumors from Iran and the US. ”US temporary sanctions during negotiations” (falls alarm). ”We will bomb Iran” (not anyhow),… etc. While the market is still fluctuating to this kind of news flow, it is starting to take such headlines with a pinch of salt.
We’ll see. Maybe, maybe not. The Brent M1 contract is trading at $110.2/b this morning which very close to the average ticks through yesterday of $110.4/b.
Trump with bearish, verbal intervention whenever Brent trades above $110/b it seems. What seems to be a pattern is that Trump states something like ”very good negotiations going on with Iran”, ”New leaders in Iran are great,..”, ”Great progress in negotiations,…”, ”Deal in sight,..” etc whenever the Brent M1 contract trades above $110/b. An effort to cool the market. These hot air verbal interventions from Trump used to have a heavy bearish impact on prices, but they now seems to have less and less effect unless they are backed by reality.
As far as we can see there has been no real progress in the negotiations between the US and Iran with both sides still standing by their previous demands.
Iran is getting stronger while the cease fire lasts making a return to war for Trump yet harder. Iran is naturally in constant preparation for a return to war given Trump’s steady threats of bombing Iran again. Iran is naturally doing what ever is possible to prepare for a return to war. And every day the cease fire lasts it is better prepared. This naturally makes it more and more difficult and dangerous for the US to return to warring activity versus Iran as the consequences for energy infrastructure in the Persian Gulf will be more and more severe the longer the cease fire lasts. Israel seems to see it this way as well. That the war is not won and that current frozen state of a cease fire gives Iran opportunity to rebuild military and politically.
Global inventories are drawing down day by day. How much? In the meantime the Strait of Hormuz stays closed. There is varying measures and estimates of how much global inventories are drawing down. Our rough estimate, back of the envelope, is that global inventories are drawing down by at least some 10 mb/d or about 300 mb/d in a balance between loss of supply versus demand destruction. Other estimates we see are a monthly draw of 250-270 mb/d. The IEA only ’measured’ a draw in global observable stocks of 117 mb in April with oil on water rising 53 mb while on shore stocks fell 170 mb. But global stocks are hard to measure with large invisible, unmeasured stocks. As such a back of the envelope approach may be better.
Oil products is what the world is consuming. Oil product prices likely to rise while product stocks fall. Strategic Petroleum Reserves (SPR) are predominantly crude oil. Discharging oil from OECD SPR stocks, a sharp reduction in Chinese crude imports and a reduction in global refinery throughput of 6-7 mb/d has helped to keep crude oil markets satisfactorily supplied. But global inventories are drawing down none the less. And oil products is really what the world is consuming. So if global refinery throughput stays subdued, then demand will eventually have to match the supply of oil products. The likely path forward this summer is a steady draw down in jet fuel, diesel and gasoline. Higher prices for these. Then, if possible, higher refinery throughput and higher usage of crude in response to very profitable refinery margins. And lastly sharper draw in crude stocks and higher prices for these. But some 6 mb/d of oil products used to be exported through the Strait of Hormuz. And it may not be so easy to ramp up refinery activity across the world to compensate. Especially as Ukraine continues to damage Russian refineries as well as Russian crude production and export facilities.
Watch oil product stocks and prices as well as Brent calendar 2027. What to watch for this summer is thus oil product inventories falling and oil product premiums to crude rising. Another measure to watch is the Brent crude 2027 contract as it rises steadily day by day as the Strait of Hormuz stays closed and global oil inventories decline. The latter is close to the highest level since the start of the war and keeps rising.
The Brent M1 contract and the Brent 2027 prices and current price of jet fuel in Europe (ARA). All in USD/b

Our back of the envelope calculation of the global shortage created by the closure of the Strait of Hormuz. Note that 3.5 mb/d of discharge from SPR is also a draw. Note also that ’Forced demand loss’ of 2.5 mb/d is probably temporary and will fall back towards zero as logistics are sorted out leaving ’Price demand loss’ to do the job of balancing the market. Thus a shortfall of at least 9 mb/d created by the closure. More if SPR discharge is included and more if Forced demand loss recedes.

Brent is climbing higher. Front-month is at USD 106.3/bl this morning, close to a weekly high and a USD 9/bl jump from Mondays open. This is the move we flagged as a risk earlier in the week: the market shifting from ”a deal is around the corner” to ”this is going to take longer than we thought”.

Analyst Commodities, SEB
During April, rest-of-year Brent remained remarkably stable around USD 90/bl. A stability which rested on one single assumption: the SoH reopens around 1 May. That assumption is now slowly falling apart.
As we highlighted yesterday: every week of delay beyond 1 May adds (theoretically) ish USD 5/bl to the rest-of-year average, as global inventories draw 100 million barrels per week. i.e., a mid-May reopening implies rest-of-year Brent closer to USD 100/bl, and anything pushing into June or July takes us meaningfully higher.
What’s changed in the last 48 hours:
#1: The US military has formally warned that clearing suspected sea mines from SoH could take up to six months. That is a completely different timescale from what the financial market is pricing. Even a political deal tomorrow does not immediately reopen the strait.
#2: Trump has shifted his tone from urgency to ”strategic patience”. In yesterday’s press conference: ”Don’t rush me… I want a great deal.” The market is reading this as a president no longer feeling pressured by timelines, with the naval blockade running in the background.
#3: So far, the military activity is escalating, not de-escalating. Axios reports Iran is laying more mines in SoH. The US 3rd carrier strike group (USS George H.W. Bush) is arriving with two countermine vessels. Trump yesterday ordered the US Navy to destroy any Iranian boats caught laying mines. While CNN reports that the Pentagon is actively drawing up plans to strike Iranian SoH capabilities and individual Iranian military leaders if the ceasefire collapses. i.e., NOT a attitude consistent with an imminent deal!
Spot crude and product prices eased off the early-April highs on a combination of system rerouting and deal optimism. Both now weakening. Goldman estimates April Gulf output is reduced by 14.5 mbl/d, or 57% of pre-war supply, a number that keeps getting worse the longer this drags on.
Demand-side adaptation is ongoing: S. Korea has cut its Middle East crude dependence from 69% to 56% by pulling more from the Americas and Africa, and Japan is kicking off a second round of SPR releases from 1 May. But SPRs are finite.
Ref. to the negotiations, we should not bet on speed. The current Iranian leadership is dominated by genuine hardliners willing to absorb economic pain and run the clock to extract concessions. That is not a setup for a rapid resolution. US/Israeli media briefings keep framing the delay as ”internal Iranian divisions”, the reality is more complicated and points toward weeks and months, not days.
Our point is that the complexity is large, and higher prices have only just started (given a scenario where the negotiations drag out in time). The market spent April leaning on the USD 90/bl rest-of-year assumption; that case is diminishing by the hour. If ”early May reopening” is replaced by ”June, July or later” over the next week or two, both crude and products have meaningful room to reprice higher from here. There is a high risk being short energy and betting on any immediate political resolution(!).


Vattenfalls och Industrikrafts kärnkraftsbolag Videberg Kraft har valt Rolls-Royce SMR
Selling down on a ”deal”

Sommarväder skapar prisrally på elbörsen
Oil product price pain is set to rise as the Strait of Hormuz stays closed into summer

Solkraften pressar elpriserna dagtid
Oil product price pain is set to rise as the Strait of Hormuz stays closed into summer
Sommarväder skapar prisrally på elbörsen
Vattenfalls och Industrikrafts kärnkraftsbolag Videberg Kraft har valt Rolls-Royce SMR
Selling down on a ”deal”
-
Analys4 veckor sedan
Oil product price pain is set to rise as the Strait of Hormuz stays closed into summer
-
Nyheter2 veckor sedan
Sommarväder skapar prisrally på elbörsen
-
 Nyheter2 dagar sedan
Vattenfalls och Industrikrafts kärnkraftsbolag Videberg Kraft har valt Rolls-Royce SMR
-
Analys2 dagar sedan
Selling down on a ”deal”