

Analys
Trump holds the key for commodities

![]() In a summer when investors have been caught off guard by everything from emerging market woes and the dollar’s tailwind to a brewing trade war, commodity markets have once again appeared in the crosshairs in terms of market turbulence. This time, it is not China, OPEC or oil which are central to crisis, but rather it is the USD-financed emerging markets and their mined metal and soft commodity production. We do not think the emerging markets crisis will be a China crisis and we believe that copper and zinc are set to rebound.
In a summer when investors have been caught off guard by everything from emerging market woes and the dollar’s tailwind to a brewing trade war, commodity markets have once again appeared in the crosshairs in terms of market turbulence. This time, it is not China, OPEC or oil which are central to crisis, but rather it is the USD-financed emerging markets and their mined metal and soft commodity production. We do not think the emerging markets crisis will be a China crisis and we believe that copper and zinc are set to rebound.
Starting point is Trump’s politics
Three major President Trump-related developments are having a significant impact on the commodity universe right now. First, the US decision to leave the Iran agreement and impose sanctions in two stages against Tehran laid the ground for a more direct market pricing of any similar actions against other countries.
Second, sanctions were imposed on Russia, and and most recently, US import tariffs on steel and aluminium were doubled on Turkey.
Third, on top of sanctions, developments in the trade war stalled during the summer and the positions of the various sides appeared to become locked.
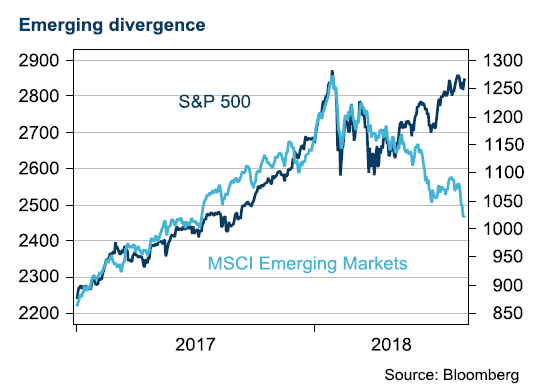
These developments served to illustrate the US approach to emerging markets, in our view, and changed market pricing, kicking off a divergence between the pricing of US assets and those of emerging markets.
Turkey will not spread to Asia
If the Turkish currency crisis is not staved off, the risk of a financial system meltdown and, ultimately, a government debt default is high. But even though Spanish banks are vulnerable, Turkey’s problems should not hurt the overall eurozone economy to a significant degree. Euro weakness and European stock market declines due to the escalation of Turkey’s crisis therefore seem to be overdone. However, Turkey is far from out of the woods yet and the situation might need to worsen still to convince Turkey to adopt a painful, but more sustainable, path toward regaining financial markets’ trust. Other emerging markets with similar challenges, such as South Africa, Argentina and Pakistan, also face tough times ahead.
China stands out
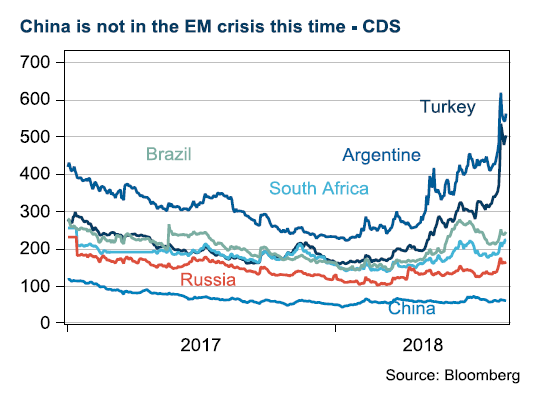
What ties the affected emerging market countries together this time is expensive USD financing. China is not among them. This is can be seen clearly by studying developments in the cost of credit default swaps, or CDS.
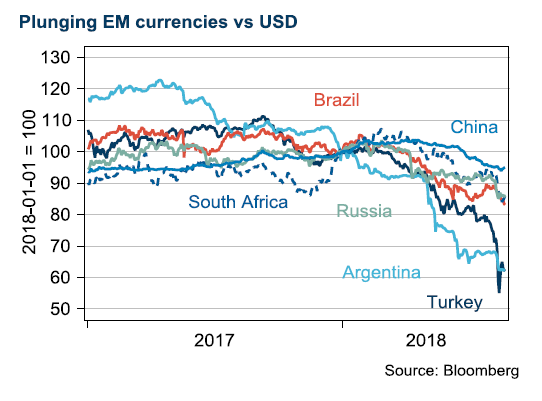
China has barely moved while Turkey and Argentina have gone through the roof. Among the worst hit are Brazil, South Africa and Russia. These countries have also seen their currencies underperform along with their local equity markets.
 As currencies have fallen, investors have started to anticipate an increase in the export of commodities to secure income. We have seen agricultural commodities trading lower, as seasonal stockpiles are expected to be shipped at a higher rate than normal.
Numbers point to a brighter future
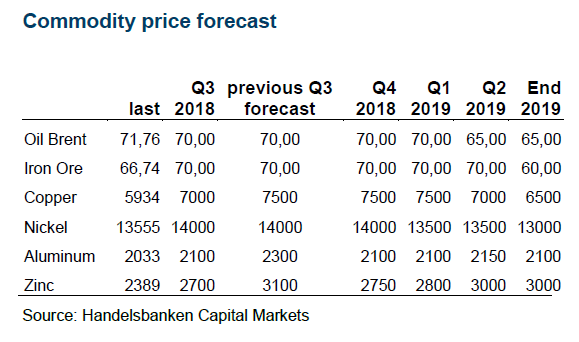
The idea that fear is stronger than greed is relevant here, in our view. We think the first phase of President Trump’s threatening of the emerging markets is over. Running the numbers on the impact of tariffs still points to a bright future. It is hard to prove that tariffs will take a meaningful toll on growth in consumption, we believe. The impact on corporate investment is more difficult to judge. Typically, there are many negative assumptions made ahead of investments decisions. After President Trump’s “flip flop” policies, there is scope for many more multinational companies. Our base case is that President Trump will sign a deal with China in November, in time to influence the midterm elections. In such a scenario, we think base metals would recover, especially copper. Within base metals, it is clear that those more exposed to the Asian construction sector, e.g. copper and zinc, have been the greatest losers, while nickel has done much better, supported by a larger share of demand coming from the US and Europe, posting positive data during the summer.
Oil is all about Iran
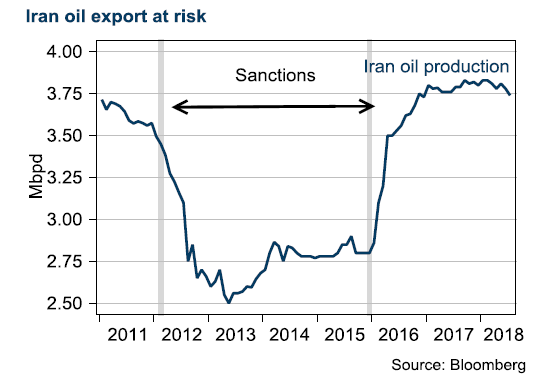
The first phase of the new US sanctions against Iran came into force in August. Among other things, this means that Iran cannot use USD. However, sanctions on oil exports will not come into effect until November. These sanctions will probably not hit the country as hard as the previous ones, as they do not have the support of the rest of the world.
 Oil prices rose after, among other things, the French oil company Total announced at the OPEC meeting in June that it had already stopped buying oil from Iran. This decision was a typical action in line with American sanctions, whereby a company safeguards its activities in the US and prioritises trade with the US as the larger market. President Trump also always has the option of taking sanctions against Iran to the next level. As with the last occasion that the US used sanctions against Iran, the country could forbid all companies that trade with Iran from having access to the huge US market, and prevent dollar funding. This makes the US sanctions very effective.
In the first half of the year, leaders from the EU tried to get the US to remain in the Iran agreement and presented a series of measures to instead put pressure on Iran, including closing down the missile programme. The Trump administration considered the measures to be insufficient, and chose to withdraw from the agreement. Now, the administration has urged Iran to return to the negotiating table to formulate a more comprehensive agreement than the previous one; however, Iran has stated that the US must first revert to the agreement before negotiations can recommence.
In our view, the current sanctions are fully accounted for in the oil price and a certain amount of ‘over-compliance’, such as in the example of Total, is also priced in. However, what has not been included in the oil price, in our view, is the reality of President Trump taking a step further and cutting off Iran from the global economy completely. In that case, for example, China would not be able to import oil from Iran. The latest decrease in the oil price (from around USD 78/barrel in early July to USD 72) can mainly be attributed to the escalating trade war between the US and China, in our view, but this does not mean that the situation with Iran has become any less significant.
Sparkling electricity market
 Power markets have surged during the summer as because of weak hydro supply and high temperatures (Nordic reservoirs now 18% below seasonal norm). Prices also supported by strong fuels complex and Emission Rights hitting a 7-year high EUR 19.33 at the time of this being published.


When it starts to move lower it moves rather quickly. Gaza, China, IEA. Brent crude is down 2.1% today to $62/b after having traded as high as $66.58/b last Thursday and above $70/b in late September. The sell-off follows the truce/peace in Gaze, a flareup in US-China trade and yet another bearish oil outlook from the IEA.

A lasting peace in Gaze could drive crude oil at sea to onshore stocks. A lasting peace in Gaza would probably calm down the Houthis and thus allow more normal shipments of crude oil to sail through the Suez Canal, the Red Sea and out through the Bab-el-Mandeb Strait. Crude oil at sea has risen from 48 mb in April to now 91 mb versus a pre-Covid normal of about 50-60 mb. The rise to 91 mb is probably the result of crude sailing around Africa to be shot to pieces by the Houthis. If sailings were to normalize through the Suez Canal, then it could free up some 40 mb in transit at sea moving onshore into stocks.
The US-China trade conflict is of course bearish for demand if it continues.
Bearish IEA yet again. Getting closer to 2026. Credibility rises. We expect OPEC to cut end of 2025. The bearish monthly report from the IEA is what it is, but the closer we get to 2026, the more likely the IEA is of being ball-park right in its outlook. In its monthly report today the IEA estimates that the need for crude oil from OPEC in 2026 will be 25.4 mb/d versus production by the group in September of 29.1 mb/d. The group thus needs to do some serious cutting at the end of 2025 if it wants to keep the market balanced and avoid inventories from skyrocketing. Given that IEA is correct that is. We do however expect OPEC to implement cuts to avoid a large increase in inventories in Q1-26. The group will probably revert to cuts either at its early December meeting when they discuss production for January or in early January when they discuss production for February. The oil price will likely head yet lower until the group reverts to cuts.
Dubai: The Mid-East anchor dragging crude oil lower. Surplus emerging in Mid-East pricing. Crude oil prices held surprisingly strong all through the summer. A sign and a key source of that strength came from the strength in the front-end backwardation of the Dubai crude oil curve. It held out strong from mid-June and all until late September with an average 1-3mth time-spread premium of $1.8/b from mid-June to end of September. The 1-3mth time-spreads for Brent and WTI however were in steady deterioration from late June while their flat prices probably were held up by the strength coming from the Persian Gulf. Then in late September the strength in the Dubai curve suddenly collapsed. Since the start of October it has been weaker than both the Brent and the WTI curves. The Dubai 1-3mth time-spread now only stands at $0.25/b. The Middle East is now exporting more as it is producing more and also consuming less following elevated summer crude burn for power (Aircon) etc.
The only bear-element missing is a sudden and solid rise in OECD stocks. The only thing that is missing for the bear-case everyone have been waiting for is a solid, visible rise in OECD stocks in general and US oil stocks specifically. So watch out for US API indications tomorrow and official US oil inventories on Thursday.
No sign of any kind of fire-sale of oil from Saudi Arabia yet. To what we can see, Saudi Arabia is not at all struggling to sell its oil. It only lowered its Official Selling Prices (OSPs) to Asia marginally for November. A surplus market + Saudi determination to sell its oil to the market would normally lead to a sharp lowering of Saudi OSPs to Asia. Not yet at least and not for November.
The 5yr contract close to fixed at $68/b. Of importance with respect to how far down oil can/will go. When the oil market moves into a surplus then the spot price starts to trade in a large discount to the 5yr contract. Typically $10-15/b below the 5yr contract on average in bear-years (2009, 2015, 2016, 2020). But the 5yr contract is usually pulled lower as well thus making this approach a moving target. But the 5yr contract price has now been rock solidly been pegged to $68/b since 2022. And in the 2022 bull-year (Brent spot average $99/b), the 5yr contract only went to $72/b on average. If we assume that the same goes for the downside and that 2026 is a bear-year then the 5yr goes to $64/b while the spot is trading at a $10-15/b discount to that. That would imply an average spot price next year of $49-54/b. But that is if OPEC doesn’t revert to cuts and instead keeps production flowing. We think OPEC(+) will trim/cut production as needed into 2026 to prevent a huge build-up in global oil stocks and a crash in prices. But for now we are still heading lower. Into the $50ies/b.
Some rebound but not much. Brent crude rebounded 1.5% yesterday to $65.47/b. This morning it is inching 0.2% up to $65.6/b. The lowest close last week was on Thursday at $64.11/b.
The curve structure is almost as week as it was before the weekend. The rebound we now have gotten post the message from OPEC+ over the weekend is to a large degree a rebound along the curve rather than much strengthening at the front-end of the curve. That part of the curve structure is almost as weak as it was last Thursday.
We are still on a weakening path. The message from OPEC+ over the weekend was we are still on a weakening path with rising supply from the group. It is just not as rapidly weakening as was feared ahead of the weekend when a quota hike of 500 kb/d/mth for November was discussed.
The Brent curve is on its way to full contango with Brent dipping into the $50ies/b. Thus the ongoing weakening we have had in the crude curve since the start of the year, and especially since early June, will continue until the Brent crude oil forward curve is in full contango along with visibly rising US and OECD oil inventories. The front-month Brent contract will then flip down towards the $60/b-line and below into the $50ies/b.
At what point will OPEC+ turn to cuts? The big question then becomes: When will OPEC+ turn around to make some cuts? At what (price) point will they choose to stabilize the market? Because for sure they will. Higher oil inventories, some more shedding of drilling rigs in US shale and Brent into the 50ies somewhere is probably where the group will step in.
There is nothing we have seen from the group so far which indicates that they will close their eyes, let the world drown in oil and the oil price crash to $40/b or below.
The message from OPEC+ is also about balance and stability. The world won’t drown in oil in 2026. The message from the group as far as we manage to interpret it is twofold: 1) Taking back market share which requires a lower price for non-OPEC+ to back off a bit, and 2) Oil market stability and balance. It is not just about 1. Thus fretting about how we are all going to drown in oil in 2026 is totally off the mark by just focusing on point 1.
When to buy cal 2026? Before Christmas when Brent hits $55/b and before OPEC+ holds its last meeting of the year which is likely to be in early December.
Brent crude oil prices have rebounded a bit along the forward curve. Not much strengthening in the structure of the curve. The front-end backwardation is not much stronger today than on its weakest level so far this year which was on Thursday last week.

The front-end backwardation fell to its weakest level so far this year on Thursday last week. A slight pickup yesterday and today, but still very close to the weakest year to date. More oil from OPEC+ in the coming months and softer demand and rising inventories. We are heading for yet softer levels.

Down to the lowest since early May. Brent crude has fallen sharply the latest four days. It closed at USD 64.11/b yesterday which is the lowest since early May. It is staging a 1.3% rebound this morning along with gains in both equities and industrial metals with an added touch of support from a softer USD on top.
What stands out the most to us this week is the collapse in the Dubai one to three months time-spread.
Dubai is medium sour crude. OPEC+ is in general medium sour crude production. Asian refineries are predominantly designed to process medium sour crude. So Dubai is the real measure of the balance between OPEC+ holding back or not versus Asian oil demand for consumption and stock building.
A sharp weakening of the front-end of the Dubai curve. The front-end of the Dubai crude curve has been holding out very solidly throughout this summer while the front-end of the Brent and WTI curves have been steadily softening. But the strength in the Dubai curve in our view was carrying the crude oil market in general. A source of strength in the crude oil market. The core of the strength.
The now finally sharp decline of the front-end of the Dubai crude curve is thus a strong shift. Weakness in the Dubai crude marker is weakness in the core of the oil market. The core which has helped to hold the oil market elevated.
Facts supports the weakening. Add in facts of Iraq lifting production from Kurdistan through Turkey. Saudi Arabia lifting production to 10 mb/d in September (normal production level) and lifting exports as well as domestic demand for oil for power for air con is fading along with summer heat. Add also in counter seasonal rise in US crude and product stocks last week. US oil stocks usually decline by 1.3 mb/week this time of year. Last week they instead rose 6.4 mb/week (+7.2 mb if including SPR). Total US commercial oil stocks are now only 2.1 mb below the 2015-19 seasonal average. US oil stocks normally decline from now to Christmas. If they instead continue to rise, then it will be strongly counter seasonal rise and will create a very strong bearish pressure on oil prices.
Will OPEC+ lift its voluntary quotas by zero, 137 kb/d, 500 kb/d or 1.5 mb/d? On Sunday of course OPEC+ will decide on how much to unwind of the remaining 1.5 mb/d of voluntary quotas for November. Will it be 137 kb/d yet again as for October? Will it be 500 kb/d as was talked about earlier this week? Or will it be a full unwind in one go of 1.5 mb/d? We think most likely now it will be at least 500 kb/d and possibly a full unwind. We discussed this in a not earlier this week: ”500 kb/d of voluntary quotas in October. But a full unwind of 1.5 mb/d”
The strength in the front-end of the Dubai curve held out through summer while Brent and WTI curve structures weakened steadily. That core strength helped to keep flat crude oil prices elevated close to the 70-line. Now also the Dubai curve has given in.

Brent crude oil forward curves

Total US commercial stocks now close to normal. Counter seasonal rise last week. Rest of year?

Total US crude and product stocks on a steady trend higher.


Guld och silver stiger hela tiden mot nya höjder
The Mid-East anchor dragging crude oil lower

Samtal om sällsynta jordartsmetaller, guld och silver

Brookfield köper bränsleceller för 5 miljarder USD av Bloom Energy för att driva AI-datacenter

Teck Resources kan förse Nordamerika och kanske hela G7 med all germanium som behövs

Tyskland har så höga elpriser att företag inte har råd att använda elektricitet

OPEC+ missar produktionsmål, stöder oljepriserna

Ett samtal om guld, olja, fjärrvärme och förnybar energi
Brent crude ticks higher on tension, but market structure stays soft

Guld nära 4000 USD och silver 50 USD, därför kan de fortsätta stiga
-
Nyheter4 veckor sedan
Tyskland har så höga elpriser att företag inte har råd att använda elektricitet
-
 Nyheter3 veckor sedan
OPEC+ missar produktionsmål, stöder oljepriserna
-
 Nyheter3 veckor sedan
Ett samtal om guld, olja, fjärrvärme och förnybar energi
-
Analys4 veckor sedan
Brent crude ticks higher on tension, but market structure stays soft
-
 Nyheter2 veckor sedan
Guld nära 4000 USD och silver 50 USD, därför kan de fortsätta stiga
-
Analys3 veckor sedan
Are Ukraine’s attacks on Russian energy infrastructure working?
-

 Nyheter3 veckor sedan
Guldpriset uppe på nya höjder, nu 3750 USD
-

 Nyheter2 veckor sedan
Blykalla och amerikanska Oklo inleder ett samarbete