

Analys
Strategikommentar till Råvarumarknaden

 Tillbaka i selen
Det var länge sedan semesterperioden medförde så stora rörelser på råvarumarknaden som i år. Greklandsoro, Kinaoro och starkare USD har varit en cocktail (har alltid tre ingredienser, varav en starkare) som sänkt råvarumarknaden. I analysen nedan har vi kortfattat summerat marknadsrörelserna och vad man ska fästa uppmärksamheten på inför hösten när de flesta nu, tyvärr är tillbaka lagom till sommarvärmen anlänt. Till årsskiftet är vi neutrala till Brentolja och koppar, tror på lägre priser för järnmalm och högre priser för aluminium, zink och nickel men med brasklappen att vi är övertygade om att Indonesien kommer riva upp exportförbudet på nickelmalm senast under 2016.
Oljan i centrum
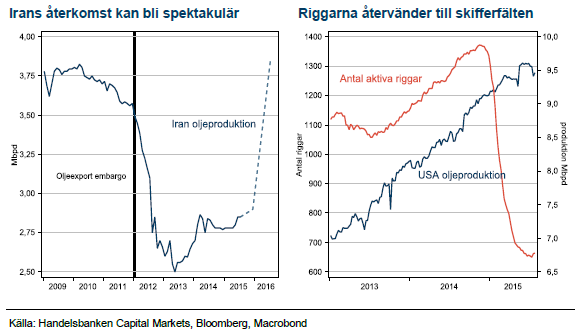
Vi har länge haft en negativ syn på oljepriset men togs med häpnad av kraften i nedgången de sista två veckorna. Vi sätter utvecklingen kring Irans återkomst till exportmarknaden som det viktigaste kortet under H2 och H1 2016. Vi avviker från konsensus genom att tro att Iran kan nå mycket av sin kapacitet inom sex månader efter att sanktionerna hävs. Iran har kompetens, utrustning och viljan att komma tillbaka. Därefter kommer USA:s skifferproducenter som börjat öka antalet aktiva borriggar igen efter en botten i juni. I tredje hand kommer utsikterna för svagare efterfrågan från Kina efter börstumultet, även här avviker vi från konsensus och tror att Kina snarare kan överraska positivt och absorbera nya marginalfat från Iran – Kina är världens mest priselastiska oljekonsument. Det kommer alltså finnas en tagare av Irans olja men till ett lägre pris. Vi tror på Brent omkring 45-50 vid nyår.
Iran
Iran säger sig vara redo att öka sin produktion med 1 Mbpd inom sex månader efter att sanktionerna hävs. Detta möts med skepsis i omvärlden som jämför Irans återkomst med andra länders oljeproduktion som legat nere. Vi tror att Iran är annorlunda då sanktionerna inte medfört inhemsk politisk splittring såsom till exempel kriget i Libyen. Iran är också ett land som i decennier levt isolerat och har därför tillgång till industriexpertis och nödvändig utrustning från inhemska källor.
USA:s skifferolja
Tematiskt för vårens återhämtning i oljepriset från 46 till USD 67 var den rekordsnabba avställningen av borriggar i USA:s skifferfält. Parallellt drev skifferbolagen en kostnadseffektivisering och när WTI priserna nådde över USD 60 i maj och juni gick det att hedga produktionen för 2016 och 17 på USD 60-65. Med de hedgarna är det nu inte förvånande att antalet riggar stigit med 31 stycken från botten på 659 den 26 juni. Riggarna återvänder till fält av olika typ i olika delstater, varför kostnadsanpassning och hedgar sannolikt ligger bakom en mer uttålig produktion -det handlar inte längre om att flytta riggar till de bästa fälten.
Kopparkollapsen kom med storm
Koppar har varit sista råvara att fortfarande handlas till premium över produktionskostnaden. Efter årets prisnedgång har nu koppar rättat sig i ledet. Ny produktion har varit svår att få till marknaden men under 2015 ser vi ökad produktion som främsta drivkraft till lägre pris. Den höga tillväxttakten är dock kortvarig och koppar liknar inte järnmalm som har överskott i marknadsbalansen inom överskådlig framtid. Redan nästa år avtar tillväxttakten och då kräver lägre priser väsentligt lägre efterfrågan i Kina. Riktigt där är vi inte, trots börskollapsen, och vi tror koppar slutar året omkring dagens nivåer på USD 5000-5500.
Kinas aluminiumproduktion pressar priset till ny intervall
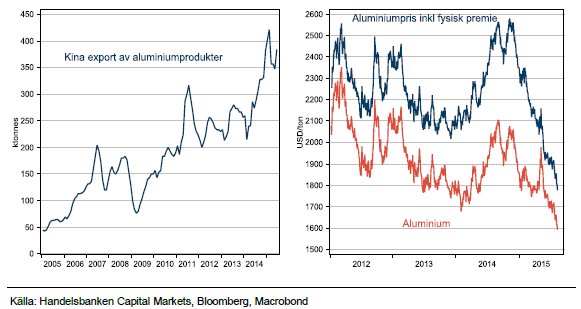
Aluminium har som processmetall varit relativt lättanalyserad. Ledig kapacitet låser in metallen mellan produktionskostnaden och incitamentspriset för att starta upp avställda smältverk. Lägre energipriser har sänkt golv och tak med omkring USD 100. Det som förändrat och försvårat bilden är Kinas omslag till nettoexport av aluminium. Exporten har stabiliserats på höga nivåer efter att de nya vertikalt integrerade smältverken i Inre Mongoliet har poppat upp. Vi tror inte exporten kommer minska men de låga priserna kommer snart tvinga USD producerande smältverk i Väst ur produktion och lyfta priset. Vi tror på priser omkring USD 1700 med en fysisk premie på USD 200 vid årsskiftet.
Nickel handlas långt ner i kostnadskurvan
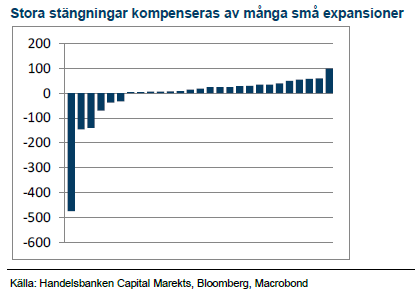
Nickel störtdök till USD 10683 i början av juli och har efter en initial återhämtning segat sig tillbaka ned under 11000. Kinas export har stabiliserats sig på höga nivåer och pressar marknaden för rostfritt stål i Europa och USA, vilket gör att efterfrågan på LME nickel är låg. Kinas produktion av rostfritt har lyckats ställa om till att använda malm från Filippinerna istället för Indonesien vilket gör att Nickel Pig Iron – industrin fortsätter sin produktion, om än i något lägre volymtermer, vilket kompenseras av att inhemska efterfrågan i Kina svalnat. Priserna är låga men ännu har vi inte sett stängningar av gruvor, vilket borde komma närsom och ge priset stöd. Fram till nyår tror vi på högre priser, drivet av gruvstängningar eller utbudsstörningar. I andra vågskålen ligger risken att Indonesien river upp sitt exportförbud av nickelmalm. Gissningsvis 25% risk att det sker under H2 annars under 2016, vilket kommer föra priserna till nya bottennivåer. Snipp snapp snute så var nickelsagan ute.
Zink – kommer rallyt till slut?
Av sommarens prisnedgångar är zink den som förvånar mest. Det kommande temat med flera stora gruvor som stänger är välbekant och har vid tidigare nedgångar i basmetallpriser gett zink stöd. Zink har också en ovanligt hög andel av produktionen i USD-länder (inkl Kina), varför den starkare dollarn inte ger producenterna någon fördel. Kommande zinkprojekt som delvis ska kompensera för de kommande stängningarna av några få stora gruvor kräver zinkpriser över USD 2200. Vi tror därför att zink stiger fram till nyår med riktpris på 2200.
Varje nytt ton järnmalm kräver nu att ett gammalt stängs ner
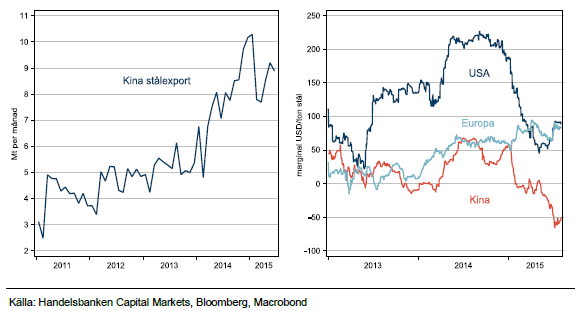
Under 2015 har det blivit allt mer uppenbart att toppen i Kinas stålproduktion inföll under 2014. Stålproduktionen kommer falla under 2015 och sedan ytterligare under 2016. När Kina står för halva världens efterfrågan blir järnmalmsproducenternas jakt på lägre rörlig kostnader genom expansion allt mer bisarr. Framöver måste varje nytt ton som tillförs marknaden kompenseras av att någon annan stänger ner ett utkonkurrerat ton eftersom global efterfrågan i bästa fall kan vara konstant. I denna ekvation kan priserna omöjligen stiga och vi tror att priserna ånyo kommer under press. Det osäkra kortet är hur länge Kina mäktar med att subventionera sin inhemska olönsamma järnmalmsproduktion. Gissningsvis ett bra tag till.
Stålpriserna stabiliseras
Den svaga efterfrågan på stål i Kina har sänkt lönsamheten till den sämsta sedan vår modellering började 2007. Kinesiska stålverk går minus omkring USD 50 på varje producerat ton när det låga kapacitetsutnyttjandet har höjt den rörliga kostnaden. För att absorbera mer fasta kostnader exporteras allt större volymer till cash cost. Detta har pressat, men också stabiliserat priserna i USA och Europa eftersom utrymmet för prishöjningar på baskvalitéer är litet.
Segfärdig Fed tänder guldets glans
Fed borde enligt alla historiska mått redan ha börjat höja räntan, att det dröjer har flera förklaringar. Det är rimligt att USA får en försenad inflationsimpuls från oljeprisuppgången under maj och juni under hösten. Därefter ser vi två möjliga scenario för fed:
- Fed börjar höja och guld ökar i attraktion som inflationshedge.
- Fed börjar höja men inflationen uteblir, bland annat på grund av ny oljeprisnedgång.
Fed måste då avvakta eller till och med backa vilket skulle betraktas som positivt för guld. Marknaden skulle tvivla på Fed:s förmåga att normalisera penningpolitiken om Fed inte genomför höjningscykeln som den aviserat. Vi tror därför på högre guldpris oavsett hur det går för Fed, även om guld fallit under sommaren.
[box]SHB Råvarukommentar är producerat av Handelsbanken och publiceras i samarbete och med tillstånd på Råvarumarknaden.se[/box]
Ansvarsbegränsning
Detta material är producerat av Svenska Handelsbanken AB (publ) i fortsättningen kallad Handelsbanken. De som arbetar med innehållet är inte analytiker och materialet är inte oberoende investeringsanalys. Innehållet är uteslutande avsett för kunder i Sverige. Syftet är att ge en allmän information till Handelsbankens kunder och utgör inte ett personligt investeringsråd eller en personlig rekommendation. Informationen ska inte ensamt utgöra underlag för investeringsbeslut. Kunder bör inhämta råd från sina rådgivare och basera sina investeringsbeslut utifrån egen erfarenhet.
Informationen i materialet kan ändras och också avvika från de åsikter som uttrycks i oberoende investeringsanalyser från Handelsbanken. Informationen grundar sig på allmänt tillgänglig information och är hämtad från källor som bedöms som tillförlitliga, men riktigheten kan inte garanteras och informationen kan vara ofullständig eller nedkortad. Ingen del av förslaget får reproduceras eller distribueras till någon annan person utan att Handelsbanken dessförinnan lämnat sitt skriftliga medgivande. Handelsbanken ansvarar inte för att materialet används på ett sätt som strider mot förbudet mot vidarebefordran eller offentliggörs i strid med bankens regler.


Some rebound but not much. Brent crude rebounded 1.5% yesterday to $65.47/b. This morning it is inching 0.2% up to $65.6/b. The lowest close last week was on Thursday at $64.11/b.

The curve structure is almost as week as it was before the weekend. The rebound we now have gotten post the message from OPEC+ over the weekend is to a large degree a rebound along the curve rather than much strengthening at the front-end of the curve. That part of the curve structure is almost as weak as it was last Thursday.
We are still on a weakening path. The message from OPEC+ over the weekend was we are still on a weakening path with rising supply from the group. It is just not as rapidly weakening as was feared ahead of the weekend when a quota hike of 500 kb/d/mth for November was discussed.
The Brent curve is on its way to full contango with Brent dipping into the $50ies/b. Thus the ongoing weakening we have had in the crude curve since the start of the year, and especially since early June, will continue until the Brent crude oil forward curve is in full contango along with visibly rising US and OECD oil inventories. The front-month Brent contract will then flip down towards the $60/b-line and below into the $50ies/b.
At what point will OPEC+ turn to cuts? The big question then becomes: When will OPEC+ turn around to make some cuts? At what (price) point will they choose to stabilize the market? Because for sure they will. Higher oil inventories, some more shedding of drilling rigs in US shale and Brent into the 50ies somewhere is probably where the group will step in.
There is nothing we have seen from the group so far which indicates that they will close their eyes, let the world drown in oil and the oil price crash to $40/b or below.
The message from OPEC+ is also about balance and stability. The world won’t drown in oil in 2026. The message from the group as far as we manage to interpret it is twofold: 1) Taking back market share which requires a lower price for non-OPEC+ to back off a bit, and 2) Oil market stability and balance. It is not just about 1. Thus fretting about how we are all going to drown in oil in 2026 is totally off the mark by just focusing on point 1.
When to buy cal 2026? Before Christmas when Brent hits $55/b and before OPEC+ holds its last meeting of the year which is likely to be in early December.
Brent crude oil prices have rebounded a bit along the forward curve. Not much strengthening in the structure of the curve. The front-end backwardation is not much stronger today than on its weakest level so far this year which was on Thursday last week.

The front-end backwardation fell to its weakest level so far this year on Thursday last week. A slight pickup yesterday and today, but still very close to the weakest year to date. More oil from OPEC+ in the coming months and softer demand and rising inventories. We are heading for yet softer levels.

Down to the lowest since early May. Brent crude has fallen sharply the latest four days. It closed at USD 64.11/b yesterday which is the lowest since early May. It is staging a 1.3% rebound this morning along with gains in both equities and industrial metals with an added touch of support from a softer USD on top.
What stands out the most to us this week is the collapse in the Dubai one to three months time-spread.
Dubai is medium sour crude. OPEC+ is in general medium sour crude production. Asian refineries are predominantly designed to process medium sour crude. So Dubai is the real measure of the balance between OPEC+ holding back or not versus Asian oil demand for consumption and stock building.
A sharp weakening of the front-end of the Dubai curve. The front-end of the Dubai crude curve has been holding out very solidly throughout this summer while the front-end of the Brent and WTI curves have been steadily softening. But the strength in the Dubai curve in our view was carrying the crude oil market in general. A source of strength in the crude oil market. The core of the strength.
The now finally sharp decline of the front-end of the Dubai crude curve is thus a strong shift. Weakness in the Dubai crude marker is weakness in the core of the oil market. The core which has helped to hold the oil market elevated.
Facts supports the weakening. Add in facts of Iraq lifting production from Kurdistan through Turkey. Saudi Arabia lifting production to 10 mb/d in September (normal production level) and lifting exports as well as domestic demand for oil for power for air con is fading along with summer heat. Add also in counter seasonal rise in US crude and product stocks last week. US oil stocks usually decline by 1.3 mb/week this time of year. Last week they instead rose 6.4 mb/week (+7.2 mb if including SPR). Total US commercial oil stocks are now only 2.1 mb below the 2015-19 seasonal average. US oil stocks normally decline from now to Christmas. If they instead continue to rise, then it will be strongly counter seasonal rise and will create a very strong bearish pressure on oil prices.
Will OPEC+ lift its voluntary quotas by zero, 137 kb/d, 500 kb/d or 1.5 mb/d? On Sunday of course OPEC+ will decide on how much to unwind of the remaining 1.5 mb/d of voluntary quotas for November. Will it be 137 kb/d yet again as for October? Will it be 500 kb/d as was talked about earlier this week? Or will it be a full unwind in one go of 1.5 mb/d? We think most likely now it will be at least 500 kb/d and possibly a full unwind. We discussed this in a not earlier this week: ”500 kb/d of voluntary quotas in October. But a full unwind of 1.5 mb/d”
The strength in the front-end of the Dubai curve held out through summer while Brent and WTI curve structures weakened steadily. That core strength helped to keep flat crude oil prices elevated close to the 70-line. Now also the Dubai curve has given in.

Brent crude oil forward curves

Total US commercial stocks now close to normal. Counter seasonal rise last week. Rest of year?

Total US crude and product stocks on a steady trend higher.

Analys
OPEC+ will likely unwind 500 kb/d of voluntary quotas in October. But a full unwind of 1.5 mb/d in one go could be in the cards
Down to mid-60ies as Iraq lifts production while Saudi may be tired of voluntary cut frugality. The Brent December contract dropped 1.6% yesterday to USD 66.03/b. This morning it is down another 0.3% to USD 65.8/b. The drop in the price came on the back of the combined news that Iraq has resumed 190 kb/d of production in Kurdistan with exports through Turkey while OPEC+ delegates send signals that the group will unwind the remaining 1.65 mb/d (less the 137 kb/d in October) of voluntary cuts at a pace of 500 kb/d per month pace.
Signals of accelerated unwind and Iraqi increase may be connected. Russia, Kazakhstan and Iraq were main offenders versus the voluntary quotas they had agreed to follow. Russia had a production ’debt’ (cumulative overproduction versus quota) of close to 90 mb in March this year while Kazakhstan had a ’debt’ of about 60 mb and the same for Iraq. This apparently made Saudi Arabia angry this spring. Why should Saudi Arabia hold back if the other voluntary cutters were just freeriding? Thus the sudden rapid unwinding of voluntary cuts. That is at least one angle of explanations for the accelerated unwinding.
If the offenders with production debts then refrained from lifting production as the voluntary cuts were rapidly unwinded, then they could ’pay back’ their ’debts’ as they would under-produce versus the new and steadily higher quotas.
Forget about Kazakhstan. Its production was just too far above the quotas with no hope that the country would hold back production due to cross-ownership of oil assets by international oil companies. But Russia and Iraq should be able to do it.
Iraqi cumulative overproduction versus quotas could reach 85-90 mb in October. Iraq has however steadily continued to overproduce by 3-5 mb per month. In July its new and gradually higher quota came close to equal with a cumulative overproduction of only 0.6 mb that month. In August again however its production had an overshoot of 100 kb/d or 3.1 mb for the month. Its cumulative production debt had then risen to close to 80 mb. We don’t know for September yet. But looking at October we now know that its production will likely average close to 4.5 mb/d due to the revival of 190 kb/d of production in Kurdistan. Its quota however will only be 4.24 mb/d. Its overproduction in October will thus likely be around 250 kb/d above its quota with its production debt rising another 7-8 mb to a total of close to 90 mb.
Again, why should Saudi Arabia be frugal while Iraq is freeriding. Better to get rid of the voluntary quotas as quickly as possible and then start all over with clean sheets.
Unwinding the remaining 1.513 mb/d in one go in October? If OPEC+ unwinds the remaining 1.513 mb/d of voluntary cuts in one big go in October, then Iraq’s quota will be around 4.4 mb/d for October versus its likely production of close to 4.5 mb/d for the coming month..
OPEC+ should thus unwind the remaining 1.513 mb/d (1.65 – 0.137 mb/d) in one go for October in order for the quota of Iraq to be able to keep track with Iraq’s actual production increase.
October 5 will show how it plays out. But a quota unwind of at least 500 kb/d for Oct seems likely. An overall increase of at least 500 kb/d in the voluntary quota for October looks likely. But it could be the whole 1.513 mb/d in one go. If the increase in the quota is ’only’ 500 kb/d then Iraqi cumulative production will still rise by 5.7 mb to a total of 85 mb in October.
Iraqi production debt versus quotas will likely rise by 5.7 mb in October if OPEC+ only lifts the overall quota by 500 kb/d in October. Here assuming historical production debt did not rise in September. That Iraq lifts its production by 190 kb/d in October to 4.47 mb/d (August level + 190 kb/d) and that OPEC+ unwinds 500 kb/d of the remining quotas in October when they decide on this on 5 October.


Samtal om sällsynta jordartsmetaller, guld och silver

Brookfield köper bränsleceller för 5 miljarder USD av Bloom Energy för att driva AI-datacenter

Teck Resources kan förse Nordamerika och kanske hela G7 med all germanium som behövs

Leading Edge Materials är på rätt plats i rätt tid

Oljepriset faller efter ny handelskonflikt mellan USA och Kina

Kinas elproduktion slog nytt rekord i augusti, vilket även kolkraft gjorde

Tyskland har så höga elpriser att företag inte har råd att använda elektricitet

OPEC+ missar produktionsmål, stöder oljepriserna

Ett samtal om guld, olja, fjärrvärme och förnybar energi
Brent crude ticks higher on tension, but market structure stays soft
-
 Nyheter4 veckor sedan
Kinas elproduktion slog nytt rekord i augusti, vilket även kolkraft gjorde
-
Nyheter4 veckor sedan
Tyskland har så höga elpriser att företag inte har råd att använda elektricitet
-
 Nyheter3 veckor sedan
OPEC+ missar produktionsmål, stöder oljepriserna
-
 Nyheter3 veckor sedan
Ett samtal om guld, olja, fjärrvärme och förnybar energi
-
Analys4 veckor sedan
Brent crude ticks higher on tension, but market structure stays soft
-
Analys3 veckor sedan
Are Ukraine’s attacks on Russian energy infrastructure working?
-

 Nyheter2 veckor sedan
Guld nära 4000 USD och silver 50 USD, därför kan de fortsätta stiga
-

 Nyheter3 veckor sedan
Guldpriset uppe på nya höjder, nu 3750 USD