

Analys
SHB Råvarubrevet 8 november 2013

 Råvaror allmänt
Nu eller aldrig
Senaste omgången av globala inköpschefsindex (PMI) indikerar en fortsatt stark utveckling. 26 av 29 länder ligger över 50 strecket och 21 länder hade högre PMI i oktober än september, det är högsta nivån sedan maj 2011. Vårt tema med ett starkt andra halvår för kinesisk makroekonomi håller i sig. Kopparimporten till Kina ligger över fjolårets nivåer, produktionen av kopparintensiva luftkonditioneringar lika så. 30 % av Kinas kopparkonsumtion sker i byggsektorn och stigande fastighetspriser indikerar högre byggaktivitet. Idag fredag börjar kinas ledare sitt stora strategimöte som vi fick intrycket av att hela landet väntade på när vi var i Kina i september på råvaruresa. Utkomsten av mötet ska presenteras på tisdag morgon och vi förväntar oss tyngdpunkt på reformer men även tillväxtstarka uttalande som kommer ge råvaror en vidare skjuts uppåt. I veckan överraskade ECB marknaden och sänkte styrräntan med 0,25 procent.
Så här långt in i Q4 har annars trenderna för råvaror varit annorlunda än under Q3. Under Q3 var ett brett råvaruindex en bra investering då priserna steg på bred front (utbudsstörning i olja och short covering i guld och koppar) dessutom låg, framförallt oljemarknaden i stark backwardation vilket gav extra intjäning på rullningen av terminskontrakten. Under oktober har prisuppgången stannat av och oljemarknadens terminskurva lutar inte lika brant längre. Under kommande vecka kan den riskvillige satsa på kinadrivna råvaror. Positiva signaler från högmötet i Peking kommer säkert driva koppar, nickel och olja högre.
Basmetaller
Produktionsöverskott tynger basmetallerna
LME:s Basmetallindex faller tillbaka närmare 1.9 procent under veckan och gapet mot aktiemarknaden ökar ytterligare. Produktionsöverskottet är det som fortsätter att tynga metallsektorn, både stål och basmetaller, även om kinesiska Minmetals signalerar att överskottet på just Zink kommer att minska betydligt mycket mer än väntat nästa år.
Det är framför allt Aluminium som hamnar i fokus och drar med sig övriga metaller. Överskottet på Aluminium kommer att bestå tills dess att Kina börjar stänga ned kapacitet och det verkar inte troligt på kort till medellång sikt om man ser till lokala myndigheters behov att hålla sysselsättningen hög. Kina står för ungefär 44 procent av världens aluminiumproduktion och på dessa nivåer kring USD 1810 per ton innebär det en förlust om ca 110-120 dollar per ton. Så länge man får tillgång till billig mark och subventionerade elpriser verkar det med andra ord som man accepterar denna förlust tills vidare. Vår bedömning är fortsatt att basmetallerna bottnade ur under sommaren och detta är bra nivåer att köpa på sig metaller.
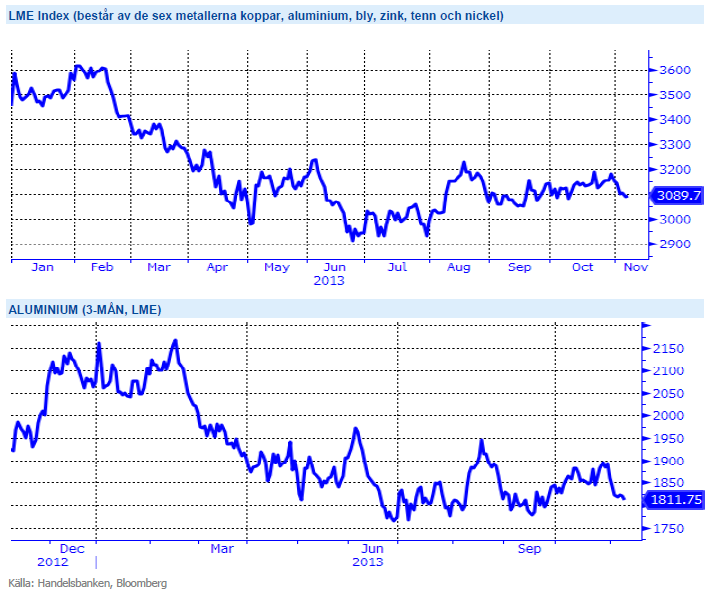
Vi tror att Kinas tillväxt kommer överraska positivt under Q4 och Q1, vilket kommer stärka metallerna. Vi tror på: LONG BASMETALLER
Ädelmetaller
ECB:s räntesänkning förbryllar guldet
Vi bibehåller vår negativa syn på guldet, sedan förra råvarubrevet har guldpriset fallit med ca 3 procent. Stark amerikansk BNP igår ställdes mot ECB:s närmast helt oväntade räntesänkning från 0,50 till 0,25 procent, och guldet reagerade med ett uppställ följt av ett större nerställ. Detta är en helt logisk reaktion givet att signalerna nu är väldigt otydliga. Vi går emot en miljö där de största regionerna i världen kommer att gå på väldigt olika växlar vilket skapar en situation där guldet inte kan reagera som ett risk på/ risk av-instrument, utan priset kommer att styras av investerares flöden i ETF:er och fysiskt investeringsguld, och naturligtvis även dollarutvecklingen. Vi fortsätter notera små utflöden ur ETF:er, så guldet får ingen draghjälp därifrån.
Vårt basresonemang runt den negativa synen på guldet är ju att det drivs primärt av aktörers vilja att tjäna pengar – inte av reala fysiska behov som övriga råvaror – vilket i en nedåttrend som nu gör utvecklingen svår att vända. Data från USA fortsätter att peka mot att Federal Reserve kommer att minska sina stimulanser (tapering) i början av nästa år, vilket sannolikt kommer att sätta ytterligare press neråt på guldet. 1000 dollar per uns ligger tillräckligt nära för att ses som en risknivå om priset nu börjar glida neråt igen.
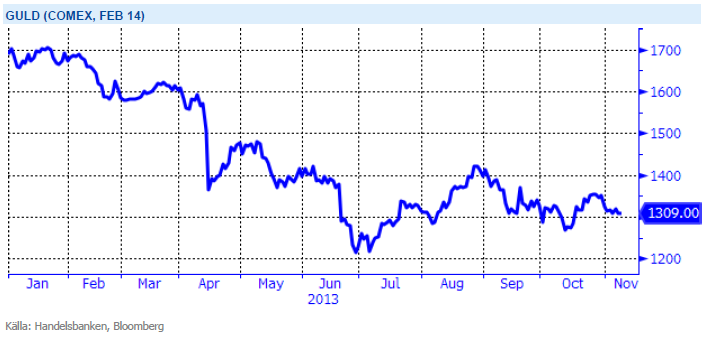
Efter en uppgång under sommaren tror vi åter att guldets väg lutar utför. Vi tror på: SHRT GULD H
Energi
Oljan backar
Under veckan har oljepriset handlats ner med drygt 2 procent. Sentimentet tyngs av produktion över förväntan (främst USA) samt signaler på att Libyen återupptar takten snabbare än väntat. Lagersiffrorna visar på fortsatt ökning även denna vecka varför vi finner dagens nivå köpvärd och ser risken på nedsidan begränsad.
Utsläppsrätterna handlas på låga nivåer och även om det är ett känsligt läge för Europa att påtvinga industrin dessa kostnader bör de ändå komma att stiga något på sikt för att skapa någon form av incitament för att sänka utsläppen. Vi har idag ett underskott i energibalansen vilket i kombination med kärnkraftens relativa betydelse inför vintern, något som brukar överraska när den som mest behövs, bör vi ha scenario med stigande priser i en ganska lugn takt.
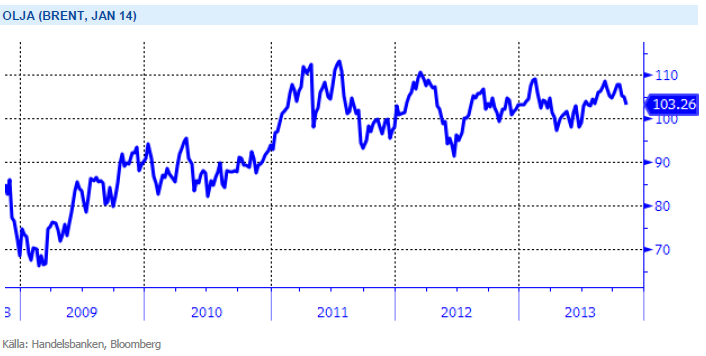
Energiunderskott tillsammans med osäkerhet kring kärnkraftsverken inför vintern talar för högre elpris. Vi tror på: LONG EL
Livsmedel
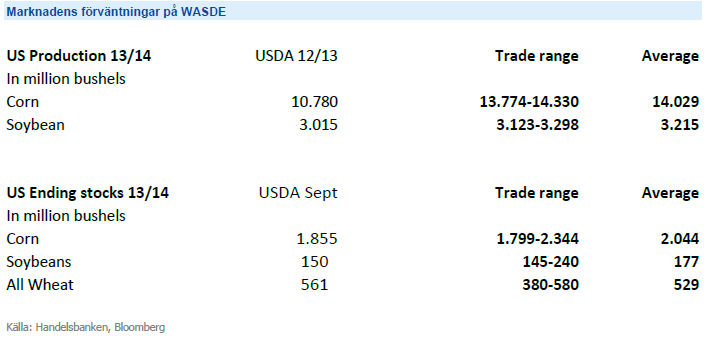
Inför WASDE
Ikväll kl:18.00 släpper amerikanska jordbruksdepartementet äntligen den efterlängtade WASDE-rapporten. Efter den uteblivna oktoberrapporten i samband med budgetdiskussionerna i USA har vi vittnat om en svajig marknad. Här nedan redovisas marknadens förväntningar på de amerikanska lager- och produktionssiffrorna för säsongen 2013/14 – först produktionssiffror och sedan lagersiffror.
Produktionen av majs väntas bli klart mycket högre, som följd av goda skördar i USA jämfört med föregående år. För både majs och sojabönor beräknas förväntat utgående lager 13/14 att justeras upp medan marknadens förväntningar pekar på en justering ned av vetelagren, som följd av ökad export. Ponera att de låga majspriserna i relation till sojapriserna håller i sig, så tror vi att det finns en stor potential att den amerikanska lantbrukaren väljer att så mer sojabönor då majsen och sojabönorna slåss om samma areal.
Efter flera år av rekordskördar handlas kaffe idag på femårslägsta. Vi finner kaffe köpvärd och ser risken på nedsidan begränsad. Vi tror på: BULL KAFFE
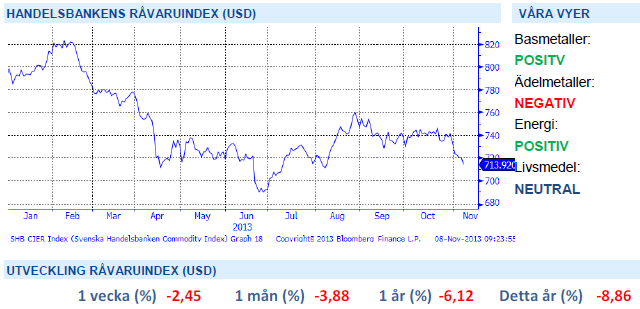
Handelsbankens Råvaruindex
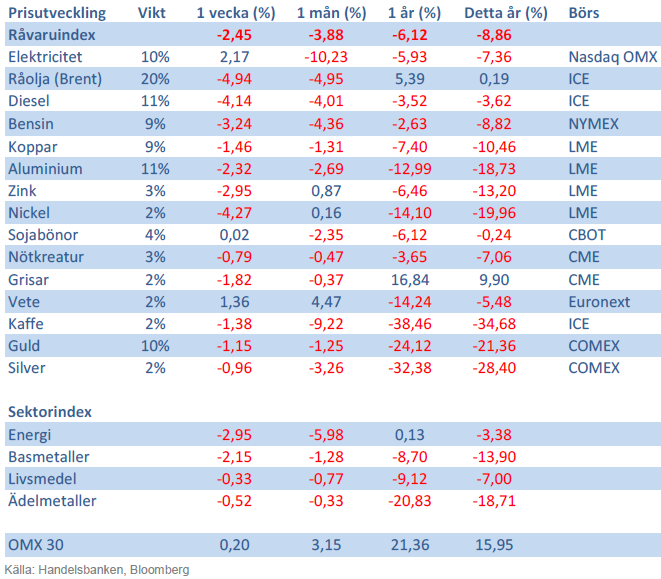
Handelsbankens råvaruindex består av de underliggande indexen för respektive råvara. Vikterna är bestämda till hälften från värdet av nordisk produktion (globala produktionen för sektorindex) och till hälften från likviditeten i terminskontrakten.
[box]SHB Råvarubrevet är producerat av Handelsbanken och publiceras i samarbete och med tillstånd på Råvarumarknaden.se[/box]
Ansvarsbegränsning
Detta material är producerat av Svenska Handelsbanken AB (publ) i fortsättningen kallad Handelsbanken. De som arbetar med innehållet är inte analytiker och materialet är inte oberoende investeringsanalys. Innehållet är uteslutande avsett för kunder i Sverige. Syftet är att ge en allmän information till Handelsbankens kunder och utgör inte ett personligt investeringsråd eller en personlig rekommendation. Informationen ska inte ensamt utgöra underlag för investeringsbeslut. Kunder bör inhämta råd från sina rådgivare och basera sina investeringsbeslut utifrån egen erfarenhet.
Informationen i materialet kan ändras och också avvika från de åsikter som uttrycks i oberoende investeringsanalyser från Handelsbanken. Informationen grundar sig på allmänt tillgänglig information och är hämtad från källor som bedöms som tillförlitliga, men riktigheten kan inte garanteras och informationen kan vara ofullständig eller nedkortad. Ingen del av förslaget får reproduceras eller distribueras till någon annan person utan att Handelsbanken dessförinnan lämnat sitt skriftliga medgivande. Handelsbanken ansvarar inte för att materialet används på ett sätt som strider mot förbudet mot vidarebefordran eller offentliggörs i strid med bankens regler.


Selling down on a ”deal”. Brent crude fell 6.2% last week with accelerated weakness towards the end of the week. Close of the week at $87.33/b and low of the week (and on Friday) of $85.8/b. Brent is falling another 4% this morning to $83.7/b on confirmation by Iran that a MoU text has been reached and that it will be signed on Friday this week.

So what is this ”deal” worth? Talk on the desk here this morning is that it is much like ”putting lipstick on a pig” where Trump has to sell this at home as a victory where ”the SoH has reopened”, the nuclear issue will be ironed out over the coming 60 days (or maybe 600 days?) and US consumers are getting a lower gasoline price and maybe US republicans survives the midterm elections.
The importance for Iran is that it emerges as the defacto winner of this war in the eyes of the non-US public world. That Iran now onwards is the ”ruler of the SoH” (combo of geography and new weapons systems like drones) or more softer: ”the guarantor of safe passage through the SoH”.
Iran doesn’t need nuclear weapons any more. Nuclear deterrence doesn’t work any more. Ukraine has made many attacks deep into Russia without being nuked in return. Plenty of Iranian ballistic rockets blasts over Israel but Iran wasn’t nuked in return.
There is no trust between the US and Iran. We don’t know all the details yet of the MoU. But what we do know is that there is no trust between the US and Iran what so ever. This is probably more like a descriptive text on how they can cooperate in a way where both sides keeps tactical leverage. Neither side makes irreversible concessions. Violations can be punished quickly. Cooperation produces immediate benefits.
This is a fragile structure. It can easily break down. There may be details which cannot be overcome. To be seen on Friday. The US has to show that it is willing put enough force behind managing and restraining Israel versus Hezbollah in Lebanon. We have seen that Netanyahu hasn’t listened all that much to Trump’s directives and wishes. This could be a major obstacle.
A gradual reopening is tactically preferable for Iran. A tactical leverage for Iran right now is that global oil stocks have been drawn down towards painful and increasingly dangerous levels with increasing risks for oil price spikes in mid-July to August. This together with US midterm elections on 3 November gives tactical leverage to Iran. Iran probably doesn’t want to fully give up on that leverage. A rapid, full reopening where global stocks are able to refill over the coming 60 days will significantly erode that leverage. If Iran reinstates a closure of the SoH after 60 days (if talks break down again), then the effect won’t be that impactful in terms of prices and the US midterm elections.
So a gradual and partial reopening where global markets gets the oil they need while they are unable to rebuild stocks could be a practical middle way for both parties. Trump can sell it as ”the SoH has reopened” and get affordable gasoline for US consumers. Iran can sell it as ”the SoH has fully reopened, but there is some friction” so flow is only 60-80% of normal.
Not much real demand destruction below $100/b. What we do know is that there is not much real price pain demand destruction for oil globally at an oil price below $100/b. A lot of demand-shock destruction. Fear. But demand should now come roaring back towards normal with fear for exceptionally high prices now is rapidly receding.
Sudden China demand destruction due to EVs? Bullocks. EV share of total Chinese carpool now around 13%. Share of new sales of EVs has reached 50%. This is a very gradual process. It doesn’t make oil demand fall like a rock over night. When EV new sales share reaches 100%, then the gasoline car pool will contract by some 5-10% per year. But that is only gasoline. Sudden reduction in Chinese oil demand is more about shock and risk.
Chinese crude oil imports will come roaring back. At what price? Today’s ”neutral” oil price is $70/b. That is the five year price which has steadily traded around the $70/b mark over the past 3-4 years. With still a risky picture one would think that China and the rest of the world will be big buyers of oil in the range of $70-85/b.
Global demand will likely snap back towards normal, forecasted demand and growth at such prices.
Physical reopening is a gradual process. The physical and practical reopening of the SoH will likely be gradual rather than sudden. And that probably suites Iran tactically as well.
Brent M1 price versus the Brent 5-yr (today’s ”normal” price)

Market is starting to take US/Iran headlines with a pinch of salt. Brent crude rose $2.8/b yesterday to an official close of $112.1/b. But after that it traded as low as $108.05/b before ending late night at around $109.7/b. Through the day it traded in a range of $106.87 – 112.72/b amid a flurry of news or rumors from Iran and the US. ”US temporary sanctions during negotiations” (falls alarm). ”We will bomb Iran” (not anyhow),… etc. While the market is still fluctuating to this kind of news flow, it is starting to take such headlines with a pinch of salt.
We’ll see. Maybe, maybe not. The Brent M1 contract is trading at $110.2/b this morning which very close to the average ticks through yesterday of $110.4/b.
Trump with bearish, verbal intervention whenever Brent trades above $110/b it seems. What seems to be a pattern is that Trump states something like ”very good negotiations going on with Iran”, ”New leaders in Iran are great,..”, ”Great progress in negotiations,…”, ”Deal in sight,..” etc whenever the Brent M1 contract trades above $110/b. An effort to cool the market. These hot air verbal interventions from Trump used to have a heavy bearish impact on prices, but they now seems to have less and less effect unless they are backed by reality.
As far as we can see there has been no real progress in the negotiations between the US and Iran with both sides still standing by their previous demands.
Iran is getting stronger while the cease fire lasts making a return to war for Trump yet harder. Iran is naturally in constant preparation for a return to war given Trump’s steady threats of bombing Iran again. Iran is naturally doing what ever is possible to prepare for a return to war. And every day the cease fire lasts it is better prepared. This naturally makes it more and more difficult and dangerous for the US to return to warring activity versus Iran as the consequences for energy infrastructure in the Persian Gulf will be more and more severe the longer the cease fire lasts. Israel seems to see it this way as well. That the war is not won and that current frozen state of a cease fire gives Iran opportunity to rebuild military and politically.
Global inventories are drawing down day by day. How much? In the meantime the Strait of Hormuz stays closed. There is varying measures and estimates of how much global inventories are drawing down. Our rough estimate, back of the envelope, is that global inventories are drawing down by at least some 10 mb/d or about 300 mb/d in a balance between loss of supply versus demand destruction. Other estimates we see are a monthly draw of 250-270 mb/d. The IEA only ’measured’ a draw in global observable stocks of 117 mb in April with oil on water rising 53 mb while on shore stocks fell 170 mb. But global stocks are hard to measure with large invisible, unmeasured stocks. As such a back of the envelope approach may be better.
Oil products is what the world is consuming. Oil product prices likely to rise while product stocks fall. Strategic Petroleum Reserves (SPR) are predominantly crude oil. Discharging oil from OECD SPR stocks, a sharp reduction in Chinese crude imports and a reduction in global refinery throughput of 6-7 mb/d has helped to keep crude oil markets satisfactorily supplied. But global inventories are drawing down none the less. And oil products is really what the world is consuming. So if global refinery throughput stays subdued, then demand will eventually have to match the supply of oil products. The likely path forward this summer is a steady draw down in jet fuel, diesel and gasoline. Higher prices for these. Then, if possible, higher refinery throughput and higher usage of crude in response to very profitable refinery margins. And lastly sharper draw in crude stocks and higher prices for these. But some 6 mb/d of oil products used to be exported through the Strait of Hormuz. And it may not be so easy to ramp up refinery activity across the world to compensate. Especially as Ukraine continues to damage Russian refineries as well as Russian crude production and export facilities.
Watch oil product stocks and prices as well as Brent calendar 2027. What to watch for this summer is thus oil product inventories falling and oil product premiums to crude rising. Another measure to watch is the Brent crude 2027 contract as it rises steadily day by day as the Strait of Hormuz stays closed and global oil inventories decline. The latter is close to the highest level since the start of the war and keeps rising.
The Brent M1 contract and the Brent 2027 prices and current price of jet fuel in Europe (ARA). All in USD/b

Our back of the envelope calculation of the global shortage created by the closure of the Strait of Hormuz. Note that 3.5 mb/d of discharge from SPR is also a draw. Note also that ’Forced demand loss’ of 2.5 mb/d is probably temporary and will fall back towards zero as logistics are sorted out leaving ’Price demand loss’ to do the job of balancing the market. Thus a shortfall of at least 9 mb/d created by the closure. More if SPR discharge is included and more if Forced demand loss recedes.

Brent is climbing higher. Front-month is at USD 106.3/bl this morning, close to a weekly high and a USD 9/bl jump from Mondays open. This is the move we flagged as a risk earlier in the week: the market shifting from ”a deal is around the corner” to ”this is going to take longer than we thought”.

Analyst Commodities, SEB
During April, rest-of-year Brent remained remarkably stable around USD 90/bl. A stability which rested on one single assumption: the SoH reopens around 1 May. That assumption is now slowly falling apart.
As we highlighted yesterday: every week of delay beyond 1 May adds (theoretically) ish USD 5/bl to the rest-of-year average, as global inventories draw 100 million barrels per week. i.e., a mid-May reopening implies rest-of-year Brent closer to USD 100/bl, and anything pushing into June or July takes us meaningfully higher.
What’s changed in the last 48 hours:
#1: The US military has formally warned that clearing suspected sea mines from SoH could take up to six months. That is a completely different timescale from what the financial market is pricing. Even a political deal tomorrow does not immediately reopen the strait.
#2: Trump has shifted his tone from urgency to ”strategic patience”. In yesterday’s press conference: ”Don’t rush me… I want a great deal.” The market is reading this as a president no longer feeling pressured by timelines, with the naval blockade running in the background.
#3: So far, the military activity is escalating, not de-escalating. Axios reports Iran is laying more mines in SoH. The US 3rd carrier strike group (USS George H.W. Bush) is arriving with two countermine vessels. Trump yesterday ordered the US Navy to destroy any Iranian boats caught laying mines. While CNN reports that the Pentagon is actively drawing up plans to strike Iranian SoH capabilities and individual Iranian military leaders if the ceasefire collapses. i.e., NOT a attitude consistent with an imminent deal!
Spot crude and product prices eased off the early-April highs on a combination of system rerouting and deal optimism. Both now weakening. Goldman estimates April Gulf output is reduced by 14.5 mbl/d, or 57% of pre-war supply, a number that keeps getting worse the longer this drags on.
Demand-side adaptation is ongoing: S. Korea has cut its Middle East crude dependence from 69% to 56% by pulling more from the Americas and Africa, and Japan is kicking off a second round of SPR releases from 1 May. But SPRs are finite.
Ref. to the negotiations, we should not bet on speed. The current Iranian leadership is dominated by genuine hardliners willing to absorb economic pain and run the clock to extract concessions. That is not a setup for a rapid resolution. US/Israeli media briefings keep framing the delay as ”internal Iranian divisions”, the reality is more complicated and points toward weeks and months, not days.
Our point is that the complexity is large, and higher prices have only just started (given a scenario where the negotiations drag out in time). The market spent April leaning on the USD 90/bl rest-of-year assumption; that case is diminishing by the hour. If ”early May reopening” is replaced by ”June, July or later” over the next week or two, both crude and products have meaningful room to reprice higher from here. There is a high risk being short energy and betting on any immediate political resolution(!).


Vattenfalls och Industrikrafts kärnkraftsbolag Videberg Kraft har valt Rolls-Royce SMR
Selling down on a ”deal”

Sommarväder skapar prisrally på elbörsen
Oil product price pain is set to rise as the Strait of Hormuz stays closed into summer

