

Analys
SHB Råvarubrevet 6 december 2013

 Råvaror allmänt
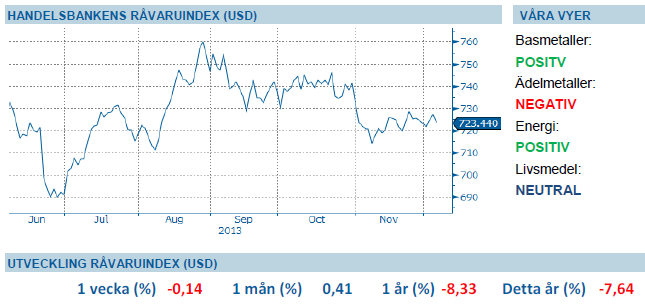
Råvaror gynnas av makroklimatet
För råvaror är det generella makroklimatet gott. Vi ser ett starkt momentum i Kina, centralbanker världen över fortsätter vara superrelaxade och den generella konjunkturåterhämtningen fortsätter varför 2014 kommer bli ett bättre år för världsekonomin än 2013. Trots detta ser vi ingen stark trend uppåt bland råvarorna. Investerare har blivit mer försiktiga när man diskonterar Kinas lägre tillväxt framgent. Den tillväxt som finns blir också allt mindre tiltad mot infrastrukturella investeringar. I det korta perspektivet ser vi att lagercykeln bottnar ur och ska efterföljas av en påfyllnad med ökad import av råvaror som konsekvens.
I närtid finns mer ljus. Oljemarknaden har ett säsongsmässigt starkt kvartal framför sig drivet av bland annat norra halvklotets vinter. Vi har listat utsikterna för guld och silver och det enda argumentet för uppgång i närtid är skuldtaksdiskussionen i USA i januari. Tyngst vägande på nedsidan ser vi den stundande nedskalningen av QE vara. Den amerikanska konjunkturen fortsätter att förbättras och med det tilltar Taper-oron. Framför allt starkare arbetsmarknadsdata ökar sannolikheten för att Fed rör sig i närtid.
Positiv data fortsätter under fredagseftermiddag. USA:s non-farm payrolls visade på fler sysselsatta än väntat. 203 000 fler i november mot förväntat 185 000.
Basmetaller
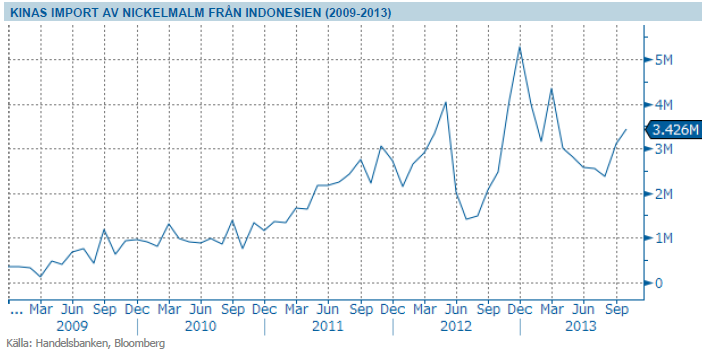
Indonesiens exportförbud åter i fokus
Priset på samtliga basmetaller har stigit under veckan, vårt basmetallindex är stiger med 1,1 %. Stark jobbdata från USA har stärkt metallerna men även Indonesiens exportförbud har stått i fokus och givit stöd. Potentialen för nickel under 2014 är till del beroende av Indonesiens planerade exportförbud. För den som inte är insatt i problematiken har Kina under senare år kraftigt ökat sin import av lågkvalitativ nickelmalm från främst Indonesien. Kina utvinner sedan själva nickeln ur malmen, med stora negativa miljöeffekter. Detta har gjort att priset på nickel fallit kraftigt på världsmarknaden. Indonesien vill nu få en större del av förädlingsvärdet själva och har därför beslutat om ett exportförbud på nickelmalm från och med årsskiftet 2013/14.
Detta har gjort att Kina importerat ännu mer nickelmalm i år för att lägga på lager, och importerat mindre nickel. Nickelpriset har även påverkats negativt av den svaga ekonomiska utvecklingen i Europa och av den pågående diskussionen om att Kina ställer om från investerings- till konsumtionsledd tillväxt. Om Indonesiens exportstopp träder i kraft som planerat, kommer Kinas lager av nickelmalm successivt att betas av och därefter bedömer vi att priserna på nickel kommer att börja stiga igen, eftersom Kina måste börja importera. Den exakta tidpunkten för detta är dock svår att fastslå. Dessutom finns en risk att Indonesien i sista stund ställer in exportförbudet, på grund av politiska påtryckningar. Sannolikheten för detta är ännu svårare att bestämma. Vår grundsyn är dock att nickelpriset bör återhämta sig under loppet av 2014, om världskonjunkturen fortsätter att förbättras och Indonesien inför exportförbud.
Exportförbudet ger även stöd till aluminium och kopparpriset då bauxit och kopparmalm även innefattas av förbudet.
Vi tror att Kinas tillväxt kommer överraska positivt under Q4 och Q1, vilket kommer stärka metallerna. Vi tror på: LONG BASMETALLER H
Ädelmetaller
Guldet fortsätter sin väg nedför
Guldet har visserligen haft en del rörelser under veckan men stänger veckan på minus återigen. Och utflödet ur guld ETF:er fortsätter. Vi hade under förra veckan hela nordens gruv- och metallindustrihöjdare i Stockholm, och har kunnat lyssna in på deras syn på marknaden för 2014. Det som stack ut när det gäller guld är att just denna metall toppat investerares intresse att placera gruvrelaterat riskkapital under 2012. Vår syn är att denna sorts investeringar görs både med eftersläpning och i flockbeteende. 2013 års prisfall på guld gör att vår gissning är att guldet inte kommer toppa tabellerna när årets investeringar summeras. Detta torde tala för ett minskat utbud av nyproducerat fysiskt guld framöver, vilket teoretiskt torde peka på att priset kan bottna ur.
Men som vi skrivit om tidigare, världen kommer inte att drabbas av plötslig guldbrist, allt guld som utvunnits i historien finns fortfarande kvar i lager. Lager för guld är ju bankvalv, bankfack eller smyckeskrin. Efter våra kontakter i veckan blev det också tydligt att branschen inte är inställd på att priset ska kunna komma ner till tresiffriga nivåer. Då hela vår erfarenhet från andra marknader lärt oss att just marknader tenderar att vara riktigt elaka tror vi att 1000 dollar per uns kommer att testas.
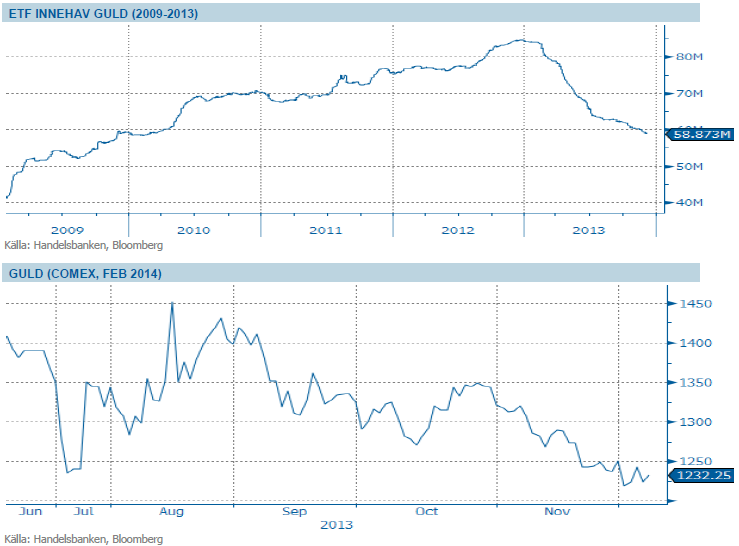
Efter en uppgång under sommaren tror vi åter att guldets väg lutar utför. Vi tror på: SHRT GULD H
Energi
OPEC möte i fokus
Brent noteras närmare 2 månaders högsta efter positiv statistik från de två ledande oljekonsumenterna USA och Kina. Intressant att även notera investerarstatistiken där nettolånga positioner på Brent ökat med 43 procent de senaste två veckorna. Fokus har under veckan annars varit på OPEC mötet i Wien där Saudi´s oljeminister signalerade att ”the oil market is in the best situation it can be and that the current price level is the right price”. Det går att tolka som att OPEC sannolikt inte kommer att göra så mycket mer just nu men men sannolikt kommer att agera i takt med att Libyen´s samt övriga löser sina utbudsstörningar. Brent och WTI spreaden krymper efter nyheten om att TransCanada´s pipeline (700,000bpd) ser ut att komma igång vilket kommer att minska lagren vid Cushing. Läs även veckans tradingcase på olja här.
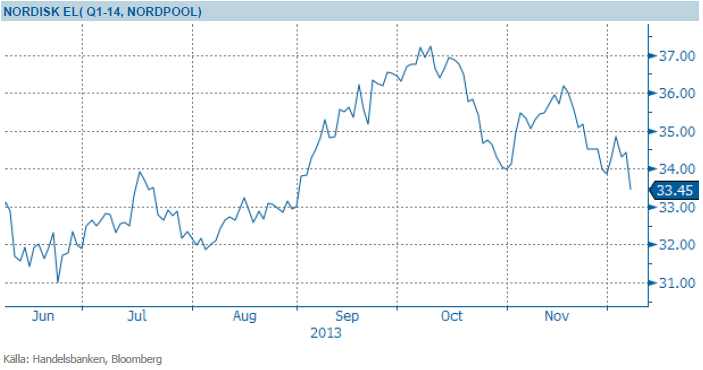
Elmarknaden som öppnade upp under inledningen av veckan försvagas mot slutet (Q1-14 når nytt all time low) och det är främst väderprognoserna som tynger sentimentet. Ett vått (ca 3TWh nederbörd över normalt) och milt (1-2 grader över normalt) scenario för hela den kommande 10-dagars perioden innebär att energiunderskottet fortsätter at minska i rask takt mot normalnivåer om det här håller i sig.
Inga större förändringar på vare sig kol som finner stöd strax över 80 USD/ton eller utsläppsrätter vilket med USD/EUR utvecklingen innebär att brytpriset ligger kvar oförändrat den senaste månaden. Med prognosen som ligger bör kvartalskontrakten kunna falla ytterligare någon EUR men vi bedömer att fallhöjden sedan är begränsad om vi går mot normalväder igen.
Konjunkturen för 2014 ser ut att bli starkare än 2013 för samtliga regioner i världen, och konsumtionen av olja minskar inte trots ett starkt driv mot förnyelsebara energikällor. Vi tror på: LONG OLJA H
Livsmedel
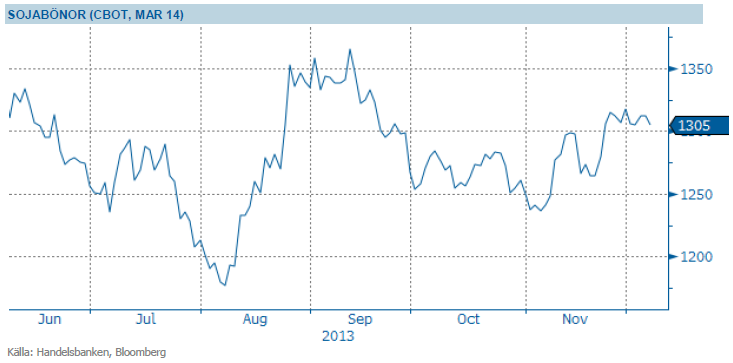
Höga sojaskördar väntas i Sydamerika
Priset på sojabönor faller med någon procent under veckan i linje med våra förväntningar. Mest i fokus nu är väderutvecklingen i Sydamerika, vilken än så länge varit gynnsam. Den brasilianska sådden går mot sitt slut och gynnsamt regn har fallit. I Argentina uppges 58 procent av sådden vara avklarad. Om inga väderproblem uppstår i Sydamerika tror vi på lägre priser framöver – just för tillfället får dock priserna stöd av en ganska god efterfrågan, som vanligt inte minst från Kina.
Majs har handlats upp nästan 2 % under veckan. Mer regn har fallit i de norra delarna av Argentina, vilket är klart gynnsamt för redan sådd gröda och gynnar även pågående sådd. I landets södra delar önskas fortfarande dock mer regn. 48 % av sådden uppges vara avklarad, att jämföra med 58% vid samma tid förra året. Sista delen av skörden i EU går så sakteliga framåt i stundtals regn stundtals snö, dock återstår nu endast en liten del. Liknande situation råder i Ukraina. Utan mer väderproblem i Sydamerika är det för tillfället svårt att se varför majspriserna skulle börja stiga då tillgången på majs globalt är väldigt god.
Efter flera år av rekordskördar handlas kaffe idag på femårslägsta. Vi finner kaffe köpvärd och ser risken på nedsidan begränsad. Vi tror på: LONG KAFFE H
Handelsbankens Råvaruindex
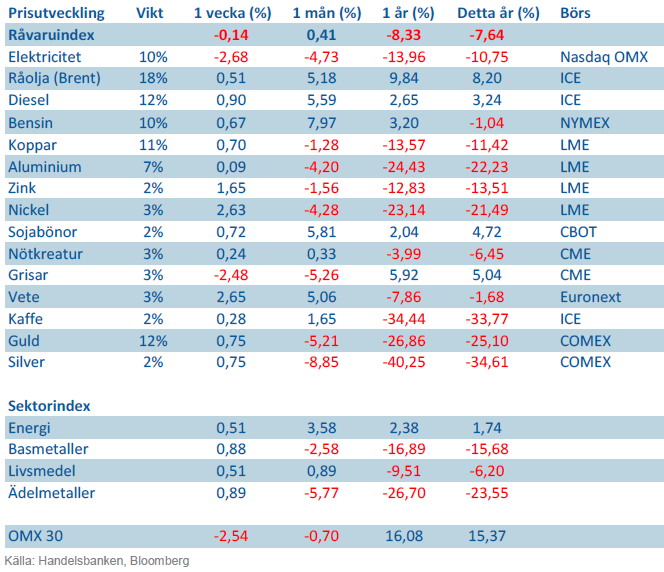
*Nya vikter från den 29 november 2013.
Handelsbankens råvaruindex består av de underliggande indexen för respektive råvara. Vikterna är bestämda till hälften från värdet av nordisk produktion (globala produktionen för sektorindex) och till hälften från likviditeten i terminskontrakten.
[box]SHB Råvarubrevet är producerat av Handelsbanken och publiceras i samarbete och med tillstånd på Råvarumarknaden.se[/box]
Ansvarsbegränsning
Detta material är producerat av Svenska Handelsbanken AB (publ) i fortsättningen kallad Handelsbanken. De som arbetar med innehållet är inte analytiker och materialet är inte oberoende investeringsanalys. Innehållet är uteslutande avsett för kunder i Sverige. Syftet är att ge en allmän information till Handelsbankens kunder och utgör inte ett personligt investeringsråd eller en personlig rekommendation. Informationen ska inte ensamt utgöra underlag för investeringsbeslut. Kunder bör inhämta råd från sina rådgivare och basera sina investeringsbeslut utifrån egen erfarenhet.
Informationen i materialet kan ändras och också avvika från de åsikter som uttrycks i oberoende investeringsanalyser från Handelsbanken. Informationen grundar sig på allmänt tillgänglig information och är hämtad från källor som bedöms som tillförlitliga, men riktigheten kan inte garanteras och informationen kan vara ofullständig eller nedkortad. Ingen del av förslaget får reproduceras eller distribueras till någon annan person utan att Handelsbanken dessförinnan lämnat sitt skriftliga medgivande. Handelsbanken ansvarar inte för att materialet används på ett sätt som strider mot förbudet mot vidarebefordran eller offentliggörs i strid med bankens regler.


Rebounding along with most markets. But concerns over solidity of Gaza peace may also contribute. Brent crude fell 0.8% yesterday to $61.91/b and its lowest close since May this year. This morning it is bouncing up 0.9% to $62.5/b along with a softer USD amid positive sentiment with both equities and industrial metals moving higher. Concerns that the peace in Gaza may be less solid than what one might hope for also yields some support to Brent. Bets on tech stocks are rebounding, defying fears of trade war. Money moving back into markets. Gold continues upwards its strong trend and a softer dollar helps it higher today as well.

US crude & products probably rose 5.6 mb last week (API) versus a normal seasonal decline of 2.4 mb. The US API last night partial and thus indicative data for US oil inventories. Their data indicates that US crude stocks rose 7.4 mb last week, gasoline stocks rose 3.0 mb while Distillate stocks fell 4.8 mb. Altogether an increase in commercial crude and product stocks of 5.6 mb. Commercial US crude and product stocks normally decline by 2.4 mb this time of year. So seasonally adjusted the US inventories rose 8 mb last week according to the indicative numbers by the API. That is a lot. Also, the counter seasonal trend of rising stocks versus normally declining stocks this time of year looks on a solid pace of continuation. If the API is correct then total US crude and product stocks would stand 41 mb higher than one year ago and 6 mb higher than the 2015-19 average. And if we combine this with our knowledge of a sharp increase in production and exports by OPEC(+) and a large increase in oil at sea, then the current trend in US oil inventories looks set to continue. So higher stocks and lower crude oil prices until OPEC(+) switch to cuts. Actual US oil inventory data today at 18:00 CET.
US commercial crude and product stocks rising to 1293 mb in week 41 if last nights indicative numbers from API are correct.

Crude oil soon coming to a port near you. OPEC has lifted production sharply higher this autumn. At the same time demand for oil in the Middle-East has fallen as we have moved out of summer heat and crude oil burn for power for air-conditioning. The Middle-East oil producers have thus been able to lift exports higher on both accounts. Crude oil and condensates on water has shot up by 177 mb since mid-August. This oil is now on its way to ports around the world. And when they arrive, it will likely help to lift stocks onshore higher. That is probably when we will lose the last bit of front-end backwardation the the crude oil curves. That will help to drive the front-month Brent crude oil price down to the $60/b line and revisit the high $50ies/b. Then the eyes will be all back on OPEC+ when they meet in early November and then again in early December.
Crude oil and condensates at sea have moved straight up by 177 mb since mid-August as OPEC(+) has produced more, consumed less and exported more.

When it starts to move lower it moves rather quickly. Gaza, China, IEA. Brent crude is down 2.1% today to $62/b after having traded as high as $66.58/b last Thursday and above $70/b in late September. The sell-off follows the truce/peace in Gaze, a flareup in US-China trade and yet another bearish oil outlook from the IEA.
A lasting peace in Gaze could drive crude oil at sea to onshore stocks. A lasting peace in Gaza would probably calm down the Houthis and thus allow more normal shipments of crude oil to sail through the Suez Canal, the Red Sea and out through the Bab-el-Mandeb Strait. Crude oil at sea has risen from 48 mb in April to now 91 mb versus a pre-Covid normal of about 50-60 mb. The rise to 91 mb is probably the result of crude sailing around Africa to be shot to pieces by the Houthis. If sailings were to normalize through the Suez Canal, then it could free up some 40 mb in transit at sea moving onshore into stocks.
The US-China trade conflict is of course bearish for demand if it continues.
Bearish IEA yet again. Getting closer to 2026. Credibility rises. We expect OPEC to cut end of 2025. The bearish monthly report from the IEA is what it is, but the closer we get to 2026, the more likely the IEA is of being ball-park right in its outlook. In its monthly report today the IEA estimates that the need for crude oil from OPEC in 2026 will be 25.4 mb/d versus production by the group in September of 29.1 mb/d. The group thus needs to do some serious cutting at the end of 2025 if it wants to keep the market balanced and avoid inventories from skyrocketing. Given that IEA is correct that is. We do however expect OPEC to implement cuts to avoid a large increase in inventories in Q1-26. The group will probably revert to cuts either at its early December meeting when they discuss production for January or in early January when they discuss production for February. The oil price will likely head yet lower until the group reverts to cuts.
Dubai: The Mid-East anchor dragging crude oil lower. Surplus emerging in Mid-East pricing. Crude oil prices held surprisingly strong all through the summer. A sign and a key source of that strength came from the strength in the front-end backwardation of the Dubai crude oil curve. It held out strong from mid-June and all until late September with an average 1-3mth time-spread premium of $1.8/b from mid-June to end of September. The 1-3mth time-spreads for Brent and WTI however were in steady deterioration from late June while their flat prices probably were held up by the strength coming from the Persian Gulf. Then in late September the strength in the Dubai curve suddenly collapsed. Since the start of October it has been weaker than both the Brent and the WTI curves. The Dubai 1-3mth time-spread now only stands at $0.25/b. The Middle East is now exporting more as it is producing more and also consuming less following elevated summer crude burn for power (Aircon) etc.
The only bear-element missing is a sudden and solid rise in OECD stocks. The only thing that is missing for the bear-case everyone have been waiting for is a solid, visible rise in OECD stocks in general and US oil stocks specifically. So watch out for US API indications tomorrow and official US oil inventories on Thursday.
No sign of any kind of fire-sale of oil from Saudi Arabia yet. To what we can see, Saudi Arabia is not at all struggling to sell its oil. It only lowered its Official Selling Prices (OSPs) to Asia marginally for November. A surplus market + Saudi determination to sell its oil to the market would normally lead to a sharp lowering of Saudi OSPs to Asia. Not yet at least and not for November.
The 5yr contract close to fixed at $68/b. Of importance with respect to how far down oil can/will go. When the oil market moves into a surplus then the spot price starts to trade in a large discount to the 5yr contract. Typically $10-15/b below the 5yr contract on average in bear-years (2009, 2015, 2016, 2020). But the 5yr contract is usually pulled lower as well thus making this approach a moving target. But the 5yr contract price has now been rock solidly been pegged to $68/b since 2022. And in the 2022 bull-year (Brent spot average $99/b), the 5yr contract only went to $72/b on average. If we assume that the same goes for the downside and that 2026 is a bear-year then the 5yr goes to $64/b while the spot is trading at a $10-15/b discount to that. That would imply an average spot price next year of $49-54/b. But that is if OPEC doesn’t revert to cuts and instead keeps production flowing. We think OPEC(+) will trim/cut production as needed into 2026 to prevent a huge build-up in global oil stocks and a crash in prices. But for now we are still heading lower. Into the $50ies/b.
Some rebound but not much. Brent crude rebounded 1.5% yesterday to $65.47/b. This morning it is inching 0.2% up to $65.6/b. The lowest close last week was on Thursday at $64.11/b.
The curve structure is almost as week as it was before the weekend. The rebound we now have gotten post the message from OPEC+ over the weekend is to a large degree a rebound along the curve rather than much strengthening at the front-end of the curve. That part of the curve structure is almost as weak as it was last Thursday.
We are still on a weakening path. The message from OPEC+ over the weekend was we are still on a weakening path with rising supply from the group. It is just not as rapidly weakening as was feared ahead of the weekend when a quota hike of 500 kb/d/mth for November was discussed.
The Brent curve is on its way to full contango with Brent dipping into the $50ies/b. Thus the ongoing weakening we have had in the crude curve since the start of the year, and especially since early June, will continue until the Brent crude oil forward curve is in full contango along with visibly rising US and OECD oil inventories. The front-month Brent contract will then flip down towards the $60/b-line and below into the $50ies/b.
At what point will OPEC+ turn to cuts? The big question then becomes: When will OPEC+ turn around to make some cuts? At what (price) point will they choose to stabilize the market? Because for sure they will. Higher oil inventories, some more shedding of drilling rigs in US shale and Brent into the 50ies somewhere is probably where the group will step in.
There is nothing we have seen from the group so far which indicates that they will close their eyes, let the world drown in oil and the oil price crash to $40/b or below.
The message from OPEC+ is also about balance and stability. The world won’t drown in oil in 2026. The message from the group as far as we manage to interpret it is twofold: 1) Taking back market share which requires a lower price for non-OPEC+ to back off a bit, and 2) Oil market stability and balance. It is not just about 1. Thus fretting about how we are all going to drown in oil in 2026 is totally off the mark by just focusing on point 1.
When to buy cal 2026? Before Christmas when Brent hits $55/b and before OPEC+ holds its last meeting of the year which is likely to be in early December.
Brent crude oil prices have rebounded a bit along the forward curve. Not much strengthening in the structure of the curve. The front-end backwardation is not much stronger today than on its weakest level so far this year which was on Thursday last week.

The front-end backwardation fell to its weakest level so far this year on Thursday last week. A slight pickup yesterday and today, but still very close to the weakest year to date. More oil from OPEC+ in the coming months and softer demand and rising inventories. We are heading for yet softer levels.


Crude oil soon coming to a port near you

Guld och silver stiger hela tiden mot nya höjder
The Mid-East anchor dragging crude oil lower

Samtal om sällsynta jordartsmetaller, guld och silver

Brookfield köper bränsleceller för 5 miljarder USD av Bloom Energy för att driva AI-datacenter

OPEC+ missar produktionsmål, stöder oljepriserna

Ett samtal om guld, olja, fjärrvärme och förnybar energi

Guld nära 4000 USD och silver 50 USD, därför kan de fortsätta stiga
Are Ukraine’s attacks on Russian energy infrastructure working?

Goldman Sachs höjer prognosen för guld, tror priset når 4900 USD
-
 Nyheter3 veckor sedan
OPEC+ missar produktionsmål, stöder oljepriserna
-
 Nyheter3 veckor sedan
Ett samtal om guld, olja, fjärrvärme och förnybar energi
-
 Nyheter2 veckor sedan
Guld nära 4000 USD och silver 50 USD, därför kan de fortsätta stiga
-
Analys3 veckor sedan
Are Ukraine’s attacks on Russian energy infrastructure working?
-
 Nyheter1 vecka sedan
Goldman Sachs höjer prognosen för guld, tror priset når 4900 USD
-

 Nyheter2 veckor sedan
Blykalla och amerikanska Oklo inleder ett samarbete
-

 Nyheter3 veckor sedan
Guldpriset uppe på nya höjder, nu 3750 USD
-
Nyheter2 veckor sedan
Ett samtal om guld, olja, koppar och stål