

Analys
SHB Råvarubrevet 5 juni 2014

Råvaror allmänt: Har Kina bottnat för detta året?
 Veckans snackis på marknaden har varit förväntansbilden på ECB. Den Europeiska centralbanken levererade en sänkning enligt förväntansbilden och är inte en stor sak för råvarumarknaden.
Kinas fallande tillväxt har varit huvudrubriken för råvarumarknaden de senaste två åren. Efter första kvartalets dramatiska nedgång i barometerdata ser nu åtminstone inköpschefsindex ut att ha planat ut. Vi tror att stimulanserna av efterfrågan har stoppat nedgången för den här gången. Det är dock enbart en tillfällig lösning och den långa trenden är fortfarande nedåt för kinesisk tillväxt. Främst drabbar detta koppar vars efterfrågan är beroende av kinesisk byggsektor samtidigt som produktionen ökar efter år av investeringar i världens gruvor. Övriga basmetaller ser vi ganska ljust på just nu, begränsad nedsida från låga nivåer och inte alls samma strukturella press från ökad produktion som för koppar gör att vår bild på basmetallkomplexet blir negativ på koppar men positiv på övriga.
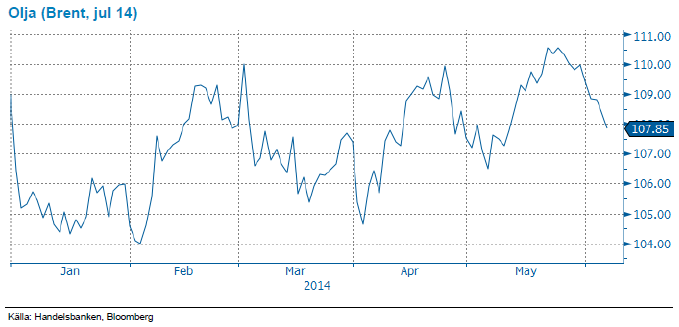
Vår tro på klart lägre oljepriser den här våren har grusats. Riskpremien från Ryssland-Ukraina och det faktum att Libyen inte kommit tillbaka till export i den utsträckning som vi tänkt har hindrat det säsongsmässiga prisfall vi brukar se under andra kvartalet. Nu tror vi istället att oljan får stöd av stundande ”driving season” och byter delvis fot även om vi på ett eller två års sikt tror att oljan kommer pressas av ökad produktion i USA.
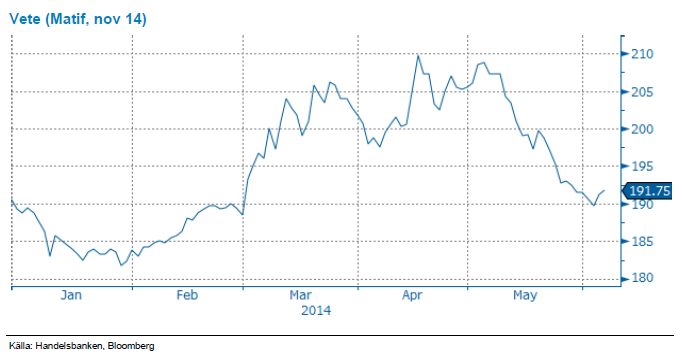
För vetet anses putinpremien nu var utvädrad men vi fortsätter tro på lägre pris då stora skördar väntas vid skörd. Från att varit positiva till guldet skiftar vi till en mer neutral vy, läs mer nedan.
Basmetaller: Små rörelser under veckan
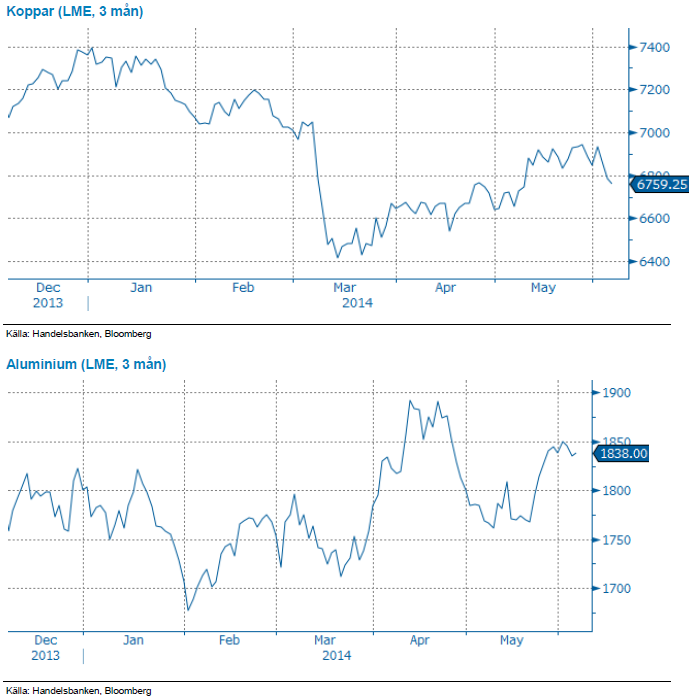
Vi har inga stora rörelser att rapportera om för basmetallerna senaste veckan, störst rörelser ser vi på koppar som tappat 1,8 %. Kinas PMI (HSBC) för tillverkningsindustrin reviderades ned till 49,4 från det preliminära på 49,7 vilket har hållit ned priset på metallerna under veckan.
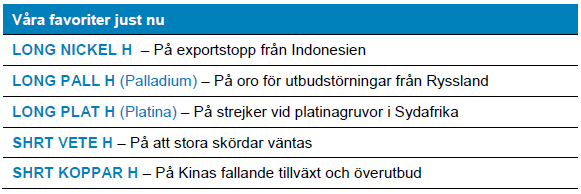
Vi ser positivt på basmetaller med undantaget för koppar som pressas av Kina och överutbud. Aluminium har vi tidigare satt ett intervall på 1800-2000 USD/ton de kommande åren och med dagens pris på 1850 finns det utrymme kvar på uppsidan. Det stora nickelrallyt ser ut vara över men vi behåller vår positiva vy och tror att priset ska fortsätta upp under året. Vi tror att zink kommer bli nästa metall som kan bjuda på ett prisrally då det låga priset kan tvinga många gruvor ur produktion, men det dröjer ytterligare innan detta sker.
Ädelmetaller: Vi blir neutrala till guldet
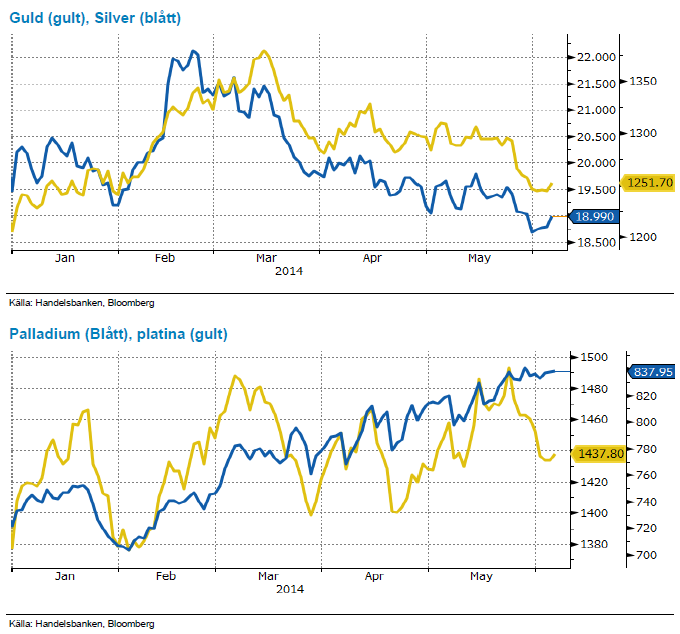
Efter drygt två månader av konsolidering i intervalet 1280-1320 dollar per uns föll guldpriset ned under 1250 dollar, och har inte visat på några nämnvärda rekyltendenser sedan dess. Nu står marknaden dock och väger mellan rädsla över räntehöjningar i USA och förhoppningar om stimulans i Euroland, och vi väljer att nu tona ner den positiva syn vi haft på guldet till en mer neutral vy.
Dock fortsätter gruvstrejkerna i Sydafrika, och beräkningar nu pekar på att så mycket som 25 % av årsproduktionen av platina kommer att falla bort under 2014. 87 % av världens platinareserver finns i Sydafrika, och tre stora producenter (Anglo Platinum, Lonmin och Impala) dominerar marknaden totalt. Strejken har nu pågått i över fyra månader och marknaden kommer att hamna i större underskott ju längre den fortsätter. Samtidigt växer bilindustrin globalt och 2014 års bilförsäljning beräknas bli 5 procent högre än 2013, något som driver efterfrågan på platina och palladium. Striktare utsläppskrav på bilar i Kina kommer framöver att göra att förbrukningen av platina och palladium kommer att öka snabbare än bilproduktionen.
Vi behåller därför platina och palladium bland våra favoriter, av samma skäl som tidigare. Vi noterar också att dessa hanterat guldprisfallet bättre, platina har fallit något sedan senaste brevet, medan palladium stigit något.
Energi: Fallande pris på både olja och el
Riskpremien på oljemarknaden minskar efter att den geopolitiska spänningen i Ukraina och risken för vidare sanktioner mot Ryssland avtar något efter G7:s uttalande även om USA hotar med riktade sanktioner om Ryssland drar tillbaka sina trupper. Amerikansk lagerdata bidrar också till nedgången mot slutet av veckan.
Vi förväntar oss dock att oljan handlas kvar i denna range med stöd från osäkerheten kring framför allt Iran och Libyen i synnerhet, där situationen kring utbud och terminaler ser allt mörkare ut. I övrigt har det varit en hel del fokus på Obama-administrationens utsläppsplan, EPA (Environmental Protection Agency Plan) som presenterades tidigare i veckan. EPA skulle innebära att man reducerar koldioxidutsläppen med 30 procent fram till 2030 (från 2005 års nivåer) vilket i stort handlar om att man accelererar nedstängning av kolgenererad kraft till fördel för gasgenererad kraft. Planen, som inte lär träda i kraft förrän om två år, skiljer sig klart från tidigare och är ett stort slag mot den inhemska gruvindustrin (kol) vilken sysselsätter ca 800,000 personer. Kolgenererad kraft står idag för ca 37 % av generarad kraft i USA (ned från 52% år 2000) och beräknas fortsatt stå för ca 30% år 2030, men det lär till en början resultera i en ökad volym kol på exportmarknaden och indirekt pressa priset för kolgenererad kraft tills dess att ytterligare gruvor stängs ned.
Elen faller tillbaka och på bränslekomplexet har det varit enkelriktat, i synnerhet på gas och kolmarknaden som inte tycks vilja bottna ur. Gazprom fortsätter att skjuta på betalningstiden för Ukraina vilket minskat oron på gasmarknaden om än tillfälligt samtidigt som kolen är tillbaka på de tidigare låga nivåer som noterades i februari/mars som ett resultat av ett stort överskott och god tillgänglighet på exportmarknaden. Den negativa energibalansen stabiliserar marknaden något vilket även CO2 gjorde fram till det negativa beskedet om stabiliseringsmekanismen (i ett försök att minska överskottet på rätter) vilken nu ej planeras starta tidigare än väntat. Vi räknar därför inte med att kvartalet Q314 stiger mer utan att vi snarare tappar någon euro eller två ned mot 24-25 euro.
Livsmedel: Vetets putinpremie utvädrad
Vetepriset har fortsatt falla och handlas nu på samma nivå som när krisen i Ukraina intensifierades i början på mars. Vi fortsätter att tro på lägre priser då kommande skörd ser ut få alla förutsättningar för att bli stor.
Situationen har blivit något bättre för det amerikanska höstvetet som i dagarna fått ganska mycket välbehövligt regn. Vårvetet har haft lite torrare väder i dagarna men regn väntas till helgen – vilket ses som gynnsamt. I Kanada regnar det en del, vilket fördröjer en redan ganska sen sådd ytterligare något. Det australiensiska vetet har den senaste tiden upplevt ett varierande väder med tillfredställande mängd nederbörd. I Europa faller också en del regn, främst i regionens västra delar. Överlag ser grödorna i Europa väldigt fina ut – vilket vi ser även hemma i Sverige. Ukraina har också fått tillräckligt med regn men har nu blivit lite torrare, vilket gynnar den mognande grödan. Ryssland uppges ha lite blött i söder men de centrala delarna av landet är lite väl torrt och varmt – än så länge uppges dock oron vara begränsad. Med något förbättrad situation för det amerikanska vetet och fortsatt generellt sett väldigt gott skick på norra halvklotets grödor i övrigt är det svårt att se varför inte ytterligare prisfall är att vänta – givet att inga mer omfattande störningar inträffar, för vilket tiden rinner ut då skörd närmar sig.
Efter en längre period av torka under årets första månader ser nu nederbörden i april-maj komma som en sista minuten räddning för kaffeodlingarna i sydöstra Brasilien. Återhämtningen kan komma att dämpa produktionsbortfallet och skörden ser nu ut att vara i bättre skick än tidigare befarat. Den kommande veckan fortsätter att bli en behaglig mognadsperiod för kaffebönor som ännu inte skördats med relativt torrt väder och regn under normalen. Om ett par veckor släpper amerikanska jordbruksdepartementet, USDA, årets första prognos på den kommande skörden. Vi ser viss risk på nedsidan men håller en neutral vy i väntan på rapporten.
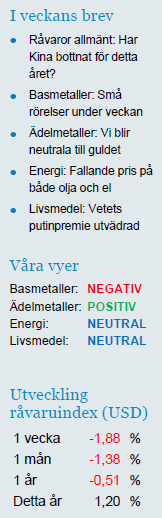
Handelsbankens råvaruindex (USD)
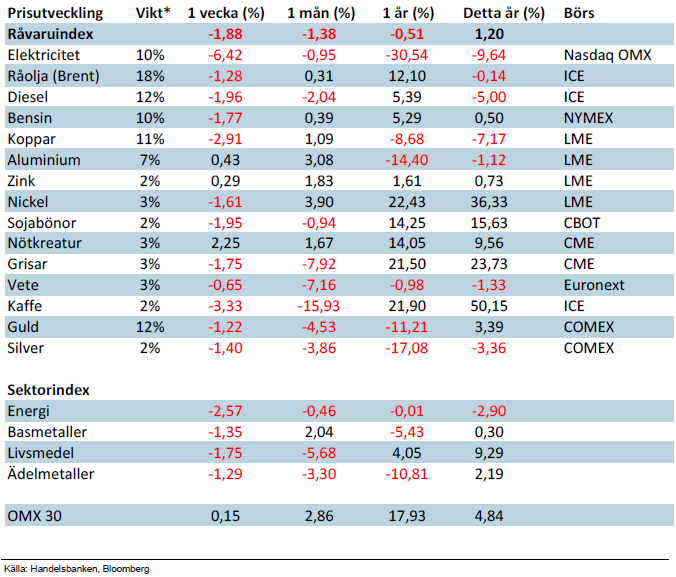
*Uppdaterade vikter från 29 november 2013
Handelsbankens råvaruindex består av de underliggande indexen för respektive råvara. Vikterna är bestämda till hälften från värdet av nordisk produktion (globala produktionen för sektorindex) och till hälften från likviditeten i terminskontrakten.
[box]SHB Råvarubrevet är producerat av Handelsbanken och publiceras i samarbete och med tillstånd på Råvarumarknaden.se[/box]
Ansvarsbegränsning
Detta material är producerat av Svenska Handelsbanken AB (publ) i fortsättningen kallad Handelsbanken. De som arbetar med innehållet är inte analytiker och materialet är inte oberoende investeringsanalys. Innehållet är uteslutande avsett för kunder i Sverige. Syftet är att ge en allmän information till Handelsbankens kunder och utgör inte ett personligt investeringsråd eller en personlig rekommendation. Informationen ska inte ensamt utgöra underlag för investeringsbeslut. Kunder bör inhämta råd från sina rådgivare och basera sina investeringsbeslut utifrån egen erfarenhet.
Informationen i materialet kan ändras och också avvika från de åsikter som uttrycks i oberoende investeringsanalyser från Handelsbanken. Informationen grundar sig på allmänt tillgänglig information och är hämtad från källor som bedöms som tillförlitliga, men riktigheten kan inte garanteras och informationen kan vara ofullständig eller nedkortad. Ingen del av förslaget får reproduceras eller distribueras till någon annan person utan att Handelsbanken dessförinnan lämnat sitt skriftliga medgivande. Handelsbanken ansvarar inte för att materialet används på ett sätt som strider mot förbudet mot vidarebefordran eller offentliggörs i strid med bankens regler.


Selling down on a ”deal”. Brent crude fell 6.2% last week with accelerated weakness towards the end of the week. Close of the week at $87.33/b and low of the week (and on Friday) of $85.8/b. Brent is falling another 4% this morning to $83.7/b on confirmation by Iran that a MoU text has been reached and that it will be signed on Friday this week.

So what is this ”deal” worth? Talk on the desk here this morning is that it is much like ”putting lipstick on a pig” where Trump has to sell this at home as a victory where ”the SoH has reopened”, the nuclear issue will be ironed out over the coming 60 days (or maybe 600 days?) and US consumers are getting a lower gasoline price and maybe US republicans survives the midterm elections.
The importance for Iran is that it emerges as the defacto winner of this war in the eyes of the non-US public world. That Iran now onwards is the ”ruler of the SoH” (combo of geography and new weapons systems like drones) or more softer: ”the guarantor of safe passage through the SoH”.
Iran doesn’t need nuclear weapons any more. Nuclear deterrence doesn’t work any more. Ukraine has made many attacks deep into Russia without being nuked in return. Plenty of Iranian ballistic rockets blasts over Israel but Iran wasn’t nuked in return.
There is no trust between the US and Iran. We don’t know all the details yet of the MoU. But what we do know is that there is no trust between the US and Iran what so ever. This is probably more like a descriptive text on how they can cooperate in a way where both sides keeps tactical leverage. Neither side makes irreversible concessions. Violations can be punished quickly. Cooperation produces immediate benefits.
This is a fragile structure. It can easily break down. There may be details which cannot be overcome. To be seen on Friday. The US has to show that it is willing put enough force behind managing and restraining Israel versus Hezbollah in Lebanon. We have seen that Netanyahu hasn’t listened all that much to Trump’s directives and wishes. This could be a major obstacle.
A gradual reopening is tactically preferable for Iran. A tactical leverage for Iran right now is that global oil stocks have been drawn down towards painful and increasingly dangerous levels with increasing risks for oil price spikes in mid-July to August. This together with US midterm elections on 3 November gives tactical leverage to Iran. Iran probably doesn’t want to fully give up on that leverage. A rapid, full reopening where global stocks are able to refill over the coming 60 days will significantly erode that leverage. If Iran reinstates a closure of the SoH after 60 days (if talks break down again), then the effect won’t be that impactful in terms of prices and the US midterm elections.
So a gradual and partial reopening where global markets gets the oil they need while they are unable to rebuild stocks could be a practical middle way for both parties. Trump can sell it as ”the SoH has reopened” and get affordable gasoline for US consumers. Iran can sell it as ”the SoH has fully reopened, but there is some friction” so flow is only 60-80% of normal.
Not much real demand destruction below $100/b. What we do know is that there is not much real price pain demand destruction for oil globally at an oil price below $100/b. A lot of demand-shock destruction. Fear. But demand should now come roaring back towards normal with fear for exceptionally high prices now is rapidly receding.
Sudden China demand destruction due to EVs? Bullocks. EV share of total Chinese carpool now around 13%. Share of new sales of EVs has reached 50%. This is a very gradual process. It doesn’t make oil demand fall like a rock over night. When EV new sales share reaches 100%, then the gasoline car pool will contract by some 5-10% per year. But that is only gasoline. Sudden reduction in Chinese oil demand is more about shock and risk.
Chinese crude oil imports will come roaring back. At what price? Today’s ”neutral” oil price is $70/b. That is the five year price which has steadily traded around the $70/b mark over the past 3-4 years. With still a risky picture one would think that China and the rest of the world will be big buyers of oil in the range of $70-85/b.
Global demand will likely snap back towards normal, forecasted demand and growth at such prices.
Physical reopening is a gradual process. The physical and practical reopening of the SoH will likely be gradual rather than sudden. And that probably suites Iran tactically as well.
Brent M1 price versus the Brent 5-yr (today’s ”normal” price)

Market is starting to take US/Iran headlines with a pinch of salt. Brent crude rose $2.8/b yesterday to an official close of $112.1/b. But after that it traded as low as $108.05/b before ending late night at around $109.7/b. Through the day it traded in a range of $106.87 – 112.72/b amid a flurry of news or rumors from Iran and the US. ”US temporary sanctions during negotiations” (falls alarm). ”We will bomb Iran” (not anyhow),… etc. While the market is still fluctuating to this kind of news flow, it is starting to take such headlines with a pinch of salt.
We’ll see. Maybe, maybe not. The Brent M1 contract is trading at $110.2/b this morning which very close to the average ticks through yesterday of $110.4/b.
Trump with bearish, verbal intervention whenever Brent trades above $110/b it seems. What seems to be a pattern is that Trump states something like ”very good negotiations going on with Iran”, ”New leaders in Iran are great,..”, ”Great progress in negotiations,…”, ”Deal in sight,..” etc whenever the Brent M1 contract trades above $110/b. An effort to cool the market. These hot air verbal interventions from Trump used to have a heavy bearish impact on prices, but they now seems to have less and less effect unless they are backed by reality.
As far as we can see there has been no real progress in the negotiations between the US and Iran with both sides still standing by their previous demands.
Iran is getting stronger while the cease fire lasts making a return to war for Trump yet harder. Iran is naturally in constant preparation for a return to war given Trump’s steady threats of bombing Iran again. Iran is naturally doing what ever is possible to prepare for a return to war. And every day the cease fire lasts it is better prepared. This naturally makes it more and more difficult and dangerous for the US to return to warring activity versus Iran as the consequences for energy infrastructure in the Persian Gulf will be more and more severe the longer the cease fire lasts. Israel seems to see it this way as well. That the war is not won and that current frozen state of a cease fire gives Iran opportunity to rebuild military and politically.
Global inventories are drawing down day by day. How much? In the meantime the Strait of Hormuz stays closed. There is varying measures and estimates of how much global inventories are drawing down. Our rough estimate, back of the envelope, is that global inventories are drawing down by at least some 10 mb/d or about 300 mb/d in a balance between loss of supply versus demand destruction. Other estimates we see are a monthly draw of 250-270 mb/d. The IEA only ’measured’ a draw in global observable stocks of 117 mb in April with oil on water rising 53 mb while on shore stocks fell 170 mb. But global stocks are hard to measure with large invisible, unmeasured stocks. As such a back of the envelope approach may be better.
Oil products is what the world is consuming. Oil product prices likely to rise while product stocks fall. Strategic Petroleum Reserves (SPR) are predominantly crude oil. Discharging oil from OECD SPR stocks, a sharp reduction in Chinese crude imports and a reduction in global refinery throughput of 6-7 mb/d has helped to keep crude oil markets satisfactorily supplied. But global inventories are drawing down none the less. And oil products is really what the world is consuming. So if global refinery throughput stays subdued, then demand will eventually have to match the supply of oil products. The likely path forward this summer is a steady draw down in jet fuel, diesel and gasoline. Higher prices for these. Then, if possible, higher refinery throughput and higher usage of crude in response to very profitable refinery margins. And lastly sharper draw in crude stocks and higher prices for these. But some 6 mb/d of oil products used to be exported through the Strait of Hormuz. And it may not be so easy to ramp up refinery activity across the world to compensate. Especially as Ukraine continues to damage Russian refineries as well as Russian crude production and export facilities.
Watch oil product stocks and prices as well as Brent calendar 2027. What to watch for this summer is thus oil product inventories falling and oil product premiums to crude rising. Another measure to watch is the Brent crude 2027 contract as it rises steadily day by day as the Strait of Hormuz stays closed and global oil inventories decline. The latter is close to the highest level since the start of the war and keeps rising.
The Brent M1 contract and the Brent 2027 prices and current price of jet fuel in Europe (ARA). All in USD/b

Our back of the envelope calculation of the global shortage created by the closure of the Strait of Hormuz. Note that 3.5 mb/d of discharge from SPR is also a draw. Note also that ’Forced demand loss’ of 2.5 mb/d is probably temporary and will fall back towards zero as logistics are sorted out leaving ’Price demand loss’ to do the job of balancing the market. Thus a shortfall of at least 9 mb/d created by the closure. More if SPR discharge is included and more if Forced demand loss recedes.

Brent is climbing higher. Front-month is at USD 106.3/bl this morning, close to a weekly high and a USD 9/bl jump from Mondays open. This is the move we flagged as a risk earlier in the week: the market shifting from ”a deal is around the corner” to ”this is going to take longer than we thought”.

Analyst Commodities, SEB
During April, rest-of-year Brent remained remarkably stable around USD 90/bl. A stability which rested on one single assumption: the SoH reopens around 1 May. That assumption is now slowly falling apart.
As we highlighted yesterday: every week of delay beyond 1 May adds (theoretically) ish USD 5/bl to the rest-of-year average, as global inventories draw 100 million barrels per week. i.e., a mid-May reopening implies rest-of-year Brent closer to USD 100/bl, and anything pushing into June or July takes us meaningfully higher.
What’s changed in the last 48 hours:
#1: The US military has formally warned that clearing suspected sea mines from SoH could take up to six months. That is a completely different timescale from what the financial market is pricing. Even a political deal tomorrow does not immediately reopen the strait.
#2: Trump has shifted his tone from urgency to ”strategic patience”. In yesterday’s press conference: ”Don’t rush me… I want a great deal.” The market is reading this as a president no longer feeling pressured by timelines, with the naval blockade running in the background.
#3: So far, the military activity is escalating, not de-escalating. Axios reports Iran is laying more mines in SoH. The US 3rd carrier strike group (USS George H.W. Bush) is arriving with two countermine vessels. Trump yesterday ordered the US Navy to destroy any Iranian boats caught laying mines. While CNN reports that the Pentagon is actively drawing up plans to strike Iranian SoH capabilities and individual Iranian military leaders if the ceasefire collapses. i.e., NOT a attitude consistent with an imminent deal!
Spot crude and product prices eased off the early-April highs on a combination of system rerouting and deal optimism. Both now weakening. Goldman estimates April Gulf output is reduced by 14.5 mbl/d, or 57% of pre-war supply, a number that keeps getting worse the longer this drags on.
Demand-side adaptation is ongoing: S. Korea has cut its Middle East crude dependence from 69% to 56% by pulling more from the Americas and Africa, and Japan is kicking off a second round of SPR releases from 1 May. But SPRs are finite.
Ref. to the negotiations, we should not bet on speed. The current Iranian leadership is dominated by genuine hardliners willing to absorb economic pain and run the clock to extract concessions. That is not a setup for a rapid resolution. US/Israeli media briefings keep framing the delay as ”internal Iranian divisions”, the reality is more complicated and points toward weeks and months, not days.
Our point is that the complexity is large, and higher prices have only just started (given a scenario where the negotiations drag out in time). The market spent April leaning on the USD 90/bl rest-of-year assumption; that case is diminishing by the hour. If ”early May reopening” is replaced by ”June, July or later” over the next week or two, both crude and products have meaningful room to reprice higher from here. There is a high risk being short energy and betting on any immediate political resolution(!).


Vattenfalls och Industrikrafts kärnkraftsbolag Videberg Kraft har valt Rolls-Royce SMR
Selling down on a ”deal”

Sommarväder skapar prisrally på elbörsen
Oil product price pain is set to rise as the Strait of Hormuz stays closed into summer

