

Analys
SHB Råvarubrevet 22 februari 2013

 Råvaror allmänt
Som en blixt från klar himmel
Under veckan kom protokollet från amerikanska centralbankens senaste möte. Det väckte stort rabalder på marknaden när det tydde på oväntat högljudd opposition mot Fedchefen Ben Bernanke. Med räntan nära noll är Bens strategi att köpa obligationer av marknaden (kvantitativa lättnader) i hopp om att detta ska lyfta tillgångspriser, vilket i sin tur bör ge positiva effekter på realekonomin. De senaste årens utveckling har visat att börsen har svårt att klara sig utan centralbanksåtgärder. Därför är veckans kursrörelser på börsen och råvarumarknaden en naturlig ryggmärgsreflex när det mullras bland Fedkollegorna.
Ben ser dock som sin huvuduppgift att inte upprepa Feds misstag från 30-talet då penningpolitiken stramades åt alltför snabbt med utdragen lågkonjunktur som följd. Kursfallen under veckan i basmetaller och energi, drivet av oro för snar avslutning av Feds kvantitativa lättnader bör därför betraktas som köpläge. Att fånga den fallande kniven är alltid svårt men att köpa när det gör ont brukar vara de bästa affärerna.
Annars har veckan präglats av att kinas ledning vill begränsa prisuppgångar i fastigheter och preliminära PMI siffror för Europa (sämre än väntat) och USA (i linje med förväntningar) för februari.
Basmetallerna
Försvunnen riskaptit
I veckan försvann riskaptiten på marknaden efter negativa signaler i protokollet från senaste mötet hos USA:s centralbank, Fed. I protokollet kan man tyda att Fed:s medlemmar tvivlar på hur länge man ska stimulera marknaden med QE3 programmet. Ytterligare negativa signaler kom från Kina där regeringen kommer att vidta åtgärder för att dämpa prisuppgången på fastigheter. Det tolkas som negativt för byggsektorn.
Shanghaibörsen handlades kraftigt ner och värst drabbade var byggbolagen. En våg av negativ spekulation i att detta kommer att minska efterfrågan på de råvaror som används i byggmaterial startade. Basmetaller, järnmalm och stål föll kraftigt under veckan på dessa nyheter och nickel rörde sig som vanligt mest utav basmetallerna. Enbart under torsdagen föll den volatila metallen över 3 % och veckans fall har raderat årets uppgång för basmetallerna. Vi håller kvar vår tro på högre priser på basmetaller och tycker att veckan givit ett bra ”buy on dip” läge.
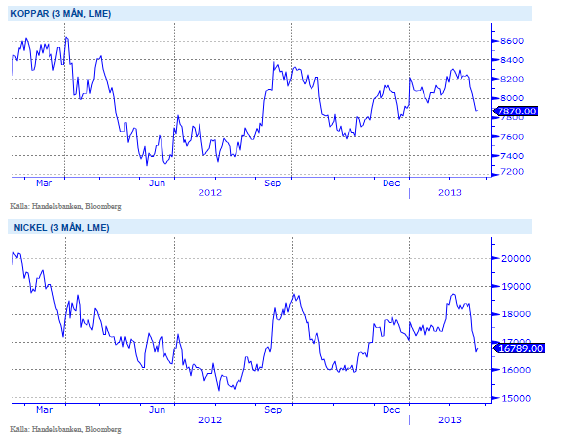
Trots nedgången under veckan tror vi på högre priser på basmetaller och ser istället möjlighet till ”buy on dip”. Vi tror på: BASMET H
Ädelmetaller
Guldet faller – precis som vi tänkt!
Vår handelsrekommendation att sälja guld från förra fredagen har slagit väl ut. Guld kom snabbt på fall och bröt ner genom de tekniska motstånden på 1650 och 1600. Ytterligare fall blev det efter Feds protokoll då marknaden började prisa ur QE3. Från utskicket i fredags till lägsta nivån under torsdagen hade guldet tappat 4,9 %. Vi fortsätter tro på lägre guldpris men understryker att det är ett attraktivt läge att ta hem en bra vinst på kort tid.
Förutom guldet, som under veckan tappat 2,59 %, har palladium, platinum och silver tappat mellan 4-5 %. Senaste 5 dagarna har vårt index för ädelmetaller fallit med 4,35 %. I Indien, världens största köpare av guld, diskuteras ytterligare en höjning av importskatten från nuvarande 6 % till 8 %. Skatten skulle användas för att minska budgetunderskottet.
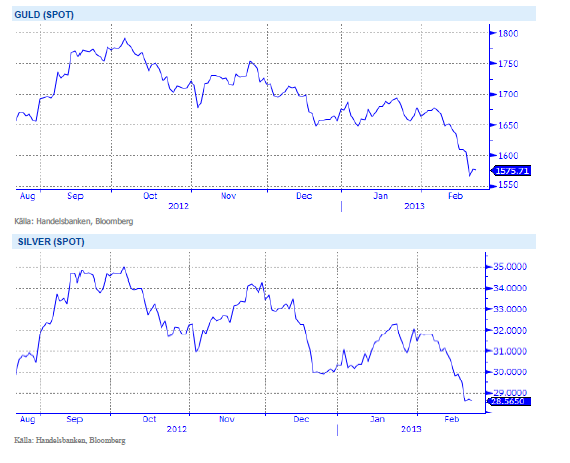
Med ljusare konjunktur och potentiellt stigande räntenivåer ser vi ytterligare press på guldet som troligt. Vi tror på: GULD S H
Energi
Läge för ”buy on dip”
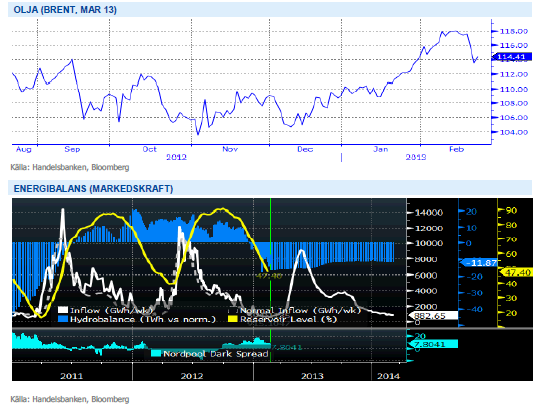
Olja har fallit i det negativa sentimentet och ytterligare påspätt av riktigt stora säljordrar i amerikanska WTI oljan som fick Brentoljan med sig nedåt. Produktionen i USA är uppe på högsta nivån sedan 1992 och producerar dryga 7,1 miljoner fat per dag. Vi håller fast vid vår positiva syn trots nedgången och förlitar oss på att den ljusnande konjunkturen kommer ge stöd till oljan framöver. Fallet under veckan är ungefär 3 % och även här ser vi det som ett ”buy on dip” läge för den riskvillige. Försök att fånga kniven!
Elmarknaden handlas oförändrat över veckan med visst stöd från en försvagad energibalans (-11.87 TWh mot normalt se nedan i blått). Väderprognoserna visar normala temperaturer och nederbörd för de kommande 10-dagarna så vi behåller vår neutrala vy. Utsläppsrätterna föll 15 procent efter miljöutskottets röstning kring backloadingförslaget som inte visade på den majoritet man kanske hoppats på. Köpintresset visade sig dock vara ganska stort efter fallet och marknaden handlas åter kring de ca 5 euro vi räknat med. Frågan tas sannolikt vidare till ministerrådet och först efter kvalificerad majoritet där och ett ja i parlamentet kan vi få se ytterligare köpintresse.
Den råvarugrupp som är mest beroende av den globala konjunkturen är Energi och med en starkare konjunktur ser vi positivt på utvecklingen för denna sektor. Vi tror på: ENERGI H
Livsmedel
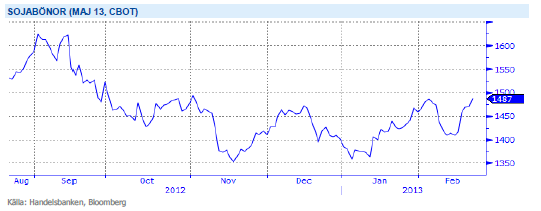
Kina fortsätter köpa sojabönor
Sojabönor har stigit kraftigt under veckan med fortsatt stark amerikansk export (som vanligt med Kina som största köpare). I Brasilien fortsätter skörden utan större problem, drygt 20 procent av skörden bedöms vara avklarad. USDA beräknar årets kommande amerikanska sojaskörd till rekordhöga 93 miljoner ton, upp 12,9 procent jämfört med förra året. Stark efterfrågan och låga lagernivåer driver upp priserna och på kort sikt är det svårt att se en nedsida för sojan. Faller USDA:s prognos väl in för årets skörd lär vi dock få se klart lägre priser längre fram på året, grödan ska dock först sås och mycket kan hända innan skörd. Priset på majs har fallit under veckan efter nederbörd fallit över de amerikanska majsregionerna – mer önskas men oron har lindrats. Längst ned i de södra delarna av USA har sådden redan startat, i de mer viktiga majsregionerna längre norrut är det dock ännu för kallt och torrt. I Argentina har det fallit lite mer regn, vilket helt klart gynnar den relativt nysådda majsen, nästa vecka ser dock ut att bli lite torrare. Med förbättrad väderlek i både USA och Sydamerika finns all möjlighet för priserna att falla ytterligare. USDA uppskattar nu kommande amerikanska majsskörd till 35 procent över förra året med rekordhöga 369 miljoner ton.
Prisfallet på kaffe sedan mitten av januari har till stor del berott på fortsatt höga lager av både Arabica – och Robustakaffe, dock har lagren av Robusta halverats från rekordåret i juli 2011. Centralamerikas export kan komma att minska 30 procent då svampsjukdomen spridit sig i stora delar av regionen efter kraftiga skyfall och längre perioder av torka. Det återstår att se om välfyllda lager och goda skördar från övriga länder kan komma att täcka bortfallet i Centralamerika. För apelsinjuice har en bakteriesjukdom skadat delar av den amerikanska apelsinodlingen. Man befarar att 10-15 procent av skörden i Florida, världens näst största exportör, kan skadas. Dessutom har temperaturer under normalen orsakat frost i samma område, vilket har fått priset på apelsinjuiceterminen att stiga 10 procent sen årsskiftet.
Även om vår syn på soja, majs och vete fortfarande är att normalt väder ska få priserna att falla så håller vi neutral vy för denna sektor på grund av riskerna för fortsatt torrt väder i USA.
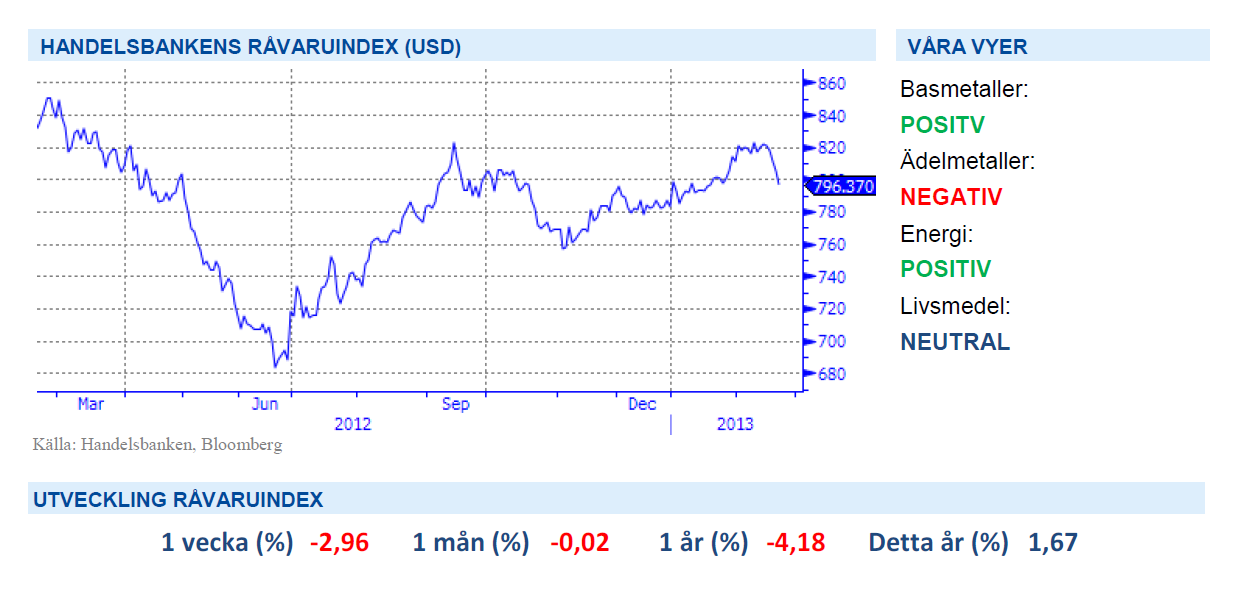
Handelsbankens Råvaruindex
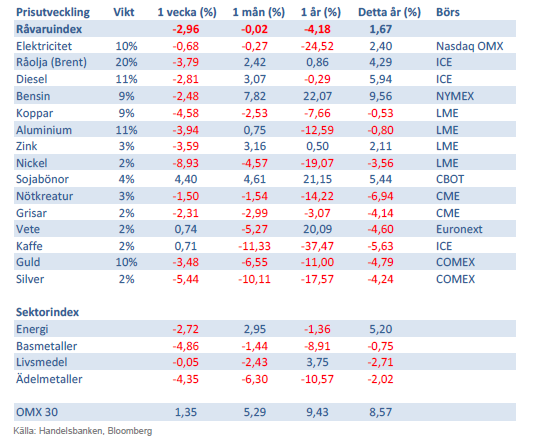
Handelsbankens råvaruindex består av de underliggande indexen för respektive råvara. Vikterna är bestämda till hälften från värdet av global produktion och till hälften från likviditeten i terminskontrakten.
[box]SHB Råvarubrevet är producerat av Handelsbanken och publiceras i samarbete och med tillstånd på Råvarumarknaden.se[/box]
Ansvarsbegränsning
Detta material är producerat av Svenska Handelsbanken AB (publ) i fortsättningen kallad Handelsbanken. De som arbetar med innehållet är inte analytiker och materialet är inte oberoende investeringsanalys. Innehållet är uteslutande avsett för kunder i Sverige. Syftet är att ge en allmän information till Handelsbankens kunder och utgör inte ett personligt investeringsråd eller en personlig rekommendation. Informationen ska inte ensamt utgöra underlag för investeringsbeslut. Kunder bör inhämta råd från sina rådgivare och basera sina investeringsbeslut utifrån egen erfarenhet.
Informationen i materialet kan ändras och också avvika från de åsikter som uttrycks i oberoende investeringsanalyser från Handelsbanken. Informationen grundar sig på allmänt tillgänglig information och är hämtad från källor som bedöms som tillförlitliga, men riktigheten kan inte garanteras och informationen kan vara ofullständig eller nedkortad. Ingen del av förslaget får reproduceras eller distribueras till någon annan person utan att Handelsbanken dessförinnan lämnat sitt skriftliga medgivande. Handelsbanken ansvarar inte för att materialet används på ett sätt som strider mot förbudet mot vidarebefordran eller offentliggörs i strid med bankens regler.


Hesitant today. Brent jumped to an intraday high of $66.36/b yesterday after having touched an intraday low of $60.07/b on Monday as Indian and Chinese buyers cancelled some Russian oil purchases and instead redirected their purchases towards the Middle East due to the news US sanctions. Brent is falling back 0.4% this morning to $65.8/b.

It’s our strong view that the only sensible thing is to sell this rally. In all Trump’s unpredictability he has become increasingly predictable. Again and again he has rumbled about how he is going to be tough on Putin. Punish Putin if he won’t agree to peace in Ukraine. Recent rumbling was about the Tomahawk rockets which Trump threatened on 10 October and 12 October to sell/send to Ukraine. Then on 17 October he said that ”the U.S. didn’t want to give away weapons (Tomahawks) it needs”.
All of Trump’s threats towards Putin have been hot air. So far Trump’s threats have been all hot air and threats which later have evaporated after ”great talks with Putin”. After all these repetitions it is very hard to believe that this time will be any different. The new sanctions won’t take effect before 21. November. Trump has already said that: ”he was hoping that these new sanctions would be very short-lived in any case”. Come 21. November these new sanctions will either evaporate like all the other threats Trump has thrown at Putin before fading them. Or the sanctions will be postponed by another 4 weeks or 8 weeks with the appearance that Trump is even more angry with Putin. But so far Trump has done nothing that hurt Putin/Russia. We can’t imagine that this will be different. The only way forward in our view for a propre lasting peace in Ukraine is to turn Ukraine into defensive porcupine equipped with a stinging tail if need be.
China will likely stand up to Trump if new sanctions really materialize on 21 Nov. Just one country has really stood up to Trump in his tariff trade war this year: China. China has come of age and strength. I will no longer be bullied. Trump upped tariffs. China responded in kind. Trump cut China off from high-end computer chips. China put on the breaks on rare earth metals. China won’t be bullied any more and it has the power to stand up. Some Chinese state-owned companies like Sinopec have cancelled some of their Russian purchases. But China’s Foreign Ministry spokesperson Guo Jiakun has stated that China “oppose unilateral sanctions which lack a basis in international law and authorization of the UN Security Council”. Thus no one, not even the US shall unilaterally dictate China from whom they can buy oil or not. This is yet another opportunity for China to show its new strength and stand up to Trump in a show of force. Exactly how China choses to play this remains to be seen. But China won’t be bullied by over something as important as its oil purchases. So best guess here is that China will defy Trump on this. But probably China won’t need to make a bid deal over this. Firstly because these new sanctions will either evaporate as all the other threats or be postponed once we get to 21 November. Secondly because the sanctions are explicit towards US persons and companies but only ”may” be enforced versus non-US entities.
Sanctions is not a reduction in global supply of oil. Just some added layer of friction. Anyhow, the new sanctions won’t reduce the supply of Russian crude oil to the market. It will only increase the friction in the market with yet more need for the shadow fleet and ship to ship transfer of Russian oil to dodge the sanctions. If they materialize at all.
The jump in crude oil prices is probably due to redirections of crude purchases to the Mid-East and not because all speculators are now turned bullish. Has oil rallied because all speculators now suddenly have turned bullish? We don’t think so. Brent crude has probably jumped because some Indian and Chinese oil purchasers of have redirected their purchases from Russia towards the Mid-East just in case the sanctions really materializes on 21 November.
Parts of the Brent crude curve dipping into the high $50ies/b. Brent crude fell 2.3% over the week to Friday. It closed the week at $61.29/b, a slight gain on the day, but also traded to a low of $60.14/b that same day and just barely avoided trading into the $50ies/b. This morning it is risk-on in equities which seems to help industrial metals a little higher. But no such luck for oil. It is down 0.8% at $60.8/b. This week looks set for Brent crude to dip its feet in the $50ies/b. The Brent 3mth contract actually traded into the high $50ies/b on Friday.
The front-end backwardation has been on a weakening foot and is now about to fully disappear. The lowest point of the crude oil curve has also moved steadily lower and lower and its discount to the 5yr contract is now $6.8/b. A solid contango. The Brent 3mth contract did actually dip into the $50ies/b intraday on Friday when it traded to a low point of $59.93/b.
More weakness to come as lots of oil at sea comes to ports. Mid-East OPEC countries have boosted exports along with lower post summer consumption and higher production. The result is highly visibly in oil at sea which increased by 17 mb to 1,311 mb over the week to Sunday. Up 185 mb since mid-August. On its way to discharge at a port somewhere over the coming month or two.
Don’t forget that the oil market path ahead is all down to OPEC+. Remember that what is playing out in the oil market now is all by design by OPEC+. The group has decided that the unwind of the voluntary cuts is what it wants to do. In a combination of meeting demand from consumers as well as taking back market share. But we need to remember that how this plays out going forward is all at the mercy of what OPEC+ decides to do. It will halt the unwinding at some point. It will revert to cuts instead of unwind at some point.
A few months with Brent at $55/b and 40-50 US shale oil rigs kicked out may be what is needed. We think OPEC+ needs to see the exit of another 40-50 drilling rigs in the US shale oil patches to set US shale oil production on a path to of a 1 mb/d year on year decline Dec-25 to Dec-26. We are not there yet. But a 2-3 months period with Brent crude averaging $55/b would probably do it.
Oil on water increased 17 mb over the week to Sunday while oil in transit increased by 23 mb. So less oil was standing still. More was moving.

Crude oil floating storage (stationary more than 7 days). Down 11 mb over week to Sunday

The lowest point of the Brent crude oil curve versus the 5yr contract. Weakest so far this year.

Crude oil 1mth to 3mth time-spreads. Dubai held out strongly through summer, but then that center of strength fell apart in late September and has been leading weakness in crude curves lower since then.

Rebounding along with most markets. But concerns over solidity of Gaza peace may also contribute. Brent crude fell 0.8% yesterday to $61.91/b and its lowest close since May this year. This morning it is bouncing up 0.9% to $62.5/b along with a softer USD amid positive sentiment with both equities and industrial metals moving higher. Concerns that the peace in Gaza may be less solid than what one might hope for also yields some support to Brent. Bets on tech stocks are rebounding, defying fears of trade war. Money moving back into markets. Gold continues upwards its strong trend and a softer dollar helps it higher today as well.
US crude & products probably rose 5.6 mb last week (API) versus a normal seasonal decline of 2.4 mb. The US API last night partial and thus indicative data for US oil inventories. Their data indicates that US crude stocks rose 7.4 mb last week, gasoline stocks rose 3.0 mb while Distillate stocks fell 4.8 mb. Altogether an increase in commercial crude and product stocks of 5.6 mb. Commercial US crude and product stocks normally decline by 2.4 mb this time of year. So seasonally adjusted the US inventories rose 8 mb last week according to the indicative numbers by the API. That is a lot. Also, the counter seasonal trend of rising stocks versus normally declining stocks this time of year looks on a solid pace of continuation. If the API is correct then total US crude and product stocks would stand 41 mb higher than one year ago and 6 mb higher than the 2015-19 average. And if we combine this with our knowledge of a sharp increase in production and exports by OPEC(+) and a large increase in oil at sea, then the current trend in US oil inventories looks set to continue. So higher stocks and lower crude oil prices until OPEC(+) switch to cuts. Actual US oil inventory data today at 18:00 CET.
US commercial crude and product stocks rising to 1293 mb in week 41 if last nights indicative numbers from API are correct.

Crude oil soon coming to a port near you. OPEC has lifted production sharply higher this autumn. At the same time demand for oil in the Middle-East has fallen as we have moved out of summer heat and crude oil burn for power for air-conditioning. The Middle-East oil producers have thus been able to lift exports higher on both accounts. Crude oil and condensates on water has shot up by 177 mb since mid-August. This oil is now on its way to ports around the world. And when they arrive, it will likely help to lift stocks onshore higher. That is probably when we will lose the last bit of front-end backwardation the the crude oil curves. That will help to drive the front-month Brent crude oil price down to the $60/b line and revisit the high $50ies/b. Then the eyes will be all back on OPEC+ when they meet in early November and then again in early December.
Crude oil and condensates at sea have moved straight up by 177 mb since mid-August as OPEC(+) has produced more, consumed less and exported more.


Sell the rally. Trump has become predictable in his unpredictability

Gruvbolaget Boliden överträffade analytikernas förväntningar

Australien och USA investerar 8,5 miljarder USD för försörjningskedja av kritiska mineraler
Brent crude set to dip its feet into the high $50ies/b this week

Vad guldets uppgång egentligen betyder för världen

OPEC+ missar produktionsmål, stöder oljepriserna

Goldman Sachs höjer prognosen för guld, tror priset når 4900 USD

Blykalla och amerikanska Oklo inleder ett samarbete

Guld nära 4000 USD och silver 50 USD, därför kan de fortsätta stiga

Leading Edge Materials är på rätt plats i rätt tid
-
 Nyheter4 veckor sedan
OPEC+ missar produktionsmål, stöder oljepriserna
-
 Nyheter3 veckor sedan
Goldman Sachs höjer prognosen för guld, tror priset når 4900 USD
-
 Nyheter3 veckor sedan
Blykalla och amerikanska Oklo inleder ett samarbete
-
 Nyheter3 veckor sedan
Guld nära 4000 USD och silver 50 USD, därför kan de fortsätta stiga
-
 Nyheter2 veckor sedan
Leading Edge Materials är på rätt plats i rätt tid
-

 Nyheter3 veckor sedan
Nytt prisrekord, guld stiger över 4000 USD
-

 Nyheter3 veckor sedan
Ett samtal om guld, olja, koppar och stål
-
Analys3 veckor sedan
OPEC+ will likely unwind 500 kb/d of voluntary quotas in October. But a full unwind of 1.5 mb/d in one go could be in the cards