

Analys
SHB Råvarubrevet 15 mars 2013

 Råvaror allmänt
Makro ställs mot politik, ännu en gång
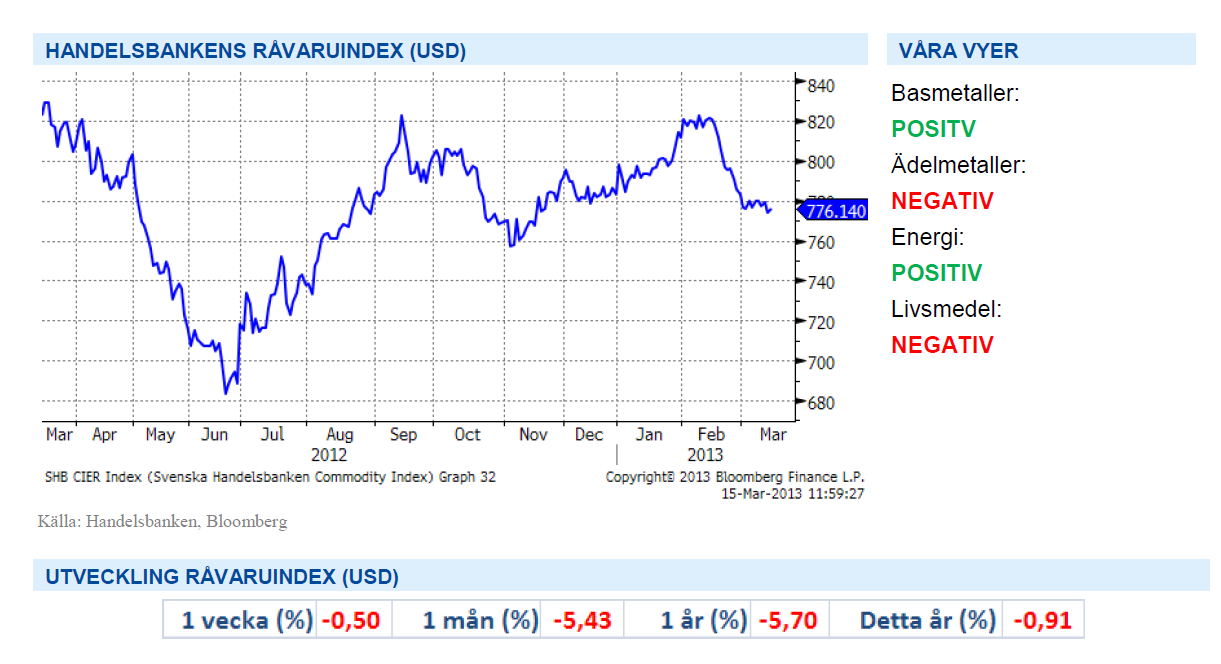
Drivkraften i närtid är främst det osäkra valutfallet i Italien. Även om vissa datautfall som inköpschefsindex för EMU-området och Kina varit något sämre än väntat har dataskörden överlag varit fortsatt god. Börsrallyt har fortsatt att sätta avtryck i företagens och hushållens stämningsläge, skattehöjningar och nedskärningar till trots. Råvaror har planat ut efter februari månads branta fall.
Den bild vi har av makroutvecklingen ger stöd för bred uppgång för råvaror. För den amerikanska ekonomin handlar det mycket om att hushållen svarar mot den förbättring som äger rum på bostadsmarknaden. Trots att bostadsmarknaden överraskade positivt under hela 2012 har marknaden inte dragit några större växlar för vad det innebär för konsumenternas välbefinnande. Ingen räknar idag med att ”den amerikanska konsumenten” kommer tillbaka på allvar. Men tänk om!
Skattehöjningar, nedskärningar och kanske även en minskning av federala utgifter i slutet av april utgör motvindar i USA. Detta har dock hittills motverkats av positiva förmögenhets- och sentimentseffekter. Som vanligt är läget i EMU-området värre. Det italienska valet resulterade i ett oklart parlamentariskt läge utan någon tydlig vinnare. Rapporter gör gällande att Bersani kommer att försöka sy ihop en bred regering tillsammans med Berlusconis allians eller delar därav. Ett sådant utfall vore marknadspositivt pga. minskad osäkerhet.
Bernanke har lugnat marknaderna, som sondmatats med lätt hökiga signaler från de senaste protokollen. Bernanke sade att ”en signifikant majoritet” bland röstande ledamöterna är för nuvarande penningpolitik. Han tonade även ned riskerna med den lätta penningpolitiken, vidhöll att Fed kan hålla köpta obligationer till förfall och att det inte är aktuellt att sänka köptakten ännu.
Basmetallerna
Kina ökar produktionstakten
Kineserna har dragit upp produktionstakten på såväl basmetaller som stål visar färsk statistik. 2.21 miljoner ton stål per dag produceras och All-time-high vilket vittnar om god efterfrågan från både transport- och fastighetssektorn. Kina har ytterligare 35 procent i installerad kapacitet, ca 970 miljoner ton, som man inte kör utan målet är att hålla produktionstakten i nivå med efterfrågan kring ca 700 miljoner ton.
På Aluminium har produktionstakten ökat med 15 procent YoY till och betydande smältkapacitet installeras nu i de Nordvästra provinserna. Oroande kan tyckas om man ser till överskottet på Aluminium men intressant när även på Kopparproduktionen ökar kraftigt (+11.9% YoY) så trenden tycks bekräfta en stor förändring i mönstret på Kinas import av råvaror. Från import av färdiga varor (raffinerad koppar exempelvis) till att i större utsträckning kontrollera förädlingen (import av koncentrat). Landet är fortfarande långt ifrån självförsörjande när det gäller raffinerad metall och den kinesiska importen kommer att förbli en stor del av den globala handeln, men inte nödvändigtvis i samma utsträckning som historiskt varit fallet. Detta kommer naturligtvis också pressa marginalerna för smält- och raffinaderier ytterligare. Vårt Basmetallindex stiger 1 procent under veckan efter att ha fallit med 6 procent under februari och vi bedömer att detta ger möjlighet att kliva in i metaller på bra nivåer.
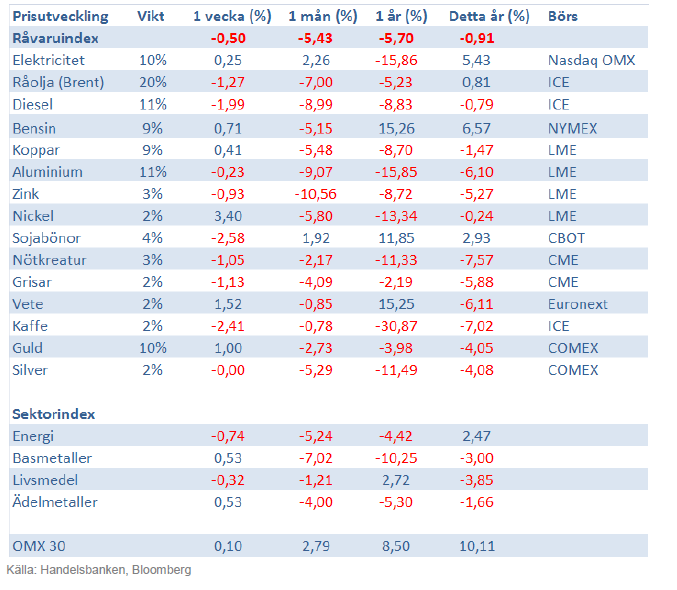
Nedan finner du en graf ser du hur Handelsbankens Basmetallindex (rött) rört sig i förhållande till Råvaruindex (blått) och OMX 30 (grönt).
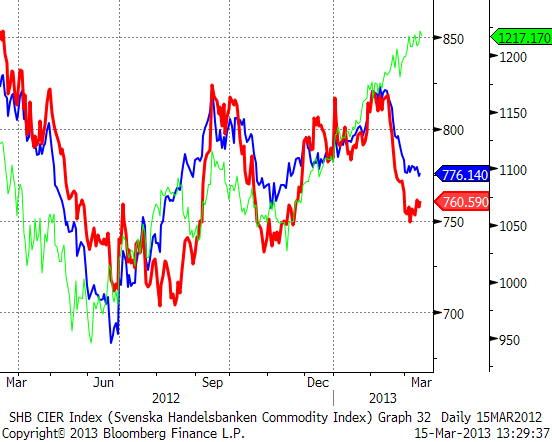
Trots nedgången under veckan tror vi på högre priser på basmetaller och ser istället möjlighet till ”buy on dip”. Vi tror på: BASMET H
Ädelmetaller
Vi behåller vår negativa syn på guldet
Sedan förra veckan har guldet knappt rört sig, varken upp eller ner. Vi behåller dock vår negativa – väldigt negativa – syn på guldet, och ägnar veckans spalt åt att fördjupa resonemanget bakom vår vy. Under nästa vecka hoppas vi kunna titta närmare på guldprisets utveckling under 70-talet, vilken åtföljdes av en halvering av priset, och se om det finns likheter med det läge vi befinner oss i nu.
Det absolut viktigaste skälet till vår negativa syn är att guld inte behövs. Alla överlever vi utan guld – till skillnad från spannmål – och vi behöver inte guld vare sig när vi bygger hus, broar, bilar eller mobiltelefoner. Många av oss vill ha guld, men ingen behöver guld. Detta faktum gör att guldets dynamik är väsensskild från övriga råvaror. Vi köper guld som en värdebevarare, som inflationsskydd, eller som en ren spekulation. Och naturligtvis för att det är en vacker utsmyckare och statussymbol att bära synligt.
Problemet med allt detta är att det krävs fantastiskt mycket nya köpare bara för att hindra guldet från att falla i pris. Det produceras guld för runt 170 miljarder dollar varje år, guld som måste köpas av de som hoppas kunna sälja det till ett ännu högre pris till någon annan. Eller sätta det på fingret eller runt halsen. För allt guld som någonsin producerats finns fortfarande, så man kan säga att lagernivån är god.
Så, glöm resonemang om att det är tilltagande riskaptit som kommer att sänka värdet på guld, det är bara triggern till att priset nu börjat falla. Det är guldets totala brist på nytta som kommer att sätta rätt värde i slutändan.
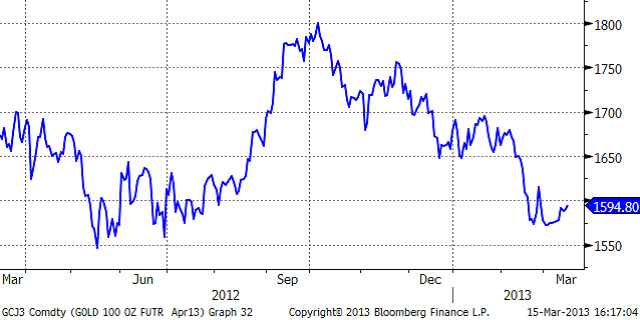
Starkare dollar och högre räntor blir utmanande för guldet samtidigt som inflationen väntas vara låg under året. Vi tror på: GULD S H
Energi
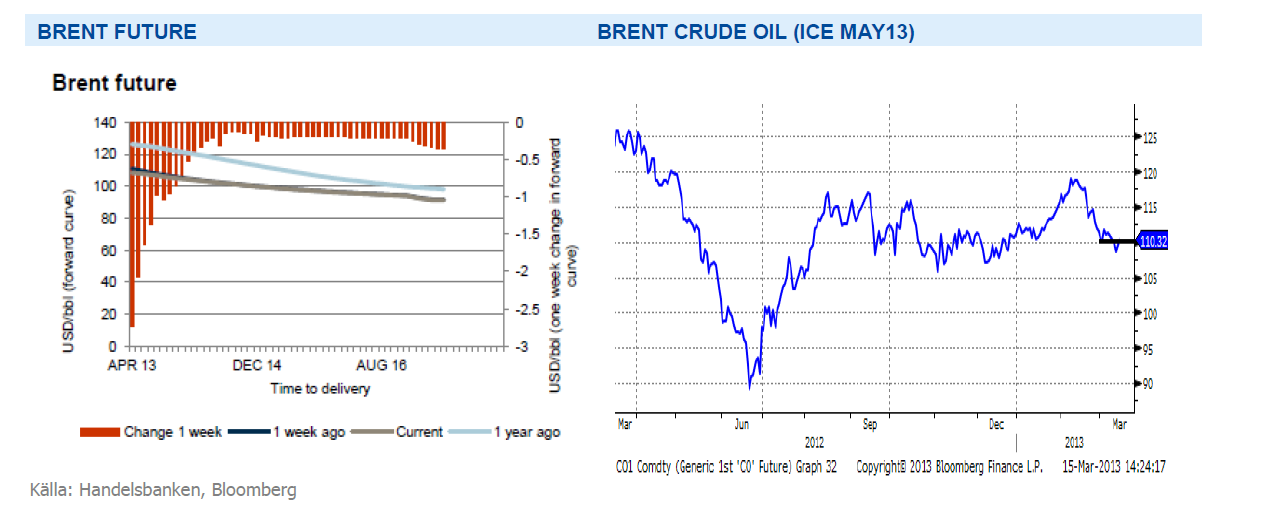
Oljan finner stöd
Oljan återhämtar sig mot slutet av veckan efter positiva amerikanska arbetslöshetssiffror och en svagare dollarutveckling. Samtidigt som Sudan meddelat att man beordrat alla utländska oljebolag och operatörer att återuppta oljeproduktionen (350kbpd) efter avmilitarisering i området kring gränsen mot södra Sudan, finner oljan fortsatt stöd från risk för produktionsbortfall. President Obama besöker Israel nästa vecka och diskussioner kring Iran´s kärnvapen och en förlängning av sanktionerna är självklart en intressant punkt på agendan. OPEC har dock signalerat att man är beredd att skruva upp produktionen med ytterligare 300kb (+1.2%) under de kommande veckorna för att täcka upp efterfrågan så fundamentalt är det svårt att motivera köp på dessa nivåer. Däremot verkar oljan finna stöd på strax under 110 så vi bedömer att potential just nu finns på uppsidan. Lägg därtill en fortsatt backwardation (avdrag) på Brentterminerna om ca 6 procent 1 år ut vilket gynnar ett innehav.
Elen oförändrad över veckan, samtidigt som kalla och torra prognoser verkar för uppsidan backar energikol (-2%) och utsläppsrätterna tillbaka vilket resulterar i en stillastående marknad. Så länge vi inte får en kraftigt förändrad energibalans (förväntas vara -11.5 TWh mot slutet av nästa vecka) eller brytpris på kol är det svårt att vara annat än neutral.
Vad gäller utsläppsrätterna anordnade man i veckan en icke bindande testomröstning inom EU Parlamentet (vilken för övrigt gick igenom) och det är i dagsläget väldigt osäkert när den officiella omröstningen sker, senaste datum är angivet till den 15e april. Därefter inleder man diskussionerna kring strukturen för hela systemet. Mer information för den som är intresserad finns att läsa på EU Kommissionens hemsida.
Den råvarugrupp som är mest beroende av den globala konjunkturen är Energi och med en starkare konjunktur ser vi positivt på utvecklingen för denna sektor. Vi tror på: ENERGI H
Livsmedel
Ökad europeisk veteproduktion
Terminspriserna på vete noteras upp sedan förra veckan i både Chicago och Paris. Uppgången är delvis en följd av något torrare och varmare väderlek för det amerikanska höstvetet, vilket inte gynnar grödan inför våren. Större amerikansk export än väntat har även det bidragit till prisuppgången.
I EU har nederbörd i söder saktat upp vårbruket i en del regioner samtidigt som klart kyligare väder och en del snö fördröjer vårbruket i norra Europa. EU-kommissionen spår den högsta europeiska veteskörden på fem år med 140 miljoner ton, upp 6,2 procent från förra året. I dagsläget upplevs bara problem i Storbritannien och norra Frankrike som båda fått för mycket regn. I Ukraina har det fallit regn eller snö i de centrala och norra delarna vilket fördröjer vårbruket, landets södra delar är dock mildare och torrare. Andelen utvintring uppskattas till omkring 9 procent, klart lägre än förra årets 25 procent. Ryssland är med tanke på begränsat snötäcke i en del sydliga regioner något för kallt. Förutom torrt väder för höstvetet i USA och än så länge relativt små problem i EU finns det i dagsläget inte mycket som oroar och all anledning att tro på en ökad global veteproduktion. Även för den amerikanska majsen, vilken har stor påverkan på vetet, har situationen förbättrats. Givet inga större väderproblem bör vi kunna vänta oss fortsatt lägre priser lite längre fram på året.
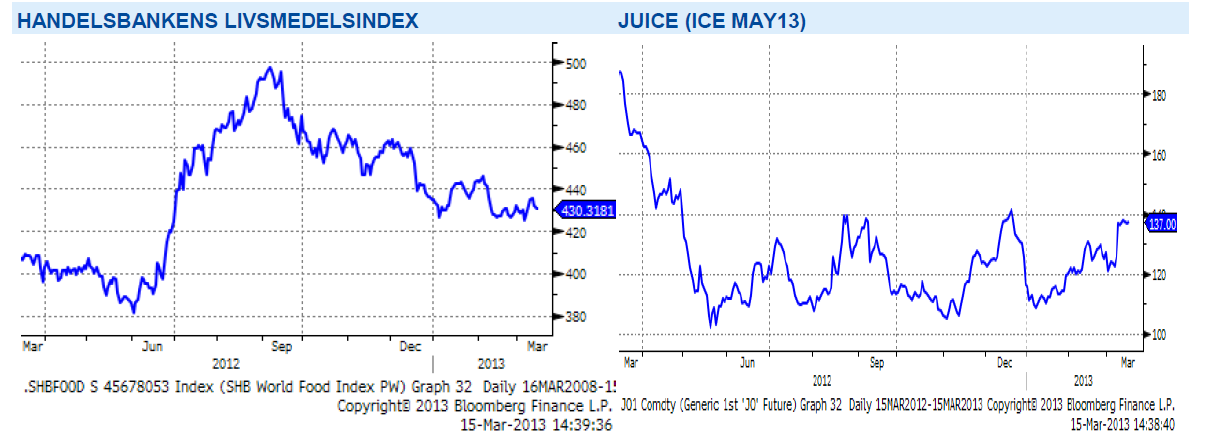
På kaffemarknaden väntas rekordskördar i Brasilien där produktionen beräknas öka från 47 till 48 miljoner bags (1 bag = 60 kg) för säsongen 2013/-14. Kaffe är en varannan-år-råvara och efter ett år (2012) med rekordskördar brukar normalt året efter innebära ett produktionsbortfall med omkring 30 procent. Men med bättre beskärningsteknik och ökat antal planterade träd per hektar har man i år lyckats minska produktionsbortfallet till omkring 10 procent. Vi har med anledning av detta noterat fallande priser efter en svajig tid med delvis stigande priser som följd av oroligheterna kring svampsjukdomar i Centralamerika. Juice är en av råvarorna som stigit mest i år, upp 18 procent sedan årsskiftet.
Torkan i Florida fortsätter drabba apelsinodlingen och torrare väder väntas de kommande två veckorna. Regnsäsongen drar i gång i juni men mycket mer regn behövs. I förra veckan sänkte det amerikanska jordbruksdepartementet, USDA sin prognos för apelsinproduktionen i Florida med 1,8 procent vilket fått priset på apelsinterminen att skjuta i höjden.
Vi behåller vår negativa syn för soja, majs och vete, trots riskerna för torrt väder i USA. Normal väderlek bör ge press på spannmålspriserna. Vi tror på: LIVSMEDEL S H
Handelsbankens Råvaruindex
Handelsbankens råvaruindex består av de underliggande indexen för respektive råvara. Vikterna är bestämda till hälften från värdet av global produktion och till hälften från likviditeten i terminskontrakten.
[box]SHB Råvarubrevet är producerat av Handelsbanken och publiceras i samarbete och med tillstånd på Råvarumarknaden.se[/box]
Ansvarsbegränsning
Detta material är producerat av Svenska Handelsbanken AB (publ) i fortsättningen kallad Handelsbanken. De som arbetar med innehållet är inte analytiker och materialet är inte oberoende investeringsanalys. Innehållet är uteslutande avsett för kunder i Sverige. Syftet är att ge en allmän information till Handelsbankens kunder och utgör inte ett personligt investeringsråd eller en personlig rekommendation. Informationen ska inte ensamt utgöra underlag för investeringsbeslut. Kunder bör inhämta råd från sina rådgivare och basera sina investeringsbeslut utifrån egen erfarenhet.
Informationen i materialet kan ändras och också avvika från de åsikter som uttrycks i oberoende investeringsanalyser från Handelsbanken. Informationen grundar sig på allmänt tillgänglig information och är hämtad från källor som bedöms som tillförlitliga, men riktigheten kan inte garanteras och informationen kan vara ofullständig eller nedkortad. Ingen del av förslaget får reproduceras eller distribueras till någon annan person utan att Handelsbanken dessförinnan lämnat sitt skriftliga medgivande. Handelsbanken ansvarar inte för att materialet används på ett sätt som strider mot förbudet mot vidarebefordran eller offentliggörs i strid med bankens regler.


The latest weekly report from the US DOE showed a substantial drawdown across key petroleum categories, adding more upside potential to the fundamental picture.

Commercial crude inventories (excl. SPR) fell by 5.8 million barrels, bringing total inventories down to 415.1 million barrels. Now sitting 11% below the five-year seasonal norm and placed in the lowest 2015-2022 range (see picture below).
Product inventories also tightened further last week. Gasoline inventories declined by 2.1 million barrels, with reductions seen in both finished gasoline and blending components. Current gasoline levels are about 3% below the five-year average for this time of year.
Among products, the most notable move came in diesel, where inventories dropped by almost 4.1 million barrels, deepening the deficit to around 20% below seasonal norms – continuing to underscore the persistent supply tightness in diesel markets.
The only area of inventory growth was in propane/propylene, which posted a significant 5.1-million-barrel build and now stands 9% above the five-year average.
Total commercial petroleum inventories (crude plus refined products) declined by 4.2 million barrels on the week, reinforcing the overall tightening of US crude and products.


A classic case of “buy the rumor, sell the news” played out in oil markets, as Brent crude has dropped sharply – down nearly USD 10 per barrel since yesterday evening – following Iran’s retaliatory strike on a U.S. air base in Qatar. The immediate reaction was: “That was it?” The strike followed a carefully calibrated, non-escalatory playbook, avoiding direct threats to energy infrastructure or disruption of shipping through the Strait of Hormuz – thus calming worst-case fears.
After Monday morning’s sharp spike to USD 81.4 per barrel, triggered by the U.S. bombing of Iranian nuclear facilities, oil prices drifted sideways in anticipation of a potential Iranian response. That response came with advance warning and caused limited physical damage. Early this morning, both the U.S. President and Iranian state media announced a ceasefire, effectively placing a lid on the immediate conflict risk – at least for now.
As a result, Brent crude has now fallen by a total of USD 12 from Monday’s peak, currently trading around USD 69 per barrel.
Looking beyond geopolitics, the market will now shift its focus to the upcoming OPEC+ meeting in early July. Saudi Arabia’s decision to increase output earlier this year – despite falling prices – has drawn renewed attention considering recent developments. Some suggest this was a response to U.S. pressure to offset potential Iranian supply losses.
However, consensus is that the move was driven more by internal OPEC+ dynamics. After years of curbing production to support prices, Riyadh had grown frustrated with quota-busting by several members (notably Kazakhstan). With Saudi Arabia cutting up to 2 million barrels per day – roughly 2% of global supply – returns were diminishing, and the risk of losing market share was rising. The production increase is widely seen as an effort to reassert leadership and restore discipline within the group.
That said, the FT recently stated that, the Saudis remain wary of past missteps. In 2018, Riyadh ramped up output at Trump’s request ahead of Iran sanctions, only to see prices collapse when the U.S. granted broad waivers – triggering oversupply. Officials have reportedly made it clear they don’t intend to repeat that mistake.
The recent visit by President Trump to Saudi Arabia, which included agreements on AI, defense, and nuclear cooperation, suggests a broader strategic alignment. This has fueled speculation about a quiet “pump-for-politics” deal behind recent production moves.
Looking ahead, oil prices have now retraced the entire rally sparked by the June 13 Israel–Iran escalation. This retreat provides more political and policy space for both the U.S. and Saudi Arabia. Specifically, it makes it easier for Riyadh to scale back its three recent production hikes of 411,000 barrels each, potentially returning to more moderate increases of 137,000 barrels for August and September.
In short: with no major loss of Iranian supply to the market, OPEC+ – led by Saudi Arabia – no longer needs to compensate for a disruption that hasn’t materialized, especially not to please the U.S. at the cost of its own market strategy. As the Saudis themselves have signaled, they are unlikely to repeat previous mistakes.
Conclusion: With Brent now in the high USD 60s, buying oil looks fundamentally justified. The geopolitical premium has deflated, but tensions between Israel and Iran remain unresolved – and the risk of missteps and renewed escalation still lingers. In fact, even this morning, reports have emerged of renewed missile fire despite the declared “truce.” The path forward may be calmer – but it is far from stable.
Analys
A muted price reaction. Market looks relaxed, but it is still on edge waiting for what Iran will do
Brent crossed the 80-line this morning but quickly fell back assigning limited probability for Iran choosing to close the Strait of Hormuz. Brent traded in a range of USD 70.56 – 79.04/b last week as the market fluctuated between ”Iran wants a deal” and ”US is about to attack Iran”. At the end of the week though, Donald Trump managed to convince markets (and probably also Iran) that he would make a decision within two weeks. I.e. no imminent attack. Previously when when he has talked about ”making a decision within two weeks” he has often ended up doing nothing in the end. The oil market relaxed as a result and the week ended at USD 77.01/b which is just USD 6/b above the year to date average of USD 71/b.

Brent jumped to USD 81.4/b this morning, the highest since mid-January, but then quickly fell back to a current price of USD 78.2/b which is only up 1.5% versus the close on Friday. As such the market is pricing a fairly low probability that Iran will actually close the Strait of Hormuz. Probably because it will hurt Iranian oil exports as well as the global oil market.
It was however all smoke and mirrors. Deception. The US attacked Iran on Saturday. The attack involved 125 warplanes, submarines and surface warships and 14 bunker buster bombs were dropped on Iranian nuclear sites including Fordow, Natanz and Isfahan. In response the Iranian Parliament voted in support of closing the Strait of Hormuz where some 17 mb of crude and products is transported to the global market every day plus significant volumes of LNG. This is however merely an advise to the Supreme leader Ayatollah Ali Khamenei and the Supreme National Security Council which sits with the final and actual decision.
No supply of oil is lost yet. It is about the risk of Iran closing the Strait of Hormuz or not. So far not a single drop of oil supply has been lost to the global market. The price at the moment is all about the assessed risk of loss of supply. Will Iran choose to choke of the Strait of Hormuz or not? That is the big question. It would be painful for US consumers, for Donald Trump’s voter base, for the global economy but also for Iran and its population which relies on oil exports and income from selling oil out of that Strait as well. As such it is not a no-brainer choice for Iran to close the Strait for oil exports. And looking at the il price this morning it is clear that the oil market doesn’t assign a very high probability of it happening. It is however probably well within the capability of Iran to close the Strait off with rockets, mines, air-drones and possibly sea-drones. Just look at how Ukraine has been able to control and damage the Russian Black Sea fleet.
What to do about the highly enriched uranium which has gone missing? While the US and Israel can celebrate their destruction of Iranian nuclear facilities they are also scratching their heads over what to do with the lost Iranian nuclear material. Iran had 408 kg of highly enriched uranium (IAEA). Almost weapons grade. Enough for some 10 nuclear warheads. It seems to have been transported out of Fordow before the attack this weekend.
The market is still on edge. USD 80-something/b seems sensible while we wait. The oil market reaction to this weekend’s events is very muted so far. The market is still on edge awaiting what Iran will do. Because Iran will do something. But what and when? An oil price of 80-something seems like a sensible level until something do happen.


Samtal om flera delar av råvarumarknaden
Tightening fundamentals – bullish inventories from DOE

Jonas Lindvall är tillbaka med ett nytt oljebolag, Perthro, som ska börsnoteras

Oljan, guldet och marknadens oroande tystnad

Domstolen ger klartecken till Lappland Guldprospektering

Stor uppsida i Lappland Guldprospekterings aktie enligt analys

Brookfield ska bygga ett AI-datacenter på hela 750 MW i Strängnäs

Sommaren inleds med sol och varierande elpriser
Silverpriset släpar efter guldets utveckling, har mer uppsida
Brent needs to fall to USD 58/b to make cheating unprofitable for Kazakhstan
-
 Nyheter3 veckor sedan
Stor uppsida i Lappland Guldprospekterings aktie enligt analys
-
 Nyheter4 veckor sedan
Brookfield ska bygga ett AI-datacenter på hela 750 MW i Strängnäs
-
 Nyheter4 veckor sedan
Sommaren inleds med sol och varierande elpriser
-
 Nyheter3 veckor sedan
Silverpriset släpar efter guldets utveckling, har mer uppsida
-
Analys4 veckor sedan
Brent needs to fall to USD 58/b to make cheating unprofitable for Kazakhstan
-

 Nyheter4 veckor sedan
Tradingfirman XTX Markets bygger datacenter i finska Kajana för 1 miljard euro
-

 Nyheter2 veckor sedan
Uppgången i oljepriset planade ut under helgen
-

 Nyheter2 veckor sedan
Låga elpriser i sommar – men mellersta Sverige får en ökning