

Analys
Råvaruplanket: Politiska spel avgör råvarornas andra halvår

![]() Utbudsstörningar balanserar oljemarknaden
Utbudsstörningar balanserar oljemarknaden
Sedan mars då vi trodde att nästa rörelse för oljan skulle bli ner har oljan stigit kraftigt. Ökad aktivitet i skifferfälten som vi väntade oss då, har börjat synas nu istället, nästan tre månader senare. Det vittnar om hur pressade skifferproducenterna har varit. Samtidigt har utbudsstörningar snabbt förbättrat marknadsbalansen. Andra halvåret blir nu ett svårt vågspel på hur Nigeria och Venezuelas komplexa produktion utvecklar sig. Vi tror fortfarande att priserna kommer ner något, men inte så mycket som i mars och vi ser helt klart ökad risk på uppsidan i vårt prisantagande med Brent kring USD 40 i slutet av året.
 Basmetallerna spretar
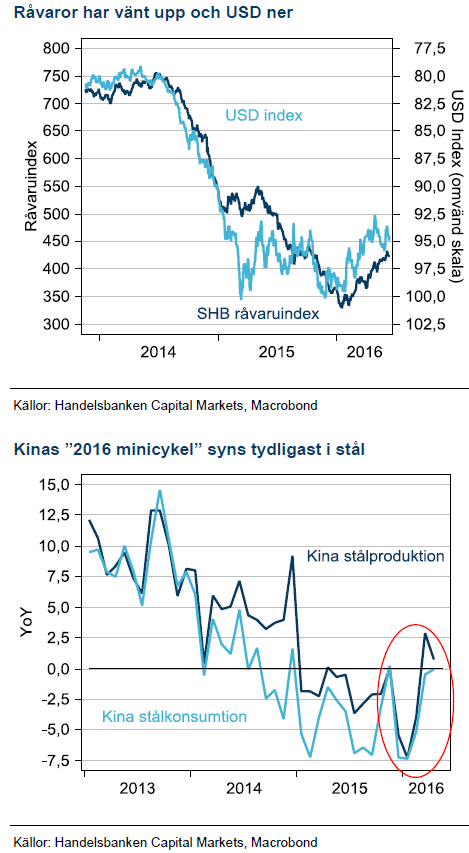
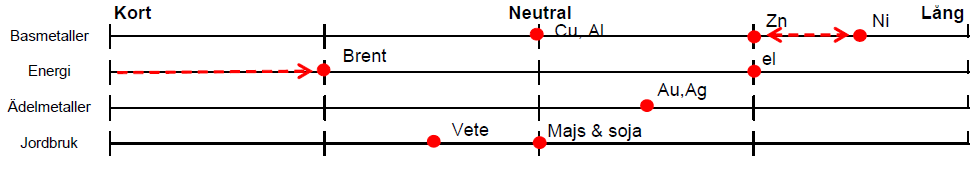
Av våra ”key case” detta år, stigande zink och nickelpriser har zink tagit fart och stigit med 30 % så här långt. Nickel ligger dock kvar trots att marknadsbalansen ser allt mer ansträngd ut. Efter zinkuppgången håller vi nickel som främsta råvara med chans att stiga 15 % i pris till slutet av året med vårt prismål på USD 10600. Zink håller vi kvar på USD 2200 och koppar tar vi ner från USD 5000 till USD 4500 då gruvbolagen fortsätter öka produktionen och Kina inte svarar upp till ökad efterfrågan.
Fed velar och Brexit spökar
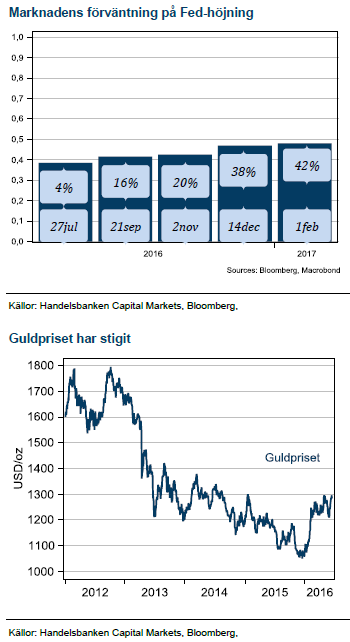
Fed:s ledare, Yellen behöll utsagan om två höjningar i år. Guld och ädelmetallers starka korrelation till huruvida Fed höjer eller ej skapar risk på nedsidan i ädelmetallerna då två höjningar inte är prissatta i marknaden. I andra vågskålen ligger veckans utkomst från omröstningen i Storbritannien. Ett tydligt ”lämna EU” resultat, låt säga 60-40 tror vi är gnistan till ett ny hållbar guldprisuppgång där kommande val i Spanien, Belgien och Holland kan ge influenser som ökar intresset för guld som säker hamn. Vår prognos med guld till USD 1300 har precis infallit och vi höjer den till USD 1400 på större sannolikhet för europeiskt tumult än en aggressivt räntehöjande Fed under andra halvåret.
Vår syn för Q3 och Q4 2016:
Basmetaller
 Efterfrågan stjälper snarare än hjälper
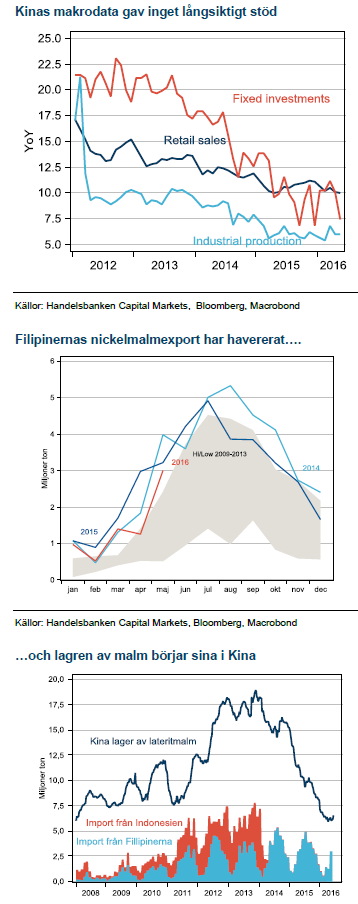
Förra kvartalet höjde vi utsikterna för koppar, baserat på bättre makrodata i Kina. Tre månader senare har det visat sig att trenden inte var hållbar och efterfrågan från Kina snarare tynger än stärker basmetallerna. I den miljön är det på utbudssidan vi letar för att hitta olika fundamenta för metallerna.
Zink sticker ut
Marknadsbalansen för zink har halkat ner i brist efter att den väl annonserade historien om stora gruvor som stänger då de är utbrutna börjar synas i data. Redan före jul skeppade den största av dem, Century sin sista malm men det är först nu som det verkligen börjar märkas och priserna stiger. Den långa ledtiden förklaras av den svaga efterfrågan. Trots att zink har stigit 30% till sin topp i år tror vi att den här historien har mer kraft och behåller vårt målpris på USD 2200, 8% över dagens pris.
Nickel näst på tur?
Näst efter zink har vi hållit nickel som mest trolig att hamna i underskott. Efter Indonesiens exportförbud på latteritmalm 2014 har det dröjt oväntat länge före marknadsbalansen stramats åt. Fillipinerna började ta en del av Indonesien marknadsandel och Kina som är köparen av malmen hade bunkrat lager. Nu sinar lagren och exporten från Filipinerna minskar efter politiska restriktioner för att värna miljön. Vi ser 15% uppsida till USD 10,600 i nickel under andra halvåret.
Aluminium och koppar svagast fundamenta
Erfarenheterna från årets minicykel i Kina har tydligt visat att aluminium är den basmetall där avställd kapacitet snabbast kommer i produktion när priserna stiger. Det hindrar alla prisuppgångar från att bli långvariga. Givet vår syn att energipriserna bör dämpas något under andra halvåret så ser vi att aluminium återvänder till USD 1500-1550.
Kopparproduktionen ökade inte riktigt som förväntat förra året men gruvbolagen håller kvar sina expansionsplaner, de har snarare försenats något än bordlagts. Kinesiska efterfrågan har varit svagare än väntat i år, trots bättre makrodata. Det senaste trenden med stigande lager på LME är oroande då det sannolikt är metall som hållits utanför marknaden i Kina tidigare. Vi sänker vår prognos tillbaka till USD 4500 från det tillfälliga lyftet till USD 5000 förra kvartalet.
Energi
 Utbudsstörningarna högsta på fem år
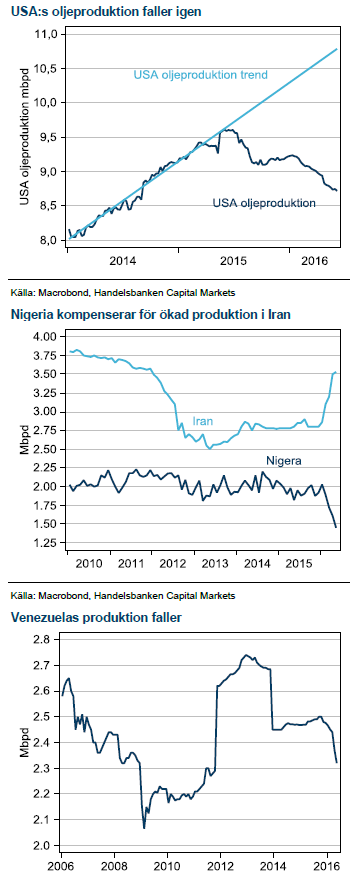
Efter att spenderat det mesta av januari och februari omkring 30-strecket studsade oljan plötsligt upp i mitten av mars. Utbudsstörningar i Irak, Nigeria, Venezuela och Kanada samtidigt som USA:s skifferolja minskade produktionen i sviterna av de låga priserna ligger bakom uppgången.
Temporära eller strukturella
Just nu gör marknaden skillnad på strukturella produktionsnedgångar som skifferolja som inte klarade prisnedgången under första kvartalet och därför minskar produktionen. Andra nedgångar är temporära, dit räknas branden i Kanada som tvingat producenterna av oljesand att evakuera personal men också nedgången i Nigeria och Venezuela. Produktionsfaciliteterna i oljesanden är inte skadade och väntas vara i full produktion i slutet av juni och bidrar då till att öka produktionsöverskottet igen.
De svaga i OPEC rebalanserar
Nigeria och Venezuela ser vi som mycket större långsiktiga hot. I Venezuela har staten sänkt antalet arbetsdagar för statligt anställda från fem till två efter brist på medel att betala ut löner. All oljeproduktion sker genom det statliga oljebolaget. Produktionen har gått ner och lägre produktion ger ytterligare lägre intäkter till staten. I Nigeria anfaller militanta grupper som tidigare fick monetära stöd av staten oljeproduktionssystemet i protest mot att utländska oljebolag fortsätter produktionen när landet får allt sämre finanser. När produktionen faller får staten ännu sämre möjligheter att ”köpa sig fri” från aktivisternas attacker. Båda länderna är alltså inne i en negativ spiral som är svår att bryta och det ökar riskerna för oljepriset under andra halvåret. Vårt huvudscenario är dock fortfarande att oljan faller tillbaka något när skifferproduktion börjar öka i slutet av tredje kvartalet och Kanadas oljesand är tillbaka i full produktion.
Kol stärker elpriserna
Kolpriserna har inte bara slutat falla utan även vänt upp sedan april. Tillsammans med stigande olja har de längre elterminerna stigit omkring 45 % sedan botten i februari. Kolprisuppgången tror vi främst beror på svagare USD efter Feds uteblivna räntehöjningar. Kolproducenterna har produktionskostnad i lokal valuta och säljer i USD.
Ädelmetaller
 Feds huvudvärk är guldets gnista
Vi har tidigare argumenterat för att Feds supermjuka penningpolitik var den främsta drivkraften till guldprisuppgången efter finanskrisen. Guld föll också kraftigt när Fed började med ”tapering”. Efter att Fed startat höjningscykeln i december 2015 har mycket utvecklats på ett ogynnsamt vis för den Amerikanska centralbanken. Makrodata har visserligen förbättrats och finansiella marknader har i stort återhämtat sig sedan decemberhöjningen. Osäkerheten i marknaden består dock och det är långt kvar till räntemarknaden åter prisar höjningar från Fed likt vid decembermötet.
Vid junimötet hade Yellen chansen med valde att prata bort risken för en höjning en vecka före mötet. Fed indikerar dock fortfarande två höjningar i år. Troligen väljer de att höja i september och december. Om de höjer. Räntemarknaden prissätter knappt 40% sannolikhet för en höjningen före årsskiftet. Om Fed överraskar och höjer två gånger enligt sin utsago betyder det högst sannolikt att guld faller i pris.
Europa i nytt tumult
I andra vågskålen ligger det tumultartade scenario som målas upp för Europa om Storbritannien röstar för att tydligt lämna EU. Ett resultat med knapp majoritet för att lämna betyder sannolikt inte så mycket men en 60-40 för att lämna betyder att man ska ut och kommer sannolikt starta en opinionsvåg i andra länder som blir negativ för finansiella marknader. I sådan miljö brukar guld ha sin bästa tid. Tyvärr ser vi politisk turbulens som drivkraft, eventuellt tillsammans med en avvaktade Fed som mer sannolikt än en aggressivt räntehöjnade Fed. Därmed fortsätter vi tro på högre guld och ädelmetaller och lyfter guldprognosen med USD 100 till USD 1400.
Jordbruk
 Hög risk i vete
Vete i Paris har fallit tillbaka ner mot årets lägsta nivåer efter en tillfällig uppgång i början av juni. Regn och översvämningar i Europa och Ryssland låg bakom mycket av uppgången. När nu vädret blir bättre faller priserna tillbaka igen. I USA är omständigheterna närmst perfekta med torrt väder i Södern där skörden nu är igång samtidigt som Norra delarna får regn, passande för de senare grödorna där.
Väderproblemen har försenat det prisfall vi tänkte oss för tre månader sedan. Trots det ser vi inget, förutom väderproblem i något av de större odlingsområdena som kan vända pristrenden. Terminer med längre löptid handlas till en stor premie, främst en riskpremie för eventuellt sämre skörd. Normalt faller denna riskpremie ur successivt fram till skörd. Vi fortsätter tro på priser kring 140 EUR/ton vid årets skörd, en prövning som kan komma att balansera produktionen för nästa år och därmed dämpa lageruppbyggnaden.
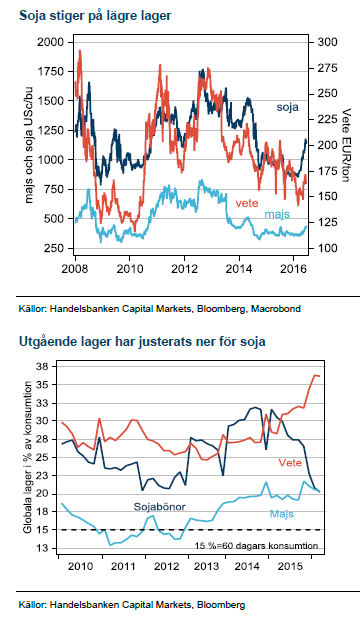
Sojalagren faller
Globala lager av sojabönor har justerats ner successivt. Främst har det skett efter regn Argentina. Lagerjusteringen ger visst stöd till vete och majs via substitution, om än i mindre utsträckning än mellan vete och majs. Lägre sojalager kan vara en riskfaktor att se upp med framöver och vi ser sojaskörden som den mest viktiga faktorn att bevaka i år.
[box]SHB Råvarukommentar är producerat av Handelsbanken och publiceras i samarbete och med tillstånd på Råvarumarknaden.se[/box]
Ansvarsbegränsning
Detta material är producerat av Svenska Handelsbanken AB (publ) i fortsättningen kallad Handelsbanken. De som arbetar med innehållet är inte analytiker och materialet är inte oberoende investeringsanalys. Innehållet är uteslutande avsett för kunder i Sverige. Syftet är att ge en allmän information till Handelsbankens kunder och utgör inte ett personligt investeringsråd eller en personlig rekommendation. Informationen ska inte ensamt utgöra underlag för investeringsbeslut. Kunder bör inhämta råd från sina rådgivare och basera sina investeringsbeslut utifrån egen erfarenhet.
Informationen i materialet kan ändras och också avvika från de åsikter som uttrycks i oberoende investeringsanalyser från Handelsbanken. Informationen grundar sig på allmänt tillgänglig information och är hämtad från källor som bedöms som tillförlitliga, men riktigheten kan inte garanteras och informationen kan vara ofullständig eller nedkortad. Ingen del av förslaget får reproduceras eller distribueras till någon annan person utan att Handelsbanken dessförinnan lämnat sitt skriftliga medgivande. Handelsbanken ansvarar inte för att materialet används på ett sätt som strider mot förbudet mot vidarebefordran eller offentliggörs i strid med bankens regler.


Market is starting to take US/Iran headlines with a pinch of salt. Brent crude rose $2.8/b yesterday to an official close of $112.1/b. But after that it traded as low as $108.05/b before ending late night at around $109.7/b. Through the day it traded in a range of $106.87 – 112.72/b amid a flurry of news or rumors from Iran and the US. ”US temporary sanctions during negotiations” (falls alarm). ”We will bomb Iran” (not anyhow),… etc. While the market is still fluctuating to this kind of news flow, it is starting to take such headlines with a pinch of salt.

We’ll see. Maybe, maybe not. The Brent M1 contract is trading at $110.2/b this morning which very close to the average ticks through yesterday of $110.4/b.
Trump with bearish, verbal intervention whenever Brent trades above $110/b it seems. What seems to be a pattern is that Trump states something like ”very good negotiations going on with Iran”, ”New leaders in Iran are great,..”, ”Great progress in negotiations,…”, ”Deal in sight,..” etc whenever the Brent M1 contract trades above $110/b. An effort to cool the market. These hot air verbal interventions from Trump used to have a heavy bearish impact on prices, but they now seems to have less and less effect unless they are backed by reality.
As far as we can see there has been no real progress in the negotiations between the US and Iran with both sides still standing by their previous demands.
Iran is getting stronger while the cease fire lasts making a return to war for Trump yet harder. Iran is naturally in constant preparation for a return to war given Trump’s steady threats of bombing Iran again. Iran is naturally doing what ever is possible to prepare for a return to war. And every day the cease fire lasts it is better prepared. This naturally makes it more and more difficult and dangerous for the US to return to warring activity versus Iran as the consequences for energy infrastructure in the Persian Gulf will be more and more severe the longer the cease fire lasts. Israel seems to see it this way as well. That the war is not won and that current frozen state of a cease fire gives Iran opportunity to rebuild military and politically.
Global inventories are drawing down day by day. How much? In the meantime the Strait of Hormuz stays closed. There is varying measures and estimates of how much global inventories are drawing down. Our rough estimate, back of the envelope, is that global inventories are drawing down by at least some 10 mb/d or about 300 mb/d in a balance between loss of supply versus demand destruction. Other estimates we see are a monthly draw of 250-270 mb/d. The IEA only ’measured’ a draw in global observable stocks of 117 mb in April with oil on water rising 53 mb while on shore stocks fell 170 mb. But global stocks are hard to measure with large invisible, unmeasured stocks. As such a back of the envelope approach may be better.
Oil products is what the world is consuming. Oil product prices likely to rise while product stocks fall. Strategic Petroleum Reserves (SPR) are predominantly crude oil. Discharging oil from OECD SPR stocks, a sharp reduction in Chinese crude imports and a reduction in global refinery throughput of 6-7 mb/d has helped to keep crude oil markets satisfactorily supplied. But global inventories are drawing down none the less. And oil products is really what the world is consuming. So if global refinery throughput stays subdued, then demand will eventually have to match the supply of oil products. The likely path forward this summer is a steady draw down in jet fuel, diesel and gasoline. Higher prices for these. Then, if possible, higher refinery throughput and higher usage of crude in response to very profitable refinery margins. And lastly sharper draw in crude stocks and higher prices for these. But some 6 mb/d of oil products used to be exported through the Strait of Hormuz. And it may not be so easy to ramp up refinery activity across the world to compensate. Especially as Ukraine continues to damage Russian refineries as well as Russian crude production and export facilities.
Watch oil product stocks and prices as well as Brent calendar 2027. What to watch for this summer is thus oil product inventories falling and oil product premiums to crude rising. Another measure to watch is the Brent crude 2027 contract as it rises steadily day by day as the Strait of Hormuz stays closed and global oil inventories decline. The latter is close to the highest level since the start of the war and keeps rising.
The Brent M1 contract and the Brent 2027 prices and current price of jet fuel in Europe (ARA). All in USD/b

Our back of the envelope calculation of the global shortage created by the closure of the Strait of Hormuz. Note that 3.5 mb/d of discharge from SPR is also a draw. Note also that ’Forced demand loss’ of 2.5 mb/d is probably temporary and will fall back towards zero as logistics are sorted out leaving ’Price demand loss’ to do the job of balancing the market. Thus a shortfall of at least 9 mb/d created by the closure. More if SPR discharge is included and more if Forced demand loss recedes.

Brent is climbing higher. Front-month is at USD 106.3/bl this morning, close to a weekly high and a USD 9/bl jump from Mondays open. This is the move we flagged as a risk earlier in the week: the market shifting from ”a deal is around the corner” to ”this is going to take longer than we thought”.

Analyst Commodities, SEB
During April, rest-of-year Brent remained remarkably stable around USD 90/bl. A stability which rested on one single assumption: the SoH reopens around 1 May. That assumption is now slowly falling apart.
As we highlighted yesterday: every week of delay beyond 1 May adds (theoretically) ish USD 5/bl to the rest-of-year average, as global inventories draw 100 million barrels per week. i.e., a mid-May reopening implies rest-of-year Brent closer to USD 100/bl, and anything pushing into June or July takes us meaningfully higher.
What’s changed in the last 48 hours:
#1: The US military has formally warned that clearing suspected sea mines from SoH could take up to six months. That is a completely different timescale from what the financial market is pricing. Even a political deal tomorrow does not immediately reopen the strait.
#2: Trump has shifted his tone from urgency to ”strategic patience”. In yesterday’s press conference: ”Don’t rush me… I want a great deal.” The market is reading this as a president no longer feeling pressured by timelines, with the naval blockade running in the background.
#3: So far, the military activity is escalating, not de-escalating. Axios reports Iran is laying more mines in SoH. The US 3rd carrier strike group (USS George H.W. Bush) is arriving with two countermine vessels. Trump yesterday ordered the US Navy to destroy any Iranian boats caught laying mines. While CNN reports that the Pentagon is actively drawing up plans to strike Iranian SoH capabilities and individual Iranian military leaders if the ceasefire collapses. i.e., NOT a attitude consistent with an imminent deal!
Spot crude and product prices eased off the early-April highs on a combination of system rerouting and deal optimism. Both now weakening. Goldman estimates April Gulf output is reduced by 14.5 mbl/d, or 57% of pre-war supply, a number that keeps getting worse the longer this drags on.
Demand-side adaptation is ongoing: S. Korea has cut its Middle East crude dependence from 69% to 56% by pulling more from the Americas and Africa, and Japan is kicking off a second round of SPR releases from 1 May. But SPRs are finite.
Ref. to the negotiations, we should not bet on speed. The current Iranian leadership is dominated by genuine hardliners willing to absorb economic pain and run the clock to extract concessions. That is not a setup for a rapid resolution. US/Israeli media briefings keep framing the delay as ”internal Iranian divisions”, the reality is more complicated and points toward weeks and months, not days.
Our point is that the complexity is large, and higher prices have only just started (given a scenario where the negotiations drag out in time). The market spent April leaning on the USD 90/bl rest-of-year assumption; that case is diminishing by the hour. If ”early May reopening” is replaced by ”June, July or later” over the next week or two, both crude and products have meaningful room to reprice higher from here. There is a high risk being short energy and betting on any immediate political resolution(!).
Down on Friday. Up on Monday. The Brent June crude oil contract traded down 5.1% last week to a close of $90.38/b. It reached a high of $103.87/b last Monday and a low of $86.09/b on Friday as Iran announced that the Strait of Hormuz was fully open for transit. That quickly changed over the weekend as the US upheld its blockade of Iranian oil exports while Iran naturally responded by closing the SoH again. The US blew a hole in the engine room of the Iranian ship TOUSKA and took custody of the ship on Sunday. Brent crude is up 5.6% this morning to $95.4/b.
The cease-fire is expiring tomorrow. The US has said it will send a delegation for a second round of negotiations in Islamabad in Pakistan. But Iran has for now rejected a second round of talks as it views US demands as unrealistic and excessive while the US is also blocking the Strait of Hormuz.
While Brent is up 5% this morning, the financial market is still very optimistic that progress will be made. That talks will continue and that the SoH will fully open by the start of May which is consistent with a rest-of-year average Brent crude oil price of around $90/b with the market now trading that balance at around $88/b.
Financial optimism vs. physical deterioration. We have a divergence where the financial market is trading negotiations, improvements and resolution while at the same time the physical market is deteriorating day by day. Physical oil flows remain constrained by disrupted flows, longer voyage times and elevated freight and insurance costs.
Financial markets are betting that a US/Iranian resolution will save us in time from violent shortages down the road. But every day that the SoH remains closed is bringing us closer to a potentially very painful point of shortages and much higher prices.
The US blockade is also a weapon of leverage against its European and Asian allies. When Iran closed the SoH it held the world economy as a hostage against the US. The US blockade of the SoH is of course blocking Iranian oil exports. But it is also an action of disruption directed towards Europe and Asia. The US has called for the rest of the world to engaged in the war with Iran: ”If you want oil from the Persian Gulf, then go and get it”. A risk is that the US plays brinkmanship with the global oil market directed towards its European and Asian allies and maybe even towards China to force them to engage and take part. Maybe unthinkable. But unthinkable has become the norm with Trump in the White House.


Sommarväder skapar prisrally på elbörsen
Oil product price pain is set to rise as the Strait of Hormuz stays closed into summer

Solkraften pressar elpriserna dagtid

Michel Gubel ger sin syn på oljemarknaden