

Analys
Råvarudeskens Årskrönika 2013

 ”Tailrisk-tapering-flattening”
Året då stimulanserna tog slut
 Under 2012 var ”tailrisk” modeordet som sammanfattade alla händelser av låg sannolikhet som skulle få stor inverkan om de inträffade. För råvarumarknaden var den mest uppenbara tailrisken konflikten mellan Israel och Iran. På makroplanet var riskerna kring EMU-zonen och USA:s konjunkturåterhämtning mest alarmerande tillsammans med Kinas inbromsning.
För att tysta Janne Korp* blandade USA, Kina och Europa ihop en trolldryck som hette duga. QE3 och Kinas sista egentliga stimulansinvesteringar kom under sensommaren 2012, medan 2013 har i mångt och mycket präglats av att stimulansfloden torkat upp. För USA:s del har episoden gått under namnet ”tapering” som också blev årets modeord. Bernankes ordlek kring när och hur tapering skulle uppstå har styrt marknadsrörelserna för att slutligen anlända som en vältimad julklapp i december. I Öst har de nytillträdda (inte nyvalda!) kinesiska ledarnas dito kommunikation kring tillväxtmålet som sänktes till 7,5 % och stimulansinvesteringar som nu skulle stabilisera och inte accelerera tillväxten haft minst lika stor påverkan på råvarupriserna.
Inget råvarurally
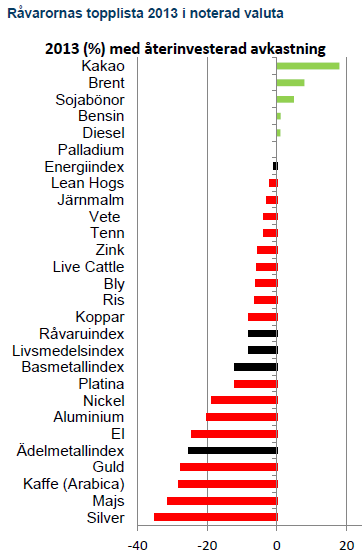
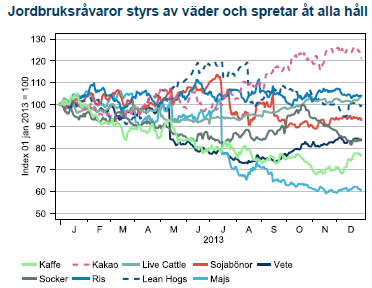
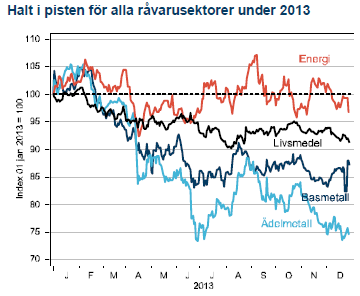 Fjolårets årskrönika titulerades ”Triskaidekafobia” – en grekisk ordlek med rädslan för den då stundande siffran 13. Otursnumret förde också ner råvarupriserna med besked. Vårt råvaruindex med 15 stycken råvaror tappade 8 % under året. Ingen av råvarusektorerna har stigit i värde. Energikorgen slutar precis under nollan på -1 % medan basmetaller, ädelmetaller och jordbruk föll med 12 %, 25 % och 8 %. Precis som i fjol ligger en jordbruksråvara i topp och på 2 av 3 bottenplatser. En tydlig erinran om vädergudens bidrag till volatiliteten i råvarupriserna. På samma tema finns majs och vete som fallit tillbaka efter fjolårets uppgång efter torkan i USA. Basmetallerna har dämpats efter att mycket av de högt ställda förväntningarna på produktionsökningar kommit till stånd. Ädelmetallerna har dock fallit mest, i egenskap av primär måltavla för årets modenyck – tapering.
Fallande priser har fått investerare att vikta ner råvaror medan våra industriella kunder utnyttjat de låga priserna på metaller för att säkra sina behov långt ut på kurvan. Elintensiva bolag kunde låsa in elpriset på 29,5öre/kWh 5 år framöver, vilket är det lägsta pris vi haft sedan 2005. Många lyckosamma jordbrukare sålde vete i grevens tid i början av året, innan den globala skörden på allvar fick priserna på fall.
* olyckskorpen i Fablernas värld, producerad 1968-1992
Guldet mitt i skottgluggen
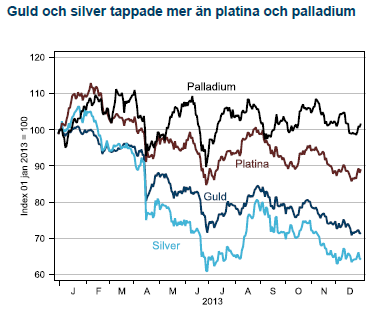 Året började med en stark förbättring av konjunkturutsikterna när USA undvek en skarp inbromsning efter det fiskala stupet och riskerna för att Euron skulle brytas upp minskade. I kölvattnet av denna starka start ökade investerares riskaptit och både guld och silver såldes till fördel för aktier. När sedan den oortodoxa penningpolitiken åter skulle börja tvingas in ramen för ortodox politik hamnade guld och silver mitt i skottgluggen. Utflödena ur guld-ETF:er var lavinartade och guld har under 2013 tappat 28 %, det största raset på 30 år. Investerare har allt sedan Fed:s QE1-start 2008 köpt guld och silver som hedge mot det kommande inflationsspöket. Spöket kom visserligen men snarare under namnet deflationsspöke (USA+EMU) och när nu Feds stimulanser avtar finner många guldgrävare det smärtsamma slutet på epoken för ”råvaran som inte kan gå ned”. När 2014 ser ut att bli ett säkrare år för världskonjunkturen, eurozonen fortfarande är intakt och Iran har kommit till förhandlingsbordet tror vi att guldet fortsätter ner och investerare som vill ha en icke centralbanksknuten valuta väljer Bitcoins (!).
Gruvbolagen försöker vända skutan
 Även utanför Sverige har gruvindustrin känt på prövningar under året som gått. I de tre stora gruvbolagen listade i London (Rio, BHP och Anglo America) har VD:n fått betala med sitt jobb när kostnadsstrukturen totalt missmatchat Kinas inbromsning och de lägre metallpriserna. Efterträdarna har målat upp bolagsstrategi i klassisk svångremsanda. Trendmässigt kan det vara ett tecken på att de senaste årens produktionsvåg huvudsakligen är över och för 2014 ser marknaden mer balanserad ut. Undantaget är järnmalm och koppar där en ny våg kommer under 2014.
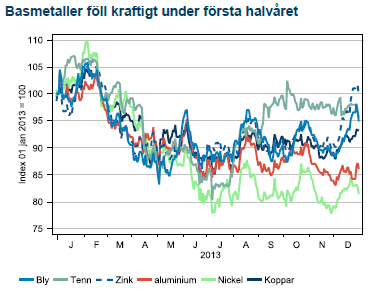
Nedgången för basmetaller kom under första halvåret då Kinas inbromsning verkade ske helt okontrollerat. När Kinas nya ledare började stimulera för att stabilisera ekonomin stabiliserades också basmetallerna. Ett rally under december avslutade året klart över bottenkänningen kring midsommar.
Brent blev årets skidbacke
 Under buller och bång har USA:s oljeproduktion stigit till 25 års högsta. På mindre än tre år har världens största oljekonsument vänt 40 år av fallande oljeproduktion till den största överraskningen i oljehistorien. Glädjande för oljepropagandamaskineriets fader, Obama, var också att under 2014 kommer importen för första gången på 20 år att vara lägre än produktionen. Denna utbudschock till trots har Brentoljan handlats i backwardation under hela året. USA:s stigande produktion har ganska precist kompenserats av den sammanlagda exportminskningen ifrån Iran, Libyen, Irak och Nigeria. De eviga produktionsstörningarna i områden med inverkan på Brentpriset (FOB Shetlandsöarna) har lett till en kraftig kurvlutning som gett investerare 12 % trots att Brent bara stigit med 6 %. USA-handlade WTI oljan har med stigande produktion istället legat i contango och givit dyr rullning för råvaruindex med WTI som underliggande oljetillgång.
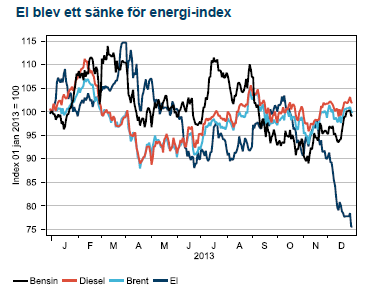
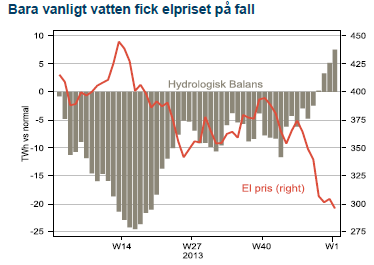 Råolja och oljeprodukterna bensin och diesel slutar året svagt i dur medan el blev årets besvikelse och föll hämningslöst under årets sista kvartal. En mild början på vintern (trots alla granna rönnbärsträd i oktober), en snabb påfyllning av vattenmagasinen från ett underskott till normalnivå och en sällsynt välfungerande svensk kärnkraft utgjorde mixen bakom prisraset i el.
Torkan över för den här gången
Årets stora rörelse var återhämtningen i produktion av majs efter torkan i USA 2012. Priset föll som en sten och placerade majs i botten av all råvaror 2013. Vinnaren bland livsmedelsråvarorna blev kakao som fortsätter sin långa, efterfrågedrivna trend uppåt. Utsikterna för stigande kakaopriser är fortfarande goda och lämnar en bitter eftersmak för chokladälskare.
Nu börjar hästens år
 Hästens år är sjunde året i den kinesiska zodiakens cykel om 12 år. Hästen står för det ädla och eleganta men också för snabbhet och uthållighet. Frågan är om den kinesiska ekonomin likaledes kommer uppvisa snabbhet och uthållighet under 2014? Troligen kommer den kinesiska ekonomin att hålla styrfart (>7 %) men uppsidan begränsas hela tiden av reformbehoven som ständigt aktualiseras när saker och ting ser ljusare ut. USA ska enligt Fed nu klara sig utan stimulanser medan Europa tragglar vidare precis norr om recession (1 %). Budskapet är tydligt; vi tror att ”flattening” kommer bli årets modeord 2014.


Brent crude has climbed roughly USD 1.5-2 per barrel since Friday, yet falling USD 0.3 per barrel this mornig and currently trading near USD 67.25/bbl after yesterday’s climb. While the rally reflects short-term geopolitical tension, price action has been choppy, and crude remains locked in a broader range – caught between supply-side pressure and spot resilience.

Prices have been supported by renewed Ukrainian drone strikes targeting Russian infrastructure. Over the weekend, falling debris triggered a fire at the 20mtpa Kirishi refinery, following last week’s attack on the key Primorsk terminal.
Argus estimates that these attacks have halted ish 300 kbl/d of Russian refining capacity in August and September. While the market impact is limited for now, the action signals Kyiv’s growing willingness to disrupt oil flows – supporting a soft geopolitical floor under prices.
The political environment is shifting: the EU is reportedly considering sanctions on Indian and Chinese firms facilitating Russian crude flows, while the U.S. has so far held back – despite Bessent warning that any action from Washington depends on broader European participation. Senator Graham has also publicly criticized NATO members like Slovakia and Hungary for continuing Russian oil imports.
It’s worth noting that China and India remain the two largest buyers of Russian barrels since the invasion of Ukraine. While New Delhi has been hit with 50% secondary tariffs, Beijing has been spared so far.
Still, the broader supply/demand balance leans bearish. Futures markets reflect this: Brent’s prompt spread (gauge of near-term tightness) has narrowed to the current USD 0.42/bl, down from USD 0.96/bl two months ago, pointing to weakening backwardation.
This aligns with expectations for a record surplus in 2026, largely driven by the faster-than-anticipated return of OPEC+ barrels to market. OPEC+ is gathering in Vienna this week to begin revising member production capacity estimates – setting the stage for new output baselines from 2027. The group aims to agree on how to define “maximum sustainable capacity,” with a proposal expected by year-end.
While the IEA pegs OPEC+ capacity at 47.9 million barrels per day, actual output in August was only 42.4 million barrels per day. Disagreements over data and quota fairness (especially from Iraq and Nigeria) have already delayed this process. Angola even quit the group last year after being assigned a lower target than expected. It also remains unclear whether Russia and Iraq can regain earlier output levels due to infrastructure constraints.
Also, macro remains another key driver this week. A 25bp Fed rate cut is widely expected tomorrow (Wednesday), and commodities in general could benefit a potential cut.
Summing up: Brent crude continues to drift sideways, finding near-term support from geopolitics and refining strength. But with surplus building and market structure softening, the upside may remain capped.
Brent crude is essentially flat on the week, but after a volatile ride. Prices started Monday near USD 65.5/bl, climbed steadily to a mid-week high of USD 67.8/bl on Wednesday evening, before falling sharply – losing about USD 2/bl during Thursday’s session.
Brent is currently trading around USD 65.8/bl, right back where it began. The volatility reflects the market’s ongoing struggle to balance growing surplus risks against persistent geopolitical uncertainty and resilient refined product margins. Thursday’s slide snapped a three-day rally and came largely in response to a string of bearish signals, most notably from the IEA’s updated short-term outlook.
The IEA now projects record global oversupply in 2026, reinforcing concerns flagged earlier by the U.S. EIA, which already sees inventories building this quarter. The forecast comes just days after OPEC+ confirmed it will continue returning idle barrels to the market in October – albeit at a slower pace of +137,000 bl/d. While modest, the move underscores a steady push to reclaim market share and adds to supply-side pressure into year-end.
Thursday’s price drop also followed geopolitical incidences: Israeli airstrikes reportedly targeted Hamas leadership in Doha, while Russian drones crossed into Polish airspace – events that initially sent crude higher as traders covered short positions.
Yet, sentiment remains broadly cautious. Strong refining margins and low inventories at key pricing hubs like Europe continue to support the downside. Chinese stockpiling of discounted Russian barrels and tightness in refined product markets – especially diesel – are also lending support.
On the demand side, the IEA revised up its 2025 global demand growth forecast by 60,000 bl/d to 740,000 bl/d YoY, while leaving 2026 unchanged at 698,000 bl/d. Interestingly, the agency also signaled that its next long-term report could show global oil demand rising through 2050.
Meanwhile, OPEC offered a contrasting view in its latest Monthly Oil Market Report, maintaining expectations for a supply deficit both this year and next, even as its members raise output. The group kept its demand growth estimates for 2025 and 2026 unchanged at 1.29 million bl/d and 1.38 million bl/d, respectively.
We continue to watch whether the bearish supply outlook will outweigh geopolitical risk, and if Brent can continue to find support above USD 65/bl – a level increasingly seen as a soft floor for OPEC+ policy.
Brent crude makes some gains as Israel’s attack on Hamas in Qatar rattles markets. Brent crude spiked to a high of USD 67.38/b yesterday as Israel made a strike on Hamas in Qatar. But it wasn’t able to hold on to that level and only closed up 0.6% in the end at USD 66.39/b. This morning it is starting on the up with a gain of 0.9% at USD 67/b. Still rattled by Israel’s attack on Hamas in Qatar yesterday. Brent is getting some help on the margin this morning with Asian equities higher and copper gaining half a percent. But the dark cloud of surplus ahead is nonetheless hanging over the market with Brent trading two dollar lower than last Tuesday.

Geopolitical risk premiums in oil rarely lasts long unless actual supply disruption kicks in. While Israel’s attack on Hamas in Qatar is shocking, the geopolitical risk lifting crude oil yesterday and this morning is unlikely to last very long as such geopolitical risk premiums usually do not last long unless real disruption kicks in.
US API data yesterday indicated a US crude and product stock build last week of 3.1 mb. The US API last evening released partial US oil inventory data indicating that US crude stocks rose 1.3 mb and middle distillates rose 1.5 mb while gasoline rose 0.3 mb. In total a bit more than 3 mb increase. US crude and product stocks usually rise around 1 mb per week this time of year. So US commercial crude and product stock rose 2 mb over the past week adjusted for the seasonal norm. Official and complete data are due today at 16:30.
A 2 mb/week seasonally adj. US stock build implies a 1 – 1.4 mb/d global surplus if it is persistent. Assume that if the global oil market is running a surplus then some 20% to 30% of that surplus ends up in US commercial inventories. A 2 mb seasonally adjusted inventory build equals 286 kb/d. Divide by 0.2 to 0.3 and we get an implied global surplus of 950 kb/d to 1430 kb/d. A 2 mb/week seasonally adjusted build in US oil inventories is close to noise unless it is a persistent pattern every week.
US IEA STEO oil report: Robust surplus ahead and Brent averaging USD 51/b in 2026. The US EIA yesterday released its monthly STEO oil report. It projected a large and persistent surplus ahead. It estimates a global surplus of 2.2 m/d from September to December this year. A 2.4 mb/d surplus in Q1-26 and an average surplus for 2026 of 1.6 mb/d resulting in an average Brent crude oil price of USD 51/b next year. And that includes an assumption where OPEC crude oil production only averages 27.8 mb/d in 2026 versus 27.0 mb/d in 2024 and 28.6 mb/d in August.
Brent will feel the bear-pressure once US/OECD stocks starts visible build. In the meanwhile the oil market sits waiting for this projected surplus to materialize in US and OECD inventories. Once they visibly starts to build on a consistent basis, then Brent crude will likely quickly lose altitude. And unless some unforeseen supply disruption kicks in, it is bound to happen.
US IEA STEO September report. In total not much different than it was in January

US IEA STEO September report. US crude oil production contracting in 2026, but NGLs still growing. Close to zero net liquids growth in total.


Tyskland har så höga elpriser att företag inte har råd att använda elektricitet
Brent crude ticks higher on tension, but market structure stays soft

Kinas elproduktion slog nytt rekord i augusti, vilket även kolkraft gjorde

Det stigande guldpriset en utmaning för smyckesköpare

Aktier i guldbolag laggar priset på guld

Meta bygger ett AI-datacenter på 5 GW och 2,25 GW gaskraftverk
Aker BP gör ett av Norges största oljefynd på ett decennium, stärker resurserna i Yggdrasilområdet
Sommarens torka kan ge högre elpriser i höst
Brent edges higher as India–Russia oil trade draws U.S. ire and Powell takes the stage at Jackson Hole

Mahvie Minerals är verksamt i guldrikt område i Finland
-
 Nyheter4 veckor sedan
Meta bygger ett AI-datacenter på 5 GW och 2,25 GW gaskraftverk
-
 Nyheter4 veckor sedan
Aker BP gör ett av Norges största oljefynd på ett decennium, stärker resurserna i Yggdrasilområdet
-
 Nyheter4 veckor sedan
Sommarens torka kan ge högre elpriser i höst
-
Analys4 veckor sedan
Brent edges higher as India–Russia oil trade draws U.S. ire and Powell takes the stage at Jackson Hole
-
 Nyheter3 veckor sedan
Mahvie Minerals är verksamt i guldrikt område i Finland
-
Analys4 veckor sedan
Increasing risk that OPEC+ will unwind the last 1.65 mb/d of cuts when they meet on 7 September
-

 Nyheter3 veckor sedan
Neil Atkinson spår att priset på olja kommer att stiga till 70 USD
-
Analys2 veckor sedan
OPEC+ in a process of retaking market share