

Analys
Modity om elpriset vecka 8 2015

Veckans marknadskommentar
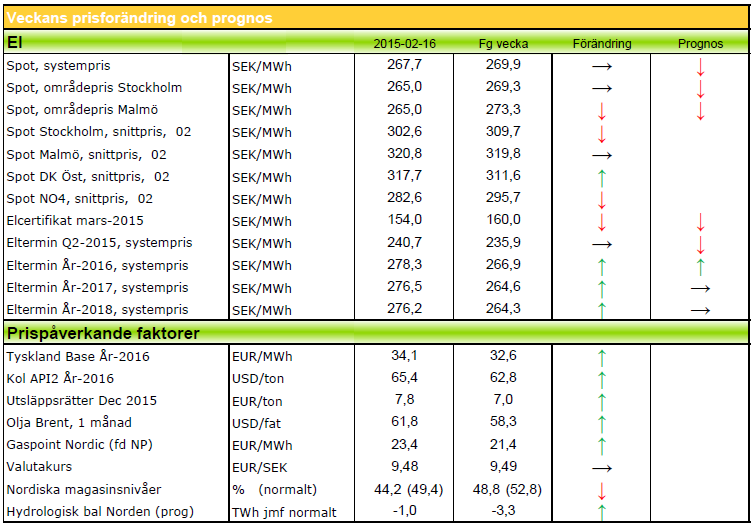
Kol och olja upp och drar med sig de långa elterminerna. Den korta elen är ned på varma, blöta och blåsiga prognoser. Utsläppsrätterna börjar nu stärkas rejält i avvaktan på omröstning. Hydrobalansen är för första gången på länge positiv samt att vi väntar mycket nederbörd den kommande tiodagarsperioden.
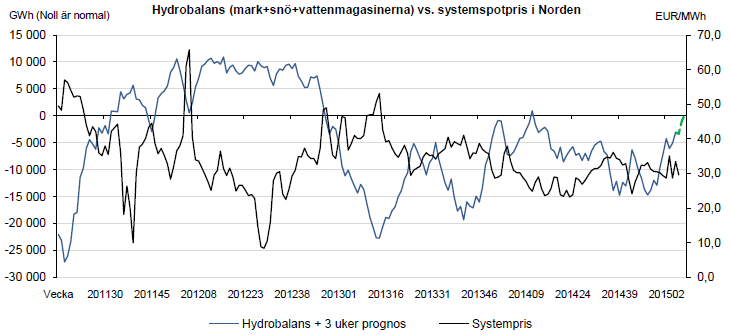
Hydrobalansen ligger v06 på 0,7 TWh över normalen. Så mycket nederbörd som det kommit sedan sist! Man pratar om den snörikaste vintern på över 50 år i västra Norge! Det är fortfarande så att prognoserna ser blöta och milda ut så en fortsatt upplagring av energi över normalen verkar det bli!
Kärnkraftverken i Norden har idag den 16/2 en produktion på 73 % (9 031 MW). Ringhals 4 är fortfarande ute för att ordna till läckan. Tillbaka på onsdag. Annars är Oskarshamn 2 kvar ute till september och Ringhals 2 till november. Finska Olkiluoto 2 är fortfarande ur drift – förlängt detta till återstart 18 februari. De finska verken körs därmed 68 %.
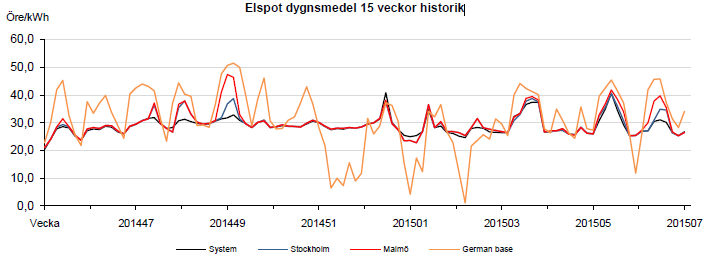
Systemspotpriset förra veckan blev 29,61 €/MWh. Det var en tillbakagång på nästan fyra euro. I prisområde SE3 blev den 30,87 och i SE4 33,34. Nu ser vi en ökning i temperaturerna igen och spoten förväntas inte överstiga 30 €/MWh (SYS).
Terminspriser
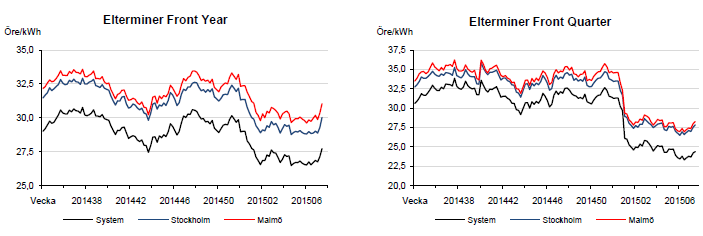
Förra veckan byttes de överblöta prognoserna ut mot mer måttliga och det fick veckan att visa en uppåtrörelse i både Q2-15 och YR-16. Den senare rätt så kraftigt. Skillnaden terminerna emellan var att Q2:an kom tillbaka lite på fredagen. Det gjorde inte året. Idag har nya prognoser i det närmaste fått Q2 att peka nedåt. Däremot ångar YR-16 på åt andra hållet. Det längre påverkas av andra faktorer än vädret i större grad än det korta. Vi ser högre priser i kol och CO2, vilket ger en starkare långtermin. Q2:an är mycket känsligare för vädret som är just nu och därför drar den nedåt. Omsätts i skrivande stund på 25,10. År 16 handlas nu på 28,90 €/MWh.
Bränslemarknaden
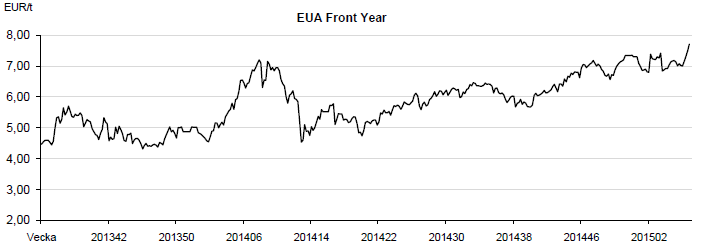
Utsläppsrätter, CO2
Det verkar nu som denna marknad har börjat bli nervös inför omröstningen om en vecka. Räknat från dippen vid förra omröstningen har priset nu stigit från 6,84 €/ton den 22 feb, till 7,83 senast omsatt idag. Lägg därtill att euron stärkts samtidigt så har det blivit kraftigt fördyrat att köpa utsläppsrätter för oss som har annan valuta i botten!
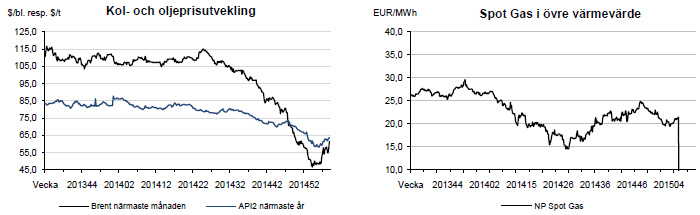
Olja: Brent (FM) har stigit med ca 8 dollar sedan lägstanoteringen i mitten av januari. Uppgången är rätt brant på sistone och det förklaras delvis av att marknader spekulerar för att göra korta vinster. Fundamentalt är det bara det faktum att ytterligare anläggningar stänger ned på grund av priset, som skulle kunna påverka uppåt. Totalt sett är det fortfarande ett tydligt och markant överskott på marknaden, vilket borde öka innan sommaren, när raffinaderierna kör för fullt. Därför kan den nuvarande uppgången vara ytterst instabil.
Kol: Kolet har stigit till drygt 63 dollar/ton. Idag är spreaden ännu högre men omsättningen har inte riktigt vaknat. Även kortare sidan har kommit upp. Stigande oljepriser påverkar förtås – kol och olja går nästan hand i hand i fråga om priser. Fortfarande har vi även på kolet en överproduktion, räknat på världens nuvarande behov.
Naturgas: Förra veckan annonserade man en neddragen gasproduktion i holländska Groningen. Detta till följd av rädsla hos befolkningen att utvinningen skulle orsaka jordskalv. Tydligen är oron mindre nu och priserna har återigen stabiliserat sig, även om det inte är några revolutionerande hopp. I Ukraina ser man positiva följder av den nyligen införda vapenvilan, vilket verkar som en dämpande faktor på priserna.
Elcertifikat
Nedåt igen! Denna gång riktigt ordentligt! Mars -15 stängde i fredags på 154 SEK. Övriga priser: Mars-16 156 SEK och Mars-17 160 SEK.
Valuta
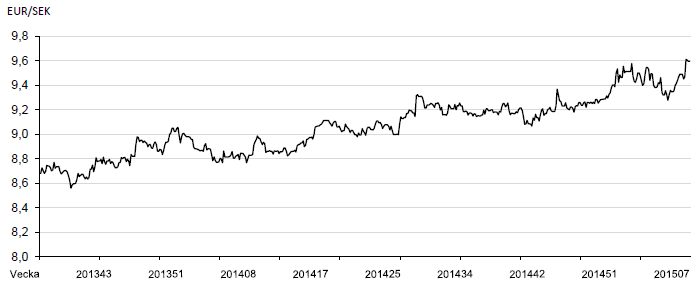
Valutakommentar
Riksbanken sänkte reporäntan till −0,10 procent förra veckan. De kommer att köpa statsobligationer för 10 miljarder och har beredskap att snabbt göra mer. Det finns tecken på att den underliggande inflationen har bottnat men omvärlden är nu mer osäker och det ökar risken för att inflationen inte stiger tillräckligt snabbt för att nå inflationsmålet på 2%. Just det målet är viktigt för pris- och lönebildningen. Kronan reagerade direkt med att försvagas till 9,68 mot euron för att nu handlas på 9,58. Vi ser en stor range mellan 9,30 – 9,70. Mot dollarn nådde vi 8,55 som högst. Vi har nu 11 månader bakom oss med högre bottnar och högre toppar.
Teknisk analys
Teknisk analys Q2-15
Q2 handlades mellan 24,55 och 25,55 €/MWh förra veckan. Just nu handlas den på 25,15, dvs i mitten av föregående veckas range. Vi har numera 6 veckor med fallande toppar på frontkvartalet och vi bedömer att sannolikheten att vi fortsätter ner är stor. Till skillnad från År-16 och kontinentala priser är Q2 det svagaste. Vänder de övriga ner så brukar den som visar mest svaghet innan falla hårdast när alla andra vänder nedåt. Handel över 25,55 innebär att nedåttrenden skulle vara bruten.
Teknisk analys År-16
År-16 handlades mellan 27,95 och 28,84€/MWh förra veckan. Vi har fortsatt en divergens mellan frontkvartalet och årskontraktet då fronten är på en säljsignal medan årskontraktet ger köpsignaler. Kontraktet är nu inne på andra veckan med högre bottnar men på tanke på att frontkvartalet ser ut att vilja handla lägre kallar vi inte det här för en köpsignal den här gången. Vår bedömning är att årskontraktet handlas i en range där toppen är 29,20. På nedsidan förhåller vi oss till 27,95 som utgör en dubbelbotten för År-16.
[box]Denna energimarknadskommentar om elpriset publiceras på Råvarumarknaden.se med tillstånd och i samarbete med Modity Energy Trading.[/box]
Ansvarsfriskrivning
Energimarknadskommentaren har producerats av Modity Energy Trading. Informationen är rapporterad i god tro och speglar de aktuella åsikterna hos medarbetarna, dessa kan ändras utan varsel. Modity Energy Trading tar inget ansvar för handlingar baserade på informationen.
Om Modity Energy Trading
Modity Energy Trading erbjuder energibolag och större företag den erfarenhet, kompetens och analysredskap som krävs för en trygg och effektiv förvaltning av energiportföljen. Modity bedriver handel med allt från el och gas, till elcertifikat, valutor och utsläppsrätter. Företagets kunder får dessutom ta del av deras analysprodukter som t.ex det fullständiga marknadsbrevet med ytterligare kommentarer och prognoser. För ytterligare information se hemsidan.


Some rebound but not much. Brent crude rebounded 1.5% yesterday to $65.47/b. This morning it is inching 0.2% up to $65.6/b. The lowest close last week was on Thursday at $64.11/b.

The curve structure is almost as week as it was before the weekend. The rebound we now have gotten post the message from OPEC+ over the weekend is to a large degree a rebound along the curve rather than much strengthening at the front-end of the curve. That part of the curve structure is almost as weak as it was last Thursday.
We are still on a weakening path. The message from OPEC+ over the weekend was we are still on a weakening path with rising supply from the group. It is just not as rapidly weakening as was feared ahead of the weekend when a quota hike of 500 kb/d/mth for November was discussed.
The Brent curve is on its way to full contango with Brent dipping into the $50ies/b. Thus the ongoing weakening we have had in the crude curve since the start of the year, and especially since early June, will continue until the Brent crude oil forward curve is in full contango along with visibly rising US and OECD oil inventories. The front-month Brent contract will then flip down towards the $60/b-line and below into the $50ies/b.
At what point will OPEC+ turn to cuts? The big question then becomes: When will OPEC+ turn around to make some cuts? At what (price) point will they choose to stabilize the market? Because for sure they will. Higher oil inventories, some more shedding of drilling rigs in US shale and Brent into the 50ies somewhere is probably where the group will step in.
There is nothing we have seen from the group so far which indicates that they will close their eyes, let the world drown in oil and the oil price crash to $40/b or below.
The message from OPEC+ is also about balance and stability. The world won’t drown in oil in 2026. The message from the group as far as we manage to interpret it is twofold: 1) Taking back market share which requires a lower price for non-OPEC+ to back off a bit, and 2) Oil market stability and balance. It is not just about 1. Thus fretting about how we are all going to drown in oil in 2026 is totally off the mark by just focusing on point 1.
When to buy cal 2026? Before Christmas when Brent hits $55/b and before OPEC+ holds its last meeting of the year which is likely to be in early December.
Brent crude oil prices have rebounded a bit along the forward curve. Not much strengthening in the structure of the curve. The front-end backwardation is not much stronger today than on its weakest level so far this year which was on Thursday last week.

The front-end backwardation fell to its weakest level so far this year on Thursday last week. A slight pickup yesterday and today, but still very close to the weakest year to date. More oil from OPEC+ in the coming months and softer demand and rising inventories. We are heading for yet softer levels.

Down to the lowest since early May. Brent crude has fallen sharply the latest four days. It closed at USD 64.11/b yesterday which is the lowest since early May. It is staging a 1.3% rebound this morning along with gains in both equities and industrial metals with an added touch of support from a softer USD on top.
What stands out the most to us this week is the collapse in the Dubai one to three months time-spread.
Dubai is medium sour crude. OPEC+ is in general medium sour crude production. Asian refineries are predominantly designed to process medium sour crude. So Dubai is the real measure of the balance between OPEC+ holding back or not versus Asian oil demand for consumption and stock building.
A sharp weakening of the front-end of the Dubai curve. The front-end of the Dubai crude curve has been holding out very solidly throughout this summer while the front-end of the Brent and WTI curves have been steadily softening. But the strength in the Dubai curve in our view was carrying the crude oil market in general. A source of strength in the crude oil market. The core of the strength.
The now finally sharp decline of the front-end of the Dubai crude curve is thus a strong shift. Weakness in the Dubai crude marker is weakness in the core of the oil market. The core which has helped to hold the oil market elevated.
Facts supports the weakening. Add in facts of Iraq lifting production from Kurdistan through Turkey. Saudi Arabia lifting production to 10 mb/d in September (normal production level) and lifting exports as well as domestic demand for oil for power for air con is fading along with summer heat. Add also in counter seasonal rise in US crude and product stocks last week. US oil stocks usually decline by 1.3 mb/week this time of year. Last week they instead rose 6.4 mb/week (+7.2 mb if including SPR). Total US commercial oil stocks are now only 2.1 mb below the 2015-19 seasonal average. US oil stocks normally decline from now to Christmas. If they instead continue to rise, then it will be strongly counter seasonal rise and will create a very strong bearish pressure on oil prices.
Will OPEC+ lift its voluntary quotas by zero, 137 kb/d, 500 kb/d or 1.5 mb/d? On Sunday of course OPEC+ will decide on how much to unwind of the remaining 1.5 mb/d of voluntary quotas for November. Will it be 137 kb/d yet again as for October? Will it be 500 kb/d as was talked about earlier this week? Or will it be a full unwind in one go of 1.5 mb/d? We think most likely now it will be at least 500 kb/d and possibly a full unwind. We discussed this in a not earlier this week: ”500 kb/d of voluntary quotas in October. But a full unwind of 1.5 mb/d”
The strength in the front-end of the Dubai curve held out through summer while Brent and WTI curve structures weakened steadily. That core strength helped to keep flat crude oil prices elevated close to the 70-line. Now also the Dubai curve has given in.

Brent crude oil forward curves

Total US commercial stocks now close to normal. Counter seasonal rise last week. Rest of year?

Total US crude and product stocks on a steady trend higher.

Analys
OPEC+ will likely unwind 500 kb/d of voluntary quotas in October. But a full unwind of 1.5 mb/d in one go could be in the cards
Down to mid-60ies as Iraq lifts production while Saudi may be tired of voluntary cut frugality. The Brent December contract dropped 1.6% yesterday to USD 66.03/b. This morning it is down another 0.3% to USD 65.8/b. The drop in the price came on the back of the combined news that Iraq has resumed 190 kb/d of production in Kurdistan with exports through Turkey while OPEC+ delegates send signals that the group will unwind the remaining 1.65 mb/d (less the 137 kb/d in October) of voluntary cuts at a pace of 500 kb/d per month pace.
Signals of accelerated unwind and Iraqi increase may be connected. Russia, Kazakhstan and Iraq were main offenders versus the voluntary quotas they had agreed to follow. Russia had a production ’debt’ (cumulative overproduction versus quota) of close to 90 mb in March this year while Kazakhstan had a ’debt’ of about 60 mb and the same for Iraq. This apparently made Saudi Arabia angry this spring. Why should Saudi Arabia hold back if the other voluntary cutters were just freeriding? Thus the sudden rapid unwinding of voluntary cuts. That is at least one angle of explanations for the accelerated unwinding.
If the offenders with production debts then refrained from lifting production as the voluntary cuts were rapidly unwinded, then they could ’pay back’ their ’debts’ as they would under-produce versus the new and steadily higher quotas.
Forget about Kazakhstan. Its production was just too far above the quotas with no hope that the country would hold back production due to cross-ownership of oil assets by international oil companies. But Russia and Iraq should be able to do it.
Iraqi cumulative overproduction versus quotas could reach 85-90 mb in October. Iraq has however steadily continued to overproduce by 3-5 mb per month. In July its new and gradually higher quota came close to equal with a cumulative overproduction of only 0.6 mb that month. In August again however its production had an overshoot of 100 kb/d or 3.1 mb for the month. Its cumulative production debt had then risen to close to 80 mb. We don’t know for September yet. But looking at October we now know that its production will likely average close to 4.5 mb/d due to the revival of 190 kb/d of production in Kurdistan. Its quota however will only be 4.24 mb/d. Its overproduction in October will thus likely be around 250 kb/d above its quota with its production debt rising another 7-8 mb to a total of close to 90 mb.
Again, why should Saudi Arabia be frugal while Iraq is freeriding. Better to get rid of the voluntary quotas as quickly as possible and then start all over with clean sheets.
Unwinding the remaining 1.513 mb/d in one go in October? If OPEC+ unwinds the remaining 1.513 mb/d of voluntary cuts in one big go in October, then Iraq’s quota will be around 4.4 mb/d for October versus its likely production of close to 4.5 mb/d for the coming month..
OPEC+ should thus unwind the remaining 1.513 mb/d (1.65 – 0.137 mb/d) in one go for October in order for the quota of Iraq to be able to keep track with Iraq’s actual production increase.
October 5 will show how it plays out. But a quota unwind of at least 500 kb/d for Oct seems likely. An overall increase of at least 500 kb/d in the voluntary quota for October looks likely. But it could be the whole 1.513 mb/d in one go. If the increase in the quota is ’only’ 500 kb/d then Iraqi cumulative production will still rise by 5.7 mb to a total of 85 mb in October.
Iraqi production debt versus quotas will likely rise by 5.7 mb in October if OPEC+ only lifts the overall quota by 500 kb/d in October. Here assuming historical production debt did not rise in September. That Iraq lifts its production by 190 kb/d in October to 4.47 mb/d (August level + 190 kb/d) and that OPEC+ unwinds 500 kb/d of the remining quotas in October when they decide on this on 5 October.


Brookfield köper bränsleceller för 5 miljarder USD av Bloom Energy för att driva AI-datacenter

Teck Resources kan förse Nordamerika och kanske hela G7 med all germanium som behövs

Leading Edge Materials är på rätt plats i rätt tid

Oljepriset faller efter ny handelskonflikt mellan USA och Kina

Christian Kopfer kommenterar guld, koppar, olja och stål, samt några råvarubolag

Kinas elproduktion slog nytt rekord i augusti, vilket även kolkraft gjorde

Tyskland har så höga elpriser att företag inte har råd att använda elektricitet

Det stigande guldpriset en utmaning för smyckesköpare

OPEC+ missar produktionsmål, stöder oljepriserna

Ett samtal om guld, olja, fjärrvärme och förnybar energi
-
 Nyheter4 veckor sedan
Kinas elproduktion slog nytt rekord i augusti, vilket även kolkraft gjorde
-
Nyheter4 veckor sedan
Tyskland har så höga elpriser att företag inte har råd att använda elektricitet
-
 Nyheter4 veckor sedan
Det stigande guldpriset en utmaning för smyckesköpare
-
 Nyheter2 veckor sedan
OPEC+ missar produktionsmål, stöder oljepriserna
-
 Nyheter3 veckor sedan
Ett samtal om guld, olja, fjärrvärme och förnybar energi
-
Analys4 veckor sedan
Brent crude ticks higher on tension, but market structure stays soft
-
Analys3 veckor sedan
Are Ukraine’s attacks on Russian energy infrastructure working?
-

 Nyheter2 veckor sedan
Guld nära 4000 USD och silver 50 USD, därför kan de fortsätta stiga