

Analys
The last hurrah from Vienna

![]() We see a close to 100% probability of an extension of oil production cuts from OPEC at the upcoming OPEC meeting in Vienna on May 25. For H2 2017, we see compliance with proposed cuts as a much more difficult issue than the deal itself. We think there is a 95% probability that Russia will sign on for a new six-month production cut period, but we see only a 30% probability that Russia will keep compliance for that period. Oil cuts during H2 2017 will come at a high cost due to seasonally higher production. We believe the next big price turn will come from non-compliance from Russia in particular but also other OPEC countries, as growing US production shows evidence of the futility of subsidising growth there by keeping production off stream. Saudi Arabia seems assured that production cuts at any price are the right way to go; it seems to us that the longer OPEC tries to keep production down, the more such measures backfire.
We see a close to 100% probability of an extension of oil production cuts from OPEC at the upcoming OPEC meeting in Vienna on May 25. For H2 2017, we see compliance with proposed cuts as a much more difficult issue than the deal itself. We think there is a 95% probability that Russia will sign on for a new six-month production cut period, but we see only a 30% probability that Russia will keep compliance for that period. Oil cuts during H2 2017 will come at a high cost due to seasonally higher production. We believe the next big price turn will come from non-compliance from Russia in particular but also other OPEC countries, as growing US production shows evidence of the futility of subsidising growth there by keeping production off stream. Saudi Arabia seems assured that production cuts at any price are the right way to go; it seems to us that the longer OPEC tries to keep production down, the more such measures backfire.
Core OPEC members give a good lead
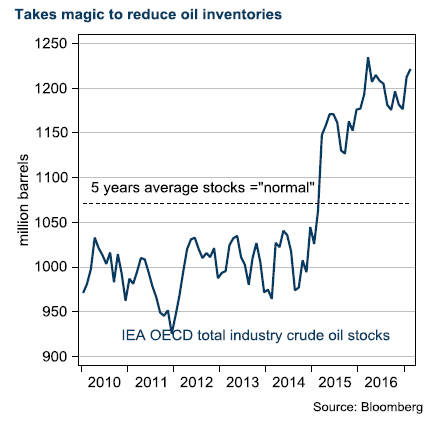 The OPEC and several other key producers including Russia have agreed to cut production by 1.8 million bbl/d for H1 2017 to reduce global glut, formally defined as retreating global stocks to normal levels, i.e. the five-year average. It is increasingly clear that the target will not be reached after the first six months of this year. Saudi Arabian oil minister Al-Falih opened up initially for an extension for H2 2017, and last week for nine months, including Q1 2018. Other core OPEC members have gradually confirmed the extension as well. We assume a Brent crude price of USD 50 fully reflects a six-month extension of OPEC production cuts.
Saudi Arabia supports extension
It has become obvious that Deputy Crown Prince Mohammed bin Salman, who has emerged as Saudi Arabia’s leading economic force, was the architect behind the Saudis’ policy U-turn in Doha, leading up to the cut at the official meeting in Vienna in November 2016. In our view, this was confirmed by the shuffle of the Kingdom’s oil minister, replacing Ali al-Naimi after two decades. If this were a game of chess, we would view this as a rokade.
Prince Mohammed has designated divesting Armaco at the top of his agenda, and that forms the basis of the Saudis’ policy and willingness to cut production in compensation for a short-term higher oil price.
Costly mistake
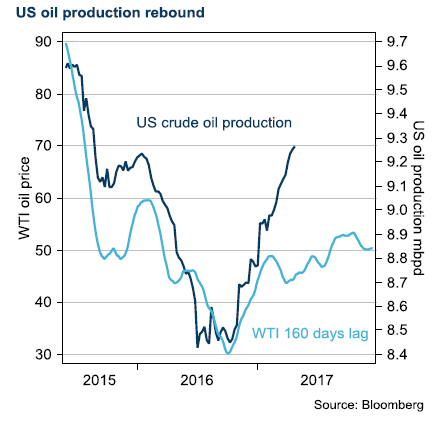 The savvy players recognise the danger of taking real action in cutting production. History is repeating itself. Higher prices have reversed the US production drop, extending the time it takes for the market to balance, and pushing the volume share away from OPEC and toward two non-cut participants, the US and lately also Libya.
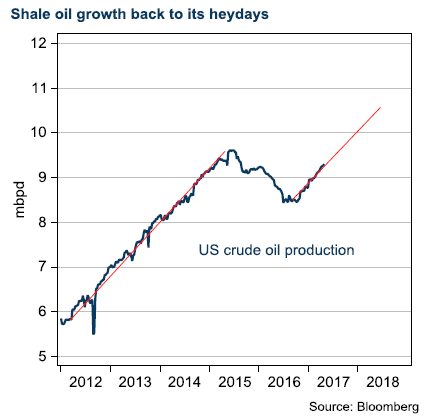
We strongly argue it was too early for OPEC to take action. The rebalancing process had another year, perhaps two, before running its course. If OPEC had waited, a number of bankruptcies in the US energy sector would have played out, and some banks would have lost their faith in energy lending for a long time. Instead, US shale oil is growing at the same rate as it did before the 2014 oil slump and production is now higher than in 2014, which was about the time that OPEC initiated its strategy aimed at knocking off higher costs by flooding the market. Costs are dynamic, however, and the low-price era has pushed breakeven levels lower and provided a solid platform for future growth.
 Russia: biggest loser in extension deal
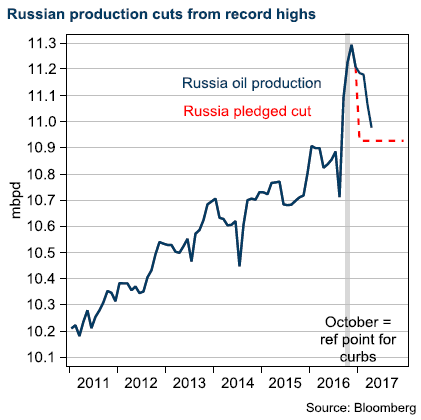
We base our strong opinion of a low 30% chance of an implemented cut during the second half on Russia’s seasonal oil production pattern. Russia has shown its usual low interest in active cuts, and takes its cut from a very high October 2016 production as a reference point for the curbs. Russia has cut about 250,000 bbl/d from its pledge of a 300,000 bbl/d cut, but production is still 1.6% higher than in 2016 and export are 2.14% higher than in March 2016. The first quarter is seasonally weak in Russian crude production, while the second half is stronger, and cuts in the seasonal peak require a strong commitment. We doubt that Russia will turn down additional market share for the sake of Saudi Arabia’s Aramco divestment.
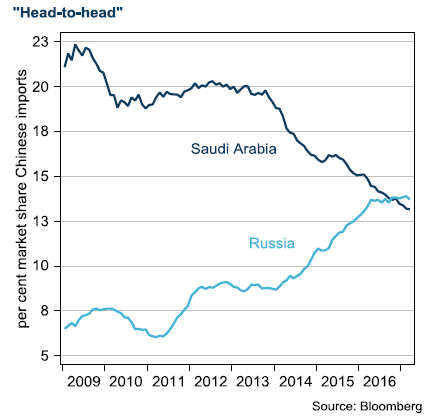
Russia has another reason to be careful in long-term cooperation with the Saudis. Russia has been successful in grabbing market share in China, the only oil consumer growing at any significant pace. This is not the right time to give up footprint anywhere, as competition will increase in all markets ahead.
“Everything is fine”
With little chance of action from Vienna on May 25, we think eroding compliance will set the tone after the May meeting. The oil price will likely hover at around USD 40/bbl when the agreement on production cuts vanishes, and an extension of production cuts will not come into question at the second OPEC meeting this year in November-December.
Research disclaimer
Risk warning
All investments involve risks and investors are encouraged to make their own decision as to the appropriateness of an investment in any securities referred to in this report, based on their specific investment objectives, financial status and risk tolerance. The historical return of a financial instrument is not a guarantee of future return. The value of financial instruments can rise or fall, and it is not certain that you will get back all the capital you have invested.
Research disclaimers
Handelsbanken Capital Markets, a division of Svenska Handelsbanken AB (publ) (collectively referred to herein as ‘SHB’), is responsible for the preparation of research reports. SHB is regulated in Sweden by the Swedish Financial Supervisory Authority, in Norway by the Financial Supervisory Authority of Norway, in Finland by the Financial Supervisory Authority and in Denmark by the Danish Financial Supervisory Authority. All research reports are prepared from trade and statistical services and other information that SHB considers to be reliable. SHB has not independently verified such information and does not represent that such information is true, accurate or complete. Accordingly, to the extent permitted by law, neither SHB, nor any of its directors, officers or employees, nor any other person, accept any liability whatsoever for any loss, however it arises, from any use of such research reports or its contents or otherwise arising in connection therewith.
In no event will SHB or any of its affiliates, their officers, directors or employees be liable to any person for any direct, indirect, special or consequential damages arising out of any use of the information contained in the research reports, including without limitation any lost profits even if SHB is expressly advised of the possibility or likelihood of such damages.
The views contained in SHB research reports are the opinions of employees of SHB and its affiliates and accurately reflect the personal views of the respective analysts at this date and are subject to change. There can be no assurance that future events will be consistent with any such opinions. Each analyst identified in this research report also certifies that the opinions expressed herein and attributed to such analyst accurately reflect his or her individual views about the companies or securities discussed in the research report.
Research reports are prepared by SHB for information purposes only. The information in the research reports does not constitute a personal recommendation or personalised investment advice and such reports or opinions should not be the basis for making investment or strategic decisions. This document does not constitute or form part of any offer for sale or subscription of or solicitation of any offer to buy or subscribe for any securities nor shall it or any part of it form the basis of or be relied on in connection with any contract or commitment whatsoever. Past performance may not be repeated and should not be seen as an indication of future performance. The value of investments and the income from them may go down as well as up and investors may forfeit all principal originally invested. Investors are not guaranteed to make profits on investments and may lose money. Exchange rates may cause the value of overseas investments and the income arising from them to rise or fall. This research product will be updated on a regular basis.
No part of SHB research reports may be reproduced or distributed to any other person without the prior written consent of SHB. The distribution of this document in certain jurisdictions may be restricted by law and persons into whose possession this document comes should inform themselves about, and observe, any such restrictions.
The report does not cover any legal or tax-related aspects pertaining to any of the issuer’s planned or existing debt issuances.

Analys
OPEC+ will likely unwind 500 kb/d of voluntary quotas in October. But a full unwind of 1.5 mb/d in one go could be in the cards

Down to mid-60ies as Iraq lifts production while Saudi may be tired of voluntary cut frugality. The Brent December contract dropped 1.6% yesterday to USD 66.03/b. This morning it is down another 0.3% to USD 65.8/b. The drop in the price came on the back of the combined news that Iraq has resumed 190 kb/d of production in Kurdistan with exports through Turkey while OPEC+ delegates send signals that the group will unwind the remaining 1.65 mb/d (less the 137 kb/d in October) of voluntary cuts at a pace of 500 kb/d per month pace.

Signals of accelerated unwind and Iraqi increase may be connected. Russia, Kazakhstan and Iraq were main offenders versus the voluntary quotas they had agreed to follow. Russia had a production ’debt’ (cumulative overproduction versus quota) of close to 90 mb in March this year while Kazakhstan had a ’debt’ of about 60 mb and the same for Iraq. This apparently made Saudi Arabia angry this spring. Why should Saudi Arabia hold back if the other voluntary cutters were just freeriding? Thus the sudden rapid unwinding of voluntary cuts. That is at least one angle of explanations for the accelerated unwinding.
If the offenders with production debts then refrained from lifting production as the voluntary cuts were rapidly unwinded, then they could ’pay back’ their ’debts’ as they would under-produce versus the new and steadily higher quotas.
Forget about Kazakhstan. Its production was just too far above the quotas with no hope that the country would hold back production due to cross-ownership of oil assets by international oil companies. But Russia and Iraq should be able to do it.
Iraqi cumulative overproduction versus quotas could reach 85-90 mb in October. Iraq has however steadily continued to overproduce by 3-5 mb per month. In July its new and gradually higher quota came close to equal with a cumulative overproduction of only 0.6 mb that month. In August again however its production had an overshoot of 100 kb/d or 3.1 mb for the month. Its cumulative production debt had then risen to close to 80 mb. We don’t know for September yet. But looking at October we now know that its production will likely average close to 4.5 mb/d due to the revival of 190 kb/d of production in Kurdistan. Its quota however will only be 4.24 mb/d. Its overproduction in October will thus likely be around 250 kb/d above its quota with its production debt rising another 7-8 mb to a total of close to 90 mb.
Again, why should Saudi Arabia be frugal while Iraq is freeriding. Better to get rid of the voluntary quotas as quickly as possible and then start all over with clean sheets.
Unwinding the remaining 1.513 mb/d in one go in October? If OPEC+ unwinds the remaining 1.513 mb/d of voluntary cuts in one big go in October, then Iraq’s quota will be around 4.4 mb/d for October versus its likely production of close to 4.5 mb/d for the coming month..
OPEC+ should thus unwind the remaining 1.513 mb/d (1.65 – 0.137 mb/d) in one go for October in order for the quota of Iraq to be able to keep track with Iraq’s actual production increase.
October 5 will show how it plays out. But a quota unwind of at least 500 kb/d for Oct seems likely. An overall increase of at least 500 kb/d in the voluntary quota for October looks likely. But it could be the whole 1.513 mb/d in one go. If the increase in the quota is ’only’ 500 kb/d then Iraqi cumulative production will still rise by 5.7 mb to a total of 85 mb in October.
Iraqi production debt versus quotas will likely rise by 5.7 mb in October if OPEC+ only lifts the overall quota by 500 kb/d in October. Here assuming historical production debt did not rise in September. That Iraq lifts its production by 190 kb/d in October to 4.47 mb/d (August level + 190 kb/d) and that OPEC+ unwinds 500 kb/d of the remining quotas in October when they decide on this on 5 October.

U.S. commercial crude inventories posted a marginal draw last week, falling by 0.6 million barrels to 414.8 million barrels. Inventories remain 4% below the five-year seasonal average, but the draw is far smaller than last week’s massive 9.3-million-barrel decline. Higher crude imports (+803,000 bl d WoW) and steady refinery runs (93% utilization) helped keep the crude balance relatively neutral.

Yet another drawdown indicates commercial crude inventories continue to trend below the 2015–2022 seasonal norm (~440 million barrels), though at 414.8 million barrels, levels are now almost exactly in line with both the 2023 and 2024 trajectory, suggesting stable YoY conditions (see page 3 attached).
Gasoline inventories dropped by 1.1 million barrels and are now 2% below the five-year average. The decline was broad-based, with both finished gasoline and blending components falling, indicating lower output and resilient end-user demand as we enter the shoulder season post-summer (see page 6 attached).
On the diesel side, distillate inventories declined by 1.7 million barrels, snapping a two-week streak of strong builds. At 125 million barrels, diesel inventories are once again 8% below the five-year average and trending near the low end of the historical range.
In total, commercial petroleum inventories (excl. SPR) slipped by 0.5 million barrels on the week to ish 1,281.5 million barrels. While essentially flat, this ends a two-week streak of meaningful builds, reflecting a return to a slightly tighter situation.
On the demand side, the DOE’s ‘products supplied’ metric (see page 6 attached), a proxy for implied consumption, softened slightly. Total demand for crude oil over the past four weeks averaged 20.5 million barrels per day, up just 0.9% YoY.
Summing up: This week’s report shows a re-tightening in diesel supply and modest draws across the board, while demand growth is beginning to flatten. Inventories remain structurally low, but the tone is less bullish than in recent weeks.


Brent crude rose 1.6% yesterday. After trading in a range of USD 66.1 – 68.09/b it settled at USD 67.63/b. A level which we are well accustomed to see Brent crude flipping around since late August. This morning it is trading 0.5% higher at USD 68/b. The market was expecting an increase of 230 kb/d in Iraqi crude exports from Kurdistan through Turkey to the Cheyhan port but that has so far failed to materialize. This probably helped to drive Brent crude higher yesterday. Indications last evening that US crude oil inventories likely fell 3.8 mb last week (indicative numbers by API) probably also added some strength to Brent crude late in the session. The market continues to await the much heralded global surplus materializing as rising crude and product inventories in OECD countries in general and the US specifically.
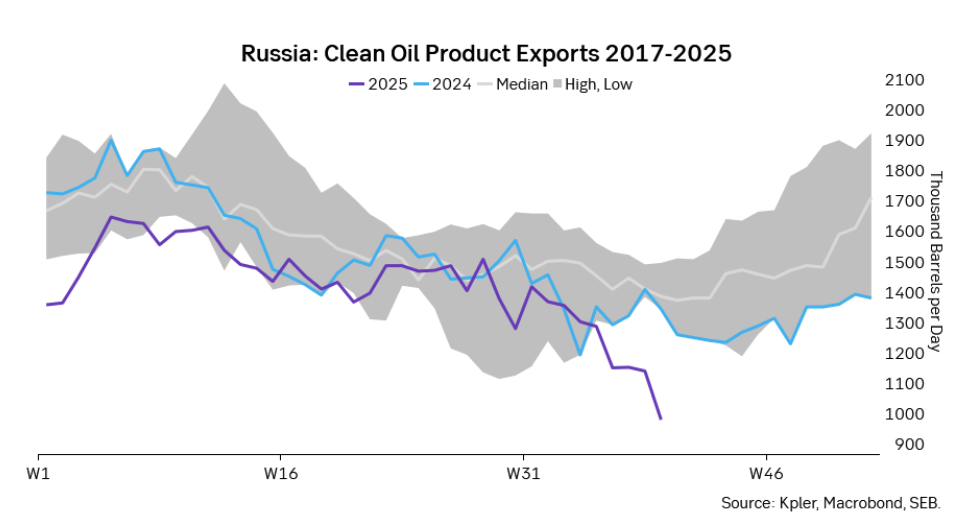
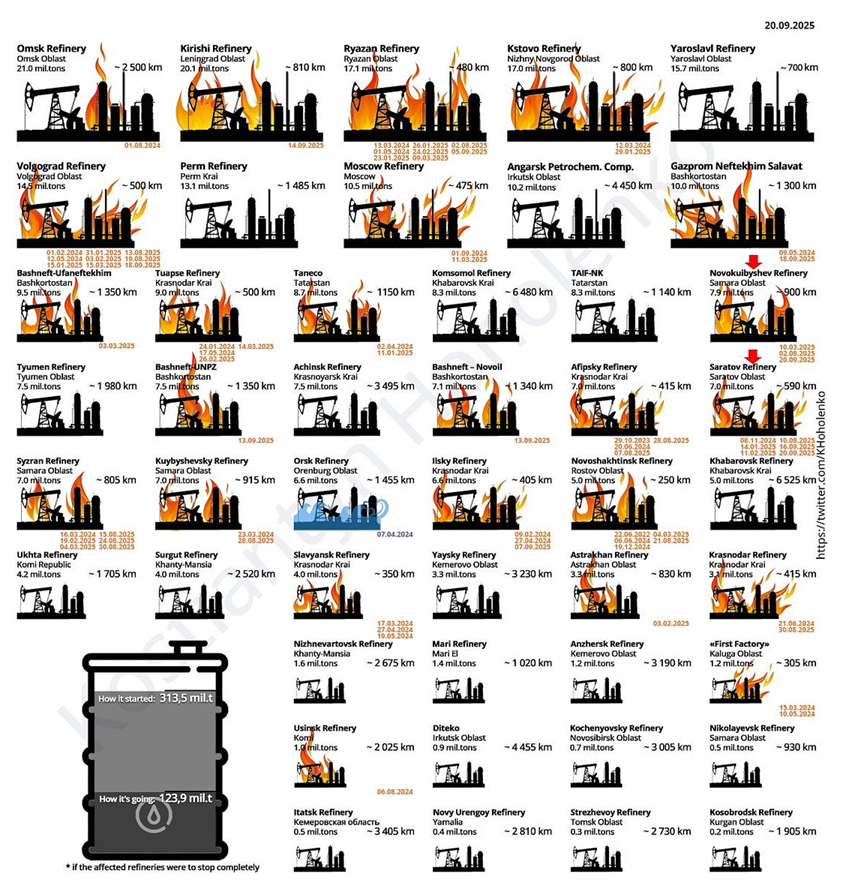
The oil market is starting to focus increasingly on the successful Ukrainian attacks on Russian oil infrastructure. Especially the attacks on Russian refineries. Refineries are highly complex and much harder to repair than simple crude oil facilities like export pipelines, ports and hubs. It can take months and months to repair complex refineries. It is thus mainly Russian oil products which will be hurt by this. First oil product exports will go down, thereafter Russia will have to ration oil product consumption domestically. Russian crude exports may not be hurt as much. Its crude exports could actually go up as its capacity to process crude goes down. SEB’s Emerging Market strategist Erik Meyersson wrote about the Ukrainian campaign this morning: ”Are Ukraine’s attacks on Russian energy infrastructure working?”. Phillips P O’Brian published an interesting not on this as well yesterday: ”An Update On The Ukrainian Campaign Against Russian Refineries”. It is a pay-for article, but it is well worth reading. Amongst other things it highlights the strategic focus of Ukraine towards Russia’s energy infrastructure. A Ukrainian on the matter also put out a visual representation of the attacks on twitter. We have not verified the data representation. It needs to be interpreted with caution in terms of magnitude of impact and current outage.
Complex Russian oil refineries are sitting ducks in the new, modern long-range drone war. Ukraine is building a range of new weapons as well according to O’Brian. The problem with attacks on Russian refineries is thus on the rise. This will likely be an escalating problem for Russia. And oil products around the world may rise versus the crude oil price while the crude oil price itself may not rise all that much due to this.
Russian clean oil product exports as presented by SEB’s Erik Meyersson in his note this morning.
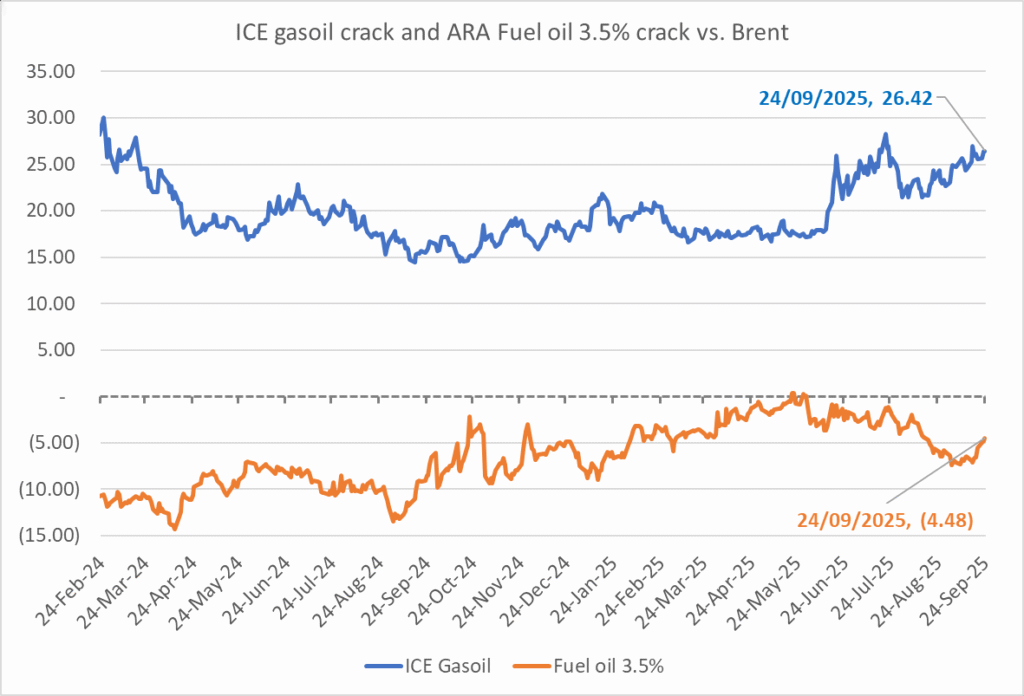
The ICE Gasoil crack and the 3.5% fuel oil crack has been strengthening. The 3.5% crack should have weakened along with rising exports of sour crude from OPEC+, but it hasn’t. Rather it has moved higher instead. The higher cracks could in part be due to the Ukrainian attacks on Russian oil refineries.
Ukrainian inhabitants graphical representation of Ukrainian attacks on Russian oil refineries on Twitter. Highlighting date of attacks, size of refineries and distance from Ukraine. We have not verified the detailed information. And you cannot derive the amount of outage as a consequence of this.

OPEC+ will likely unwind 500 kb/d of voluntary quotas in October. But a full unwind of 1.5 mb/d in one go could be in the cards

Blykalla och amerikanska Oklo inleder ett samarbete

Fortsatt stabilt elpris – men dubbelt så dyrt som i fjol

Ett samtal om guld, olja, koppar och stål

Mixat oktoberväder påverkar elpriset

Eurobattery Minerals satsar på kritiska metaller för Europas självförsörjning

Mahvie Minerals i en guldtrend

Guldpriset kan närma sig 5000 USD om centralbankens oberoende skadas

OPEC signalerar att de inte bryr sig om oljepriset faller kommande månader

Aktier i guldbolag laggar priset på guld
-
 Nyheter4 veckor sedan
Eurobattery Minerals satsar på kritiska metaller för Europas självförsörjning
-
 Nyheter3 veckor sedan
Mahvie Minerals i en guldtrend
-
 Nyheter4 veckor sedan
Guldpriset kan närma sig 5000 USD om centralbankens oberoende skadas
-
 Nyheter4 veckor sedan
OPEC signalerar att de inte bryr sig om oljepriset faller kommande månader
-
 Nyheter3 veckor sedan
Aktier i guldbolag laggar priset på guld
-
Analys3 veckor sedan
Volatile but going nowhere. Brent crude circles USD 66 as market weighs surplus vs risk
-

 Nyheter2 veckor sedan
Kinas elproduktion slog nytt rekord i augusti, vilket även kolkraft gjorde
-
 Nyheter2 veckor sedan
Tyskland har så höga elpriser att företag inte har råd att använda elektricitet