

Analys
Gold outlook: flat for the year

 Summary
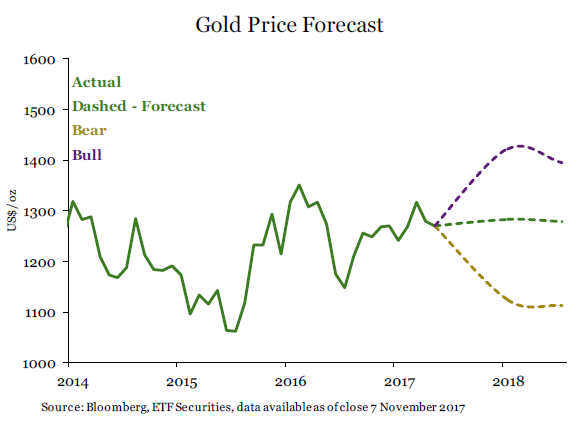
Our base-case fair-value for gold is broadly flat over the coming year, as support from rising inflation will counter the downward pressure from rising interest rates.
Despite policy interest rates rising in 2017, the US Dollar has depreciated and US Treasury yields have declined. We expect these paradoxical trends to abate in 2018.
 Most of the variation in gold price in our bull and bear cases (compared to our base case) comes from assumptions around investor positioning. Many measures of market volatility are currently subdued. However, several risks – both political and financial – exist. Sentiment towards gold could shift significantly depending on which of these views dominate market psyche.
US Federal Reserve to continue tightening
We believe that in addition to the fully-priced-in December 2017 hike, the US central bank will follow through with three further rate hikes in 2018. That comes on top of the balancesheet run-off that the Fed has already announced. Although some market participants think that under a new Chair, the Fed will become more dovish, we believe the central bank will remain data-dependent and trained staff economists’ analysis will become more influential in the Board’s decision making. In light of strengthening domestic demand and a tight labour market, the inflationary potential will be hard to ignore.
Inflation to gain momentum
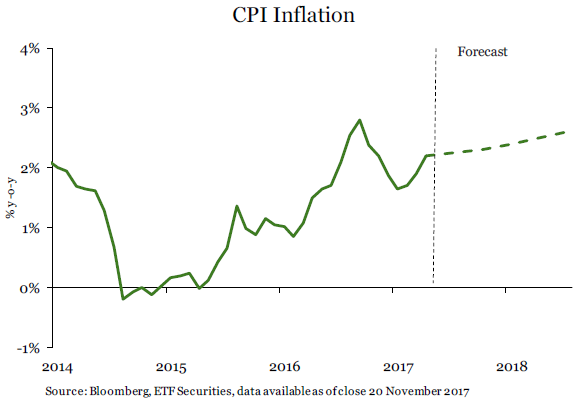 Inflation has been subdued in 2017, despite so many signs of cyclical strength, but a large number of idiosyncratic factors account for this apparent weakness in price movements. Dominant wireless phone service providers changing pricing; solar eclipse changing the timing of hotel stays; severe hurricane disruptions; budget airlines opening new routes are some of the idiosyncratic factors that are unlikely to be repeated. Also the calculation of owner occupied equivalent rent has caused some distortions in the inflation numbers as it is sensitive to energy prices. With volatility in energy prices having fallen, we expect these distortions to subside. The unemployment rate is at its lowest in 16 years and a healthy number of jobs are being added every month (notwithstanding hurricane disruptions). The strength in the labour market is now likely to show up in inflation as per its traditional relationship2.
We expect US inflation to rise to 2.4% in June 2018 and 2.6% by December 2018 (from 2.2% in September 2017). These levels will likely be uncomfortably high for the Fed, but given the lags in policy and price response, there is little the Fed can do next year to stop it (the inflationary pressure has been built up this year). However, we believe three rate hikes in 2018 will be required to keep inflation expectations sufficiently anchored.
US Treasury yields
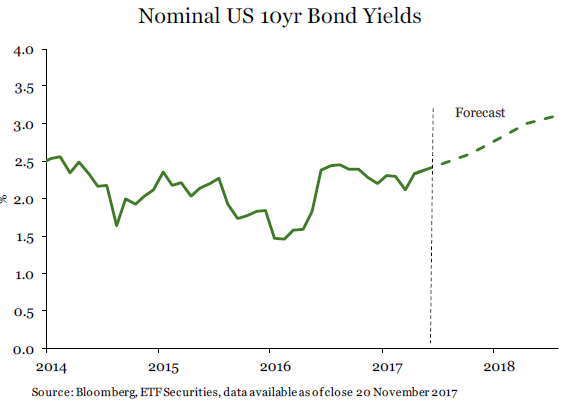 During the rate tightening that has taken place in 2017, the US Treasury yield curve has flattened. While there have been 75bps of policy rate increases since December 2016, nominal 10-year Treasury yields have fallen from 2.60% to 2.34%. We don’t think that 10-year yields can continue to decline. We expect 10- year Treasury yields to rise to 3.1% by the end of 2018.
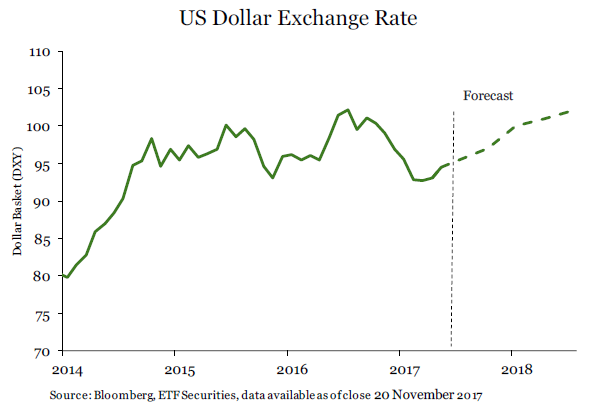
We expect the US Dollar to appreciate modestly (see FX Outlook 2018), reversing some of the weakness that we have seen in 2017. We expect the DXY (the trade weighted US dollar index) to appreciate to 102 by the end of 2018 from 94 currently. A lack of progress in implementing pro-growth policies that the Trump Administration had promised, a lack of tax and budget reform and a generally stronger Euro and Yen have weighed on the US Dollar in 2017. Some of these trends will continue to drag on dollar performance in 2018, but rising interest rates will lend some support. We believe that the policy divergence between the Federal Reserve, European Central Bank and Bank of Japan will become more pronounced as the market becomes increasingly disappointed by the pace of tapering by the latter two central banks. That will reverse some of the strength in the Euro and Yen.
Market sentiment
 We expect CFTC futures market positioning in gold to hover around 120k contracts net long, lower than current positioning (190k), but marginally higher than the long-term average positioning of around 90k contracts net long. Currently positioning is elevated due to investor fears around continued sabre-rattling between US/Japan and North Korea and some of the tensions in the Middle East. These concerns could fall away if new developments on these geopolitical issues do not resurface. We have observed that when such geopolitical issues simmer in the background, political risk-premia tends to dissipate from the price of gold. It requires keeping the issues at the forefront of market psyche for the premia to endure.
Bull case
Our bull case for gold assumes only two rate hikes in 2018. As a result the DXY only rises to 99 and treasury yields only rise to 2.8%. We assume that inflation rises to 3%.
We raise the investor positioning in gold to 200k contracts net long for the whole forecast horizon. This is one of the main drivers of higher gold prices in this scenario compared to the base case. There are numerous risks which can push demand for gold futures higher:
- Continued sabre-rattling between US/Japan/South Korea and North Korea; • The proxy war between Saudi Arabia and Iran escalates;
- A disorderly unwind of credit in China;
- Italian policy paralysed by the inability to form a government after the election;
- Catalonian independence pushing Spain close to civil war
- A potential second general election in Germany; and
- Market volatility measures such as the VIX (equity), MOVE (bond) spike as yield-trades unwind
In the bull case scenario, gold will rise to US$1420/oz by the middle of the year, and ease to just below US$1400/oz by the end of 2018.
Bear case
In our bear case, we assume the Fed delivers four rates hikes in 2018 as it tries to anchor inflation expectations. 10-year nominal Treasury yields rise to 3.3% by the end of the year, while the DXY appreciates to 105. By year-end inflation falls back to 1.6%. In this scenario we assume that the absence of any geopolitical risk premia or adverse financial market shock and so speculative positioning falls to 40k contracts net long. In the bear case scenario gold falls to US$1110/oz by end of 2018.


Some rebound but not much. Brent crude rebounded 1.5% yesterday to $65.47/b. This morning it is inching 0.2% up to $65.6/b. The lowest close last week was on Thursday at $64.11/b.

The curve structure is almost as week as it was before the weekend. The rebound we now have gotten post the message from OPEC+ over the weekend is to a large degree a rebound along the curve rather than much strengthening at the front-end of the curve. That part of the curve structure is almost as weak as it was last Thursday.
We are still on a weakening path. The message from OPEC+ over the weekend was we are still on a weakening path with rising supply from the group. It is just not as rapidly weakening as was feared ahead of the weekend when a quota hike of 500 kb/d/mth for November was discussed.
The Brent curve is on its way to full contango with Brent dipping into the $50ies/b. Thus the ongoing weakening we have had in the crude curve since the start of the year, and especially since early June, will continue until the Brent crude oil forward curve is in full contango along with visibly rising US and OECD oil inventories. The front-month Brent contract will then flip down towards the $60/b-line and below into the $50ies/b.
At what point will OPEC+ turn to cuts? The big question then becomes: When will OPEC+ turn around to make some cuts? At what (price) point will they choose to stabilize the market? Because for sure they will. Higher oil inventories, some more shedding of drilling rigs in US shale and Brent into the 50ies somewhere is probably where the group will step in.
There is nothing we have seen from the group so far which indicates that they will close their eyes, let the world drown in oil and the oil price crash to $40/b or below.
The message from OPEC+ is also about balance and stability. The world won’t drown in oil in 2026. The message from the group as far as we manage to interpret it is twofold: 1) Taking back market share which requires a lower price for non-OPEC+ to back off a bit, and 2) Oil market stability and balance. It is not just about 1. Thus fretting about how we are all going to drown in oil in 2026 is totally off the mark by just focusing on point 1.
When to buy cal 2026? Before Christmas when Brent hits $55/b and before OPEC+ holds its last meeting of the year which is likely to be in early December.
Brent crude oil prices have rebounded a bit along the forward curve. Not much strengthening in the structure of the curve. The front-end backwardation is not much stronger today than on its weakest level so far this year which was on Thursday last week.

The front-end backwardation fell to its weakest level so far this year on Thursday last week. A slight pickup yesterday and today, but still very close to the weakest year to date. More oil from OPEC+ in the coming months and softer demand and rising inventories. We are heading for yet softer levels.

Down to the lowest since early May. Brent crude has fallen sharply the latest four days. It closed at USD 64.11/b yesterday which is the lowest since early May. It is staging a 1.3% rebound this morning along with gains in both equities and industrial metals with an added touch of support from a softer USD on top.
What stands out the most to us this week is the collapse in the Dubai one to three months time-spread.
Dubai is medium sour crude. OPEC+ is in general medium sour crude production. Asian refineries are predominantly designed to process medium sour crude. So Dubai is the real measure of the balance between OPEC+ holding back or not versus Asian oil demand for consumption and stock building.
A sharp weakening of the front-end of the Dubai curve. The front-end of the Dubai crude curve has been holding out very solidly throughout this summer while the front-end of the Brent and WTI curves have been steadily softening. But the strength in the Dubai curve in our view was carrying the crude oil market in general. A source of strength in the crude oil market. The core of the strength.
The now finally sharp decline of the front-end of the Dubai crude curve is thus a strong shift. Weakness in the Dubai crude marker is weakness in the core of the oil market. The core which has helped to hold the oil market elevated.
Facts supports the weakening. Add in facts of Iraq lifting production from Kurdistan through Turkey. Saudi Arabia lifting production to 10 mb/d in September (normal production level) and lifting exports as well as domestic demand for oil for power for air con is fading along with summer heat. Add also in counter seasonal rise in US crude and product stocks last week. US oil stocks usually decline by 1.3 mb/week this time of year. Last week they instead rose 6.4 mb/week (+7.2 mb if including SPR). Total US commercial oil stocks are now only 2.1 mb below the 2015-19 seasonal average. US oil stocks normally decline from now to Christmas. If they instead continue to rise, then it will be strongly counter seasonal rise and will create a very strong bearish pressure on oil prices.
Will OPEC+ lift its voluntary quotas by zero, 137 kb/d, 500 kb/d or 1.5 mb/d? On Sunday of course OPEC+ will decide on how much to unwind of the remaining 1.5 mb/d of voluntary quotas for November. Will it be 137 kb/d yet again as for October? Will it be 500 kb/d as was talked about earlier this week? Or will it be a full unwind in one go of 1.5 mb/d? We think most likely now it will be at least 500 kb/d and possibly a full unwind. We discussed this in a not earlier this week: ”500 kb/d of voluntary quotas in October. But a full unwind of 1.5 mb/d”
The strength in the front-end of the Dubai curve held out through summer while Brent and WTI curve structures weakened steadily. That core strength helped to keep flat crude oil prices elevated close to the 70-line. Now also the Dubai curve has given in.

Brent crude oil forward curves

Total US commercial stocks now close to normal. Counter seasonal rise last week. Rest of year?

Total US crude and product stocks on a steady trend higher.

Analys
OPEC+ will likely unwind 500 kb/d of voluntary quotas in October. But a full unwind of 1.5 mb/d in one go could be in the cards
Down to mid-60ies as Iraq lifts production while Saudi may be tired of voluntary cut frugality. The Brent December contract dropped 1.6% yesterday to USD 66.03/b. This morning it is down another 0.3% to USD 65.8/b. The drop in the price came on the back of the combined news that Iraq has resumed 190 kb/d of production in Kurdistan with exports through Turkey while OPEC+ delegates send signals that the group will unwind the remaining 1.65 mb/d (less the 137 kb/d in October) of voluntary cuts at a pace of 500 kb/d per month pace.
Signals of accelerated unwind and Iraqi increase may be connected. Russia, Kazakhstan and Iraq were main offenders versus the voluntary quotas they had agreed to follow. Russia had a production ’debt’ (cumulative overproduction versus quota) of close to 90 mb in March this year while Kazakhstan had a ’debt’ of about 60 mb and the same for Iraq. This apparently made Saudi Arabia angry this spring. Why should Saudi Arabia hold back if the other voluntary cutters were just freeriding? Thus the sudden rapid unwinding of voluntary cuts. That is at least one angle of explanations for the accelerated unwinding.
If the offenders with production debts then refrained from lifting production as the voluntary cuts were rapidly unwinded, then they could ’pay back’ their ’debts’ as they would under-produce versus the new and steadily higher quotas.
Forget about Kazakhstan. Its production was just too far above the quotas with no hope that the country would hold back production due to cross-ownership of oil assets by international oil companies. But Russia and Iraq should be able to do it.
Iraqi cumulative overproduction versus quotas could reach 85-90 mb in October. Iraq has however steadily continued to overproduce by 3-5 mb per month. In July its new and gradually higher quota came close to equal with a cumulative overproduction of only 0.6 mb that month. In August again however its production had an overshoot of 100 kb/d or 3.1 mb for the month. Its cumulative production debt had then risen to close to 80 mb. We don’t know for September yet. But looking at October we now know that its production will likely average close to 4.5 mb/d due to the revival of 190 kb/d of production in Kurdistan. Its quota however will only be 4.24 mb/d. Its overproduction in October will thus likely be around 250 kb/d above its quota with its production debt rising another 7-8 mb to a total of close to 90 mb.
Again, why should Saudi Arabia be frugal while Iraq is freeriding. Better to get rid of the voluntary quotas as quickly as possible and then start all over with clean sheets.
Unwinding the remaining 1.513 mb/d in one go in October? If OPEC+ unwinds the remaining 1.513 mb/d of voluntary cuts in one big go in October, then Iraq’s quota will be around 4.4 mb/d for October versus its likely production of close to 4.5 mb/d for the coming month..
OPEC+ should thus unwind the remaining 1.513 mb/d (1.65 – 0.137 mb/d) in one go for October in order for the quota of Iraq to be able to keep track with Iraq’s actual production increase.
October 5 will show how it plays out. But a quota unwind of at least 500 kb/d for Oct seems likely. An overall increase of at least 500 kb/d in the voluntary quota for October looks likely. But it could be the whole 1.513 mb/d in one go. If the increase in the quota is ’only’ 500 kb/d then Iraqi cumulative production will still rise by 5.7 mb to a total of 85 mb in October.
Iraqi production debt versus quotas will likely rise by 5.7 mb in October if OPEC+ only lifts the overall quota by 500 kb/d in October. Here assuming historical production debt did not rise in September. That Iraq lifts its production by 190 kb/d in October to 4.47 mb/d (August level + 190 kb/d) and that OPEC+ unwinds 500 kb/d of the remining quotas in October when they decide on this on 5 October.


Oljepriset faller efter ny handelskonflikt mellan USA och Kina

Christian Kopfer kommenterar guld, koppar, olja och stål, samt några råvarubolag

Silver spränger den magiska gränsen, kostar nu över 50 USD per uns

Blykalla, Evroc och Studsvik vill bygga kärnkraftsdrivna datacenter i Sverige

Toppmöte om framtidens kärnkraft runt Östersjön hölls idag

Mahvie Minerals i en guldtrend
Volatile but going nowhere. Brent crude circles USD 66 as market weighs surplus vs risk

Aktier i guldbolag laggar priset på guld

Kinas elproduktion slog nytt rekord i augusti, vilket även kolkraft gjorde

Tyskland har så höga elpriser att företag inte har råd att använda elektricitet
-
 Nyheter4 veckor sedan
Mahvie Minerals i en guldtrend
-
Analys4 veckor sedan
Volatile but going nowhere. Brent crude circles USD 66 as market weighs surplus vs risk
-
 Nyheter4 veckor sedan
Aktier i guldbolag laggar priset på guld
-
 Nyheter4 veckor sedan
Kinas elproduktion slog nytt rekord i augusti, vilket även kolkraft gjorde
-
Nyheter4 veckor sedan
Tyskland har så höga elpriser att företag inte har råd att använda elektricitet
-

 Nyheter4 veckor sedan
Guld når sin högsta nivå någonsin, nu även justerat för inflation
-

 Nyheter4 veckor sedan
Det stigande guldpriset en utmaning för smyckesköpare
-
Analys4 veckor sedan
Brent crude ticks higher on tension, but market structure stays soft