

Analys
Defensive Assets: Gold, a precious ally in the fight against equity drawdown


In the previous instalments of this blog series, we highlighted the defensive behaviour of quality and high dividend equities, long duration government bonds and safe haven currencies as an asset, as well as an overlay to other asset classes. The last few weeks really put investors’ portfolio to the test and the least we can say is that those defensive assets did very well. While Global Equities (MSCI World net TR) lost 17.91% from the most recent tops on 12th February up to 9th March, Long Duration Treasuries (proxied by the Bloomberg Barclays US Treasury 10+) have return an incredible +21.99%. In the same period, Japanese Yen was up 7.54% versus the US Dollar and Quality stocks (proxied by the WisdomTree Global Quality Dividend Growth net TR) did cushion the fall, losing 15.73% and therefore outperforming the market by 2.27%1.
This week, our journey takes us to a fourth asset class, Commodities. Using our defensive framework, we will assess how single commodities or commodity sectors react to equity downturn. In particular, we will highlight how:
- precious metals such as Gold can bring potential diversification and defensiveness to a portfolio as well as act as inflation hedge on the upside. Gold was up 6.96% from 12th February to 9th March 2020;
- Broad commodities could act as a diversifier in a multi asset portfolio.
In the following, we analyse traditional Commodity benchmarks that use front month futures to invest in the different commodities in the universe (being commodities in general or sectors). The only exception are precious metals, were physical investments are considered (physical bullions in vaults for Gold for example). Enhanced commodities are meant to represent “smart beta” in commodities where the strategy can invest further along the curve (i.e. not always in the front month future) to improve the roll yield available to the investor while delivering similar spot and collateral returns. More information on this topic is available on our website. Those strategies have historically delivered strong outperformance over time while keeping the correlation with the benchmark very high.
Precious Metals stands out in Commodities
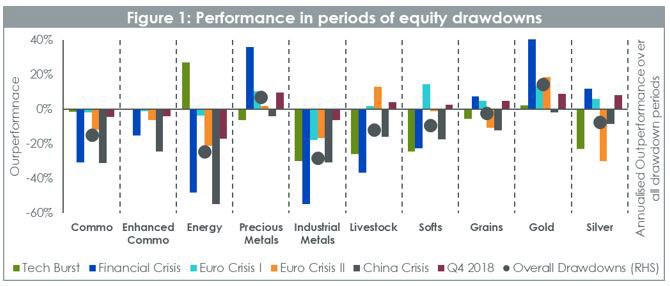
Our framework focuses on 4 characteristics, risk reduction, asymmetry of returns, diversification and valuation. Starting with drawdown protection in Figure 1, it is pretty clear that broad commodities and most commodities sectors are cyclical in nature. Enhanced Commodities fare better than traditional benchmark overall, but the standout defensive asset is precious metals and in particular Gold. In 5 out of the 6 drawdown periods, Gold performed positively, delivering 14.4% per year on average. To put this result in perspective, over those 6 periods, European equities have delivered -35.2%, Min Volatility equities -17.8%, Cash +2.8%, EUR Treasury AAA 8.4% and USD Treasury 11.3%2.
It is worth noting, however, that Energy can also deliver some downside protection when the equity downturn is the result of external shocks such as geopolitical uncertainties. In such, cases Energy and Oil, in particular, tend to react on the upside providing some protection aligned with Gold.
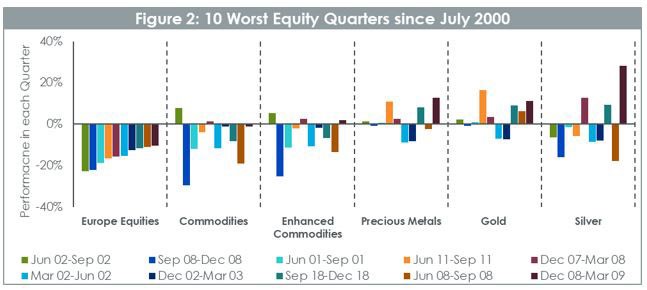
Looking further at the performance of Precious Metals in periods of drawdown we observe in figure 2 that over the 10 worst quarters for European equities in the last 20 years, Gold has 7 quarters of positive performance – a rate of 70%. On average gold outperformed equities by 19% in those quarters. Silver provides results that are more mixed despite outperforming equities by 14% on average. While over the full period commodities didn’t provide a positive return, in 8 of the 10 periods they outperformed equity markets by 8% on average proving that they are still a powerful diversifier. Enhanced Commodities fared even better outperforming equities by 9.6% on average per quarter.
Commodities a chief diversifier
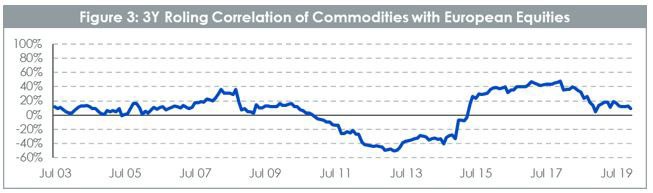
In fact, the rolling 3Y correlation between commodities and equities remains consistently below 50% with long periods where it is nil or even negative. From a pure portfolio construction point of view, this is very exciting as it hands us a diversifying asset that can help reduce the overall volatility of the portfolio.
Gold, a precious tool to build defensive portfolios
From a more macroeconomic perspective and looking at Commodities performance across business cycles, it is again very clear that Precious Metals offer a protection in economic slowdown or recession. In Figure 3, we have split the last 20 years in 4 types of periods using the Organisation for Economic Co-operation and Development (“OECD”) Composite Leading indicator (“CLI”). The CLI has been designed to decrease a few months before economy start to slow down or increase before the economy restarts. So, a strong decline in CLI tends to indicate a probable downturn in equity markets for example.
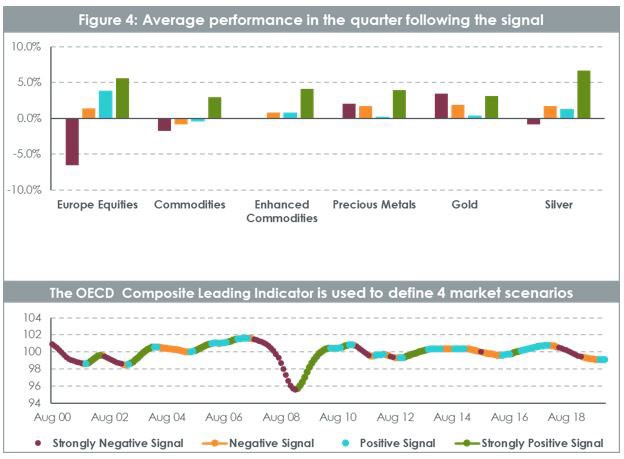
Enhanced Commodities behaved very well compared to front month commodities, cutting significantly the downside in negative economic environments and doing better in positive ones. It is worth noting as well the extent to which commodities and enhanced commodities perform when the economic signals are strong. This is linked to the well documented properties of commodities as an inflation hedge. Precious Metals exhibit a very strong and versatile profile driven mainly by gold.
It is interesting to note that Gold has outperformed very strongly in very negative or negative economic scenarios but also has done very well in periods of strong economic rebound, buoyed by its inflation hedge proprieties. This makes Gold a pretty asymmetric asset with strong positive performance in difficult economic periods but also good performance in strong rebound and when yields are expected to increase. Silver, similarly to palladium and platinum, offers also an interesting payoff, behaving part like a precious metal and part like an industrial metal. In periods where the economy is strong, it benefits from being used in the industry and behave more pro cyclically than gold. However, in economic downturn, it benefits from its status as a precious metal and delivers some protection.
This brings us to our fourth pillar in our framework: valuation. WisdomTree issued its quarterly outlook for Gold in January 2020, offering a number of scenarios fo the metal this year. In “Gold: how we value the precious metal”, we explain how we characterise gold’s past behaviour. Unlike other commodities where the balance of physical supply and demand influence the price, gold behaves more like a pseudo currency, driven by more macroeconomic variables like the interest rate environment, inflation, exchange rates and sentiment. Characterising gold’s past behaviour allows us to project where gold could go in the future (assuming it maintains consistent behaviour) using an internal model. In recent weeks, given the sharp rise in volatility of many asset markets and decisive action by a number of central banks across the globe, we are treading a path that looks like the bull case scenario presented our January 2020 outlooks. That scenario would see gold prices head over US$2000/oz by the end of the year. In that scenario, the Federal Reserve of the US embarks on policy easing (which has already started), that drives Treasury yields lower than where they were in December 2019 (Treasury yields have already broken new all-time lows of 0.35% on March 10th 2020). Inflation in that scenario is at an elevated 2.5% (which is in line with the January 2020 actual reading). Lastly, speculative positioning in gold futures markets remains elevated throughout the course of the year (at 350k contracts net long). In February 2020, we saw speculative positioning hit fresh highs (388k) and at the time of writing (10th March 2020), it remains above the 350k. We caution that if the current shock we are experiencing is temporary, we could get the recent interest rate cuts reversed, Treasury yields could rise to 2% and positing in gold futures could head back to more normal levels (closer to 120k). That was what we presented as a base case in January, where gold would end the year at US$1640/oz. So the downside from the levels ate the time of writing is somewhat limited (with gold trading at US$1650/oz at the time of writing) even if we end up in what was the base case.
This concludes our 6 weeks grand tour of the “natural” defensive assets among the main 4 asset classes. Next week we will start focusing on portfolio construction and on different ideas to design defensive and versatile portfolios.
Europe Equities is proxied by the STOXX Europe 600 net total return index. Broad Commodities (Commo) is proxied by the Bloomberg Commodity Total Return Index. Enhanced Commodities is proxied by Optimized Roll Commodity Total Return Index. Energy is proxied by the Bloomberg Energy subindex Total Return Index. Precious Metals is proxied by the Bloomberg Precious Metals subindex Total Return Index. Industrial Metals is proxied by the Bloomberg Industrial Metals subindex Total Return Index. Livestock is proxied by the Bloomberg Livestock subindex Total Return Index. Softs is proxied by the Bloomberg Softs subindex Total Return Index. Grains is proxied by the Bloomberg Grains subindex Total Return Index. Gold is proxied by the LBMA Gold Price PM Index. Silver is proxied by the LBMA Silver Price index.
By: Pierre Debru, Director, Research
Source
1 WisdomTree, Bloomberg. In EUR.
2 WisdomTree, Bloomberg. In EUR. Europe Equities is proxied by the STOXX Europe 600 net total return index. Min Vol is proxied by MSCI World Min Volatility net total return index. Cash Euro is proxied by a series of daily compounded Eonia. EUR Treasury AAA is proxied by the Bloomberg Barclays EUR Aggregate Treasury AAA total return index. USD Treasury is proxied by the Bloomberg Barclays USD Treasury total return index.

Brent is climbing higher. Front-month is at USD 106.3/bl this morning, close to a weekly high and a USD 9/bl jump from Mondays open. This is the move we flagged as a risk earlier in the week: the market shifting from ”a deal is around the corner” to ”this is going to take longer than we thought”.

Analyst Commodities, SEB
During April, rest-of-year Brent remained remarkably stable around USD 90/bl. A stability which rested on one single assumption: the SoH reopens around 1 May. That assumption is now slowly falling apart.
As we highlighted yesterday: every week of delay beyond 1 May adds (theoretically) ish USD 5/bl to the rest-of-year average, as global inventories draw 100 million barrels per week. i.e., a mid-May reopening implies rest-of-year Brent closer to USD 100/bl, and anything pushing into June or July takes us meaningfully higher.
What’s changed in the last 48 hours:
#1: The US military has formally warned that clearing suspected sea mines from SoH could take up to six months. That is a completely different timescale from what the financial market is pricing. Even a political deal tomorrow does not immediately reopen the strait.
#2: Trump has shifted his tone from urgency to ”strategic patience”. In yesterday’s press conference: ”Don’t rush me… I want a great deal.” The market is reading this as a president no longer feeling pressured by timelines, with the naval blockade running in the background.
#3: So far, the military activity is escalating, not de-escalating. Axios reports Iran is laying more mines in SoH. The US 3rd carrier strike group (USS George H.W. Bush) is arriving with two countermine vessels. Trump yesterday ordered the US Navy to destroy any Iranian boats caught laying mines. While CNN reports that the Pentagon is actively drawing up plans to strike Iranian SoH capabilities and individual Iranian military leaders if the ceasefire collapses. i.e., NOT a attitude consistent with an imminent deal!
Spot crude and product prices eased off the early-April highs on a combination of system rerouting and deal optimism. Both now weakening. Goldman estimates April Gulf output is reduced by 14.5 mbl/d, or 57% of pre-war supply, a number that keeps getting worse the longer this drags on.
Demand-side adaptation is ongoing: S. Korea has cut its Middle East crude dependence from 69% to 56% by pulling more from the Americas and Africa, and Japan is kicking off a second round of SPR releases from 1 May. But SPRs are finite.
Ref. to the negotiations, we should not bet on speed. The current Iranian leadership is dominated by genuine hardliners willing to absorb economic pain and run the clock to extract concessions. That is not a setup for a rapid resolution. US/Israeli media briefings keep framing the delay as ”internal Iranian divisions”, the reality is more complicated and points toward weeks and months, not days.
Our point is that the complexity is large, and higher prices have only just started (given a scenario where the negotiations drag out in time). The market spent April leaning on the USD 90/bl rest-of-year assumption; that case is diminishing by the hour. If ”early May reopening” is replaced by ”June, July or later” over the next week or two, both crude and products have meaningful room to reprice higher from here. There is a high risk being short energy and betting on any immediate political resolution(!).
Down on Friday. Up on Monday. The Brent June crude oil contract traded down 5.1% last week to a close of $90.38/b. It reached a high of $103.87/b last Monday and a low of $86.09/b on Friday as Iran announced that the Strait of Hormuz was fully open for transit. That quickly changed over the weekend as the US upheld its blockade of Iranian oil exports while Iran naturally responded by closing the SoH again. The US blew a hole in the engine room of the Iranian ship TOUSKA and took custody of the ship on Sunday. Brent crude is up 5.6% this morning to $95.4/b.

The cease-fire is expiring tomorrow. The US has said it will send a delegation for a second round of negotiations in Islamabad in Pakistan. But Iran has for now rejected a second round of talks as it views US demands as unrealistic and excessive while the US is also blocking the Strait of Hormuz.
While Brent is up 5% this morning, the financial market is still very optimistic that progress will be made. That talks will continue and that the SoH will fully open by the start of May which is consistent with a rest-of-year average Brent crude oil price of around $90/b with the market now trading that balance at around $88/b.
Financial optimism vs. physical deterioration. We have a divergence where the financial market is trading negotiations, improvements and resolution while at the same time the physical market is deteriorating day by day. Physical oil flows remain constrained by disrupted flows, longer voyage times and elevated freight and insurance costs.
Financial markets are betting that a US/Iranian resolution will save us in time from violent shortages down the road. But every day that the SoH remains closed is bringing us closer to a potentially very painful point of shortages and much higher prices.
The US blockade is also a weapon of leverage against its European and Asian allies. When Iran closed the SoH it held the world economy as a hostage against the US. The US blockade of the SoH is of course blocking Iranian oil exports. But it is also an action of disruption directed towards Europe and Asia. The US has called for the rest of the world to engaged in the war with Iran: ”If you want oil from the Persian Gulf, then go and get it”. A risk is that the US plays brinkmanship with the global oil market directed towards its European and Asian allies and maybe even towards China to force them to engage and take part. Maybe unthinkable. But unthinkable has become the norm with Trump in the White House.
Wild moves yesterday. Brent crude traded to a high of $114.43/b and a low of $96.0/b and closed at $99.94/b yesterday.
US – Iran negotiations ongoing or not? What a day. Donald Trump announced that good talks were ongoing between Iran and the US and that the 48 hour deadline before bombing Iranian power plants and energy infrastructure was postponed by five days subject to success of ongoing meetings. Iranian media meanwhile stated that no meetings were ongoing at all.
Today we are scratching our heads trying to figure out what yesterday was all about.
Friends and family playing the market? Was it just Trump and his friends and family who were playing with oil and equity markets with $580m and $1.46bn in bets being placed by someone in oil and equity markets just 15 minutes before Trump’s announcement?
Was Trump pulling a TACO as he reached his political and economic pain point: Brent at $112/b, US Gas at $4/gal, SPX below 200dma and US 10yr above 4.4%?
Different Iranian factions with Trump talking with one of them? Are there real negotiations going on but with the US talking to one faction in Iran while another, the hardliners, are not involved and are denying any such negotiations going on?
Extending the ultimatum to attack and invade Kharg island next weekend? Or, is the five day delay of the deadline a tactical decision to allow US amphibious assault ships and marines to arrive in the Gulf in the upcoming weekend while US and Israeli continues to degrade Iranian military targets till then. And then next weekend a move by the US/Israel to attack and conquer for example the Kharg island?
We do not really know which it is or maybe a combination of these.
We did get some kind of TACO ydy. But markets have been waiting for some kind of TACO to happen and yesterday we got some kind of TACO. And Brent crude is now trading at $101.5/b as a result rather than at $112-114/b as it did no the high yesterday.
But what really matters in our view is the political situation on the ground in Iran. Will hardliners continue to hold power or will a more pragmatic faction gain power?
If the hardliners remain in power then oil pain should extend all the way to US midterm elections. The hardliners were apparently still in charge as of last week. Iran immediately retaliated and damaged LNG infrastructure in Qatar after Israel hit Iranian South Pars. The SoH was still closed and all messages coming out of Iran indicated defiance. Hardliners continues in power has a huge consequence for oil prices going forward. The regime has played its ’oil-weapon’ (closing or chocking the Strait of Hormuz). It is using it to achieve political goals. Deterrence: it needs to be so politically and economically expensive to attack Iran that it won’t happen again in the future. Or at least that the US/Israel thinks 10-times over before they attack again. The highest Brent crude oil closing price since the start of the war is $112.19/b last Friday. In comparison the 20-year inflation adjusted Brent price is $103/b. So Brent crude last Friday at $112.19/b isn’t a shockingly high price. And it is still far below the nominal high of $148/b from 2008 which is $220/b if inflation adjusted. So once in a lifetime Iran activates its most powerful weapon. The oil weapon. It needs to show the power of this weapon and it needs to reap political gains. Getting Brent to $112/b and intraday high of $119.5/b (9 March) isn’t a display of the power of that weapon. And it is not a deterrence against future attacks.
So if the hardliners remain in power in Iran, then the SoH will likely remain chocked all the way to US midterm elections and Brent crude will at a minimum go above the historical nominal high of $148/b from 2008.
Thus the outlook for the oil price for the rest of the year doesn’t depend all that much of whether Trump pulls a TACO or not. Stops bombing or not. It depends more on who is in charge in Iran. If it is the hardliners, then deterrence against future attacks via chocking of the SoH and high oil prices is the likely line of action. It is impacting the world but the Iranian ’oil-weapon’ is directed towards the US president and the the US midterm elections.
If a pragmatic faction gets to power in Iran, then a very prosperous future is possible. However, if power is shifting towards a more pragmatic faction in Iran then a completely different direction could evolve. Such a faction could possibly be open for cooperation with the US and the GCC and possibly put its issues versus Israel aside. Then the prosperity we have seen evolving in Dubai could be a possible future also for Iran.
So far it looks like the hardliners are fully in charge. As far as we can see, the hardliners are still fully in control in Iran. That points towards continued chocking of the SoH and oil prices ticking higher as global inventories (the oil market buffers) are drawn lower. And not just for a few more weeks, but possibly all the way to the US midterm elections.


Solkraften pressar elpriserna dagtid

Michel Gubel ger sin syn på oljemarknaden

Svag vårflod dubblar elpriserna
Brent crude up USD 9/bl on the week… ”deal around the corner” narrative fades
Market Still Betting on Timely Resolution, But Each Day Raises Shortage Risk

Christian Kopfer om läget för oljan
Market Still Betting on Timely Resolution, But Each Day Raises Shortage Risk
Brent crude up USD 9/bl on the week… ”deal around the corner” narrative fades
Michel Gubel ger sin syn på oljemarknaden
Solkraften pressar elpriserna dagtid
-
 Nyheter4 veckor sedan
Christian Kopfer om läget för oljan
-
Analys3 veckor sedan
Market Still Betting on Timely Resolution, But Each Day Raises Shortage Risk
-
Analys3 veckor sedan
Brent crude up USD 9/bl on the week… ”deal around the corner” narrative fades
-
 Nyheter2 veckor sedan
Michel Gubel ger sin syn på oljemarknaden
-
 Nyheter2 veckor sedan
Solkraften pressar elpriserna dagtid
-
Nyheter2 veckor sedan
Svag vårflod dubblar elpriserna