

Analys
Agricultural commodities could offer a hedge against inflation


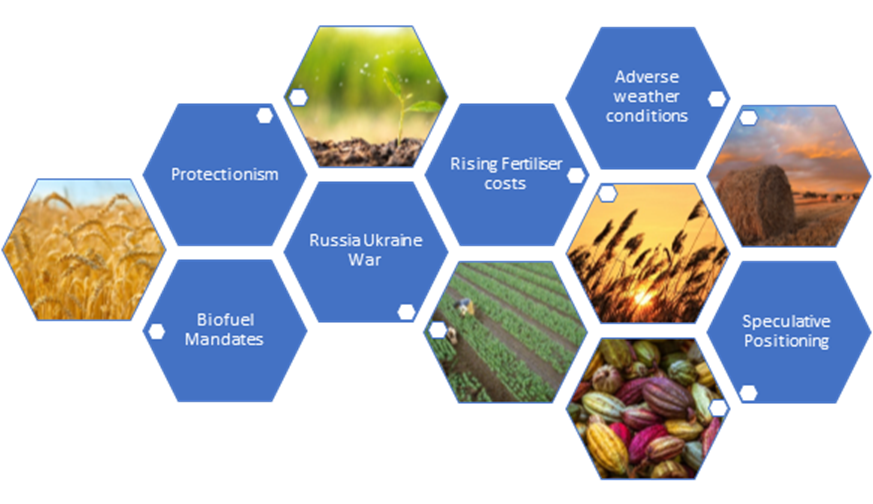
Agricultural commodity prices have been buoyed higher by rising grain and oilseed prices. At a time, when global equities have sold off by nearly 13.88% amidst soaring inflation and tightening liquidity conditions, agricultural commodities are up 26.8%. There are a plethora of supply side issues emanating from the war that are likely to continue to drive prices higher – the rise of protectionism, higher fertiliser costs, changing biofuel mandates and adverse weather conditions to name a few. The Russia-Ukraine war has had ripple effects from disrupting supply chains to raising fertiliser costs.
Rising protectionism buoys agricultural commodities higher
The war-related disruptions have also given rise to protectionism. To cite a few examples in 2022– India, the world’s third largest wheat producer, announced it would restrict wheat exports to manage domestic supplies of the grain, which led to a sharp rise in wheat prices. Indonesia also announced an export ban on palm oil on April 28, but the ban was lifted on May 19 after hundreds of farmers rallied to protest the move. In a tight oil-seeds markets, the initial announcement led soybean oil, an alternative to palm oil, sharply higher.
Higher biofuel blending mandates to bolster demand for corn and soybean oil
Changes in the biofuel blending mandates are also poised to increase demand for agricultural commodities. The US is home to the world’s largest biofuel market. The Biden administration is ordering refiners to boost the use of biofuels such as corn-based ethanol. The US Environmental Protection Agency (EPA) is requiring refiners to mix 20.63 billion gallons of renewable fuels into gasoline and diesel this year, marking a 9.5% increase over last year’s target. This will put pressure on refiners to blend more biofuel into their gasoline production this year, resulting in a net positive impact on the biofuels industry. Grains such as corn stand to benefit owing to their high starch content and relatively easy conversion to ethanol. Amidst waning stockpiles of diesel, Brazil is also considering increasing the biodiesel blend to 15% from 10% (i.e. the amount of soybean oil blended into trucking fuel). This has the potential to bolster demand for soybeans at a time when soybeans are already in short supply due to droughts in South America and US plantings trail last year’s pace.
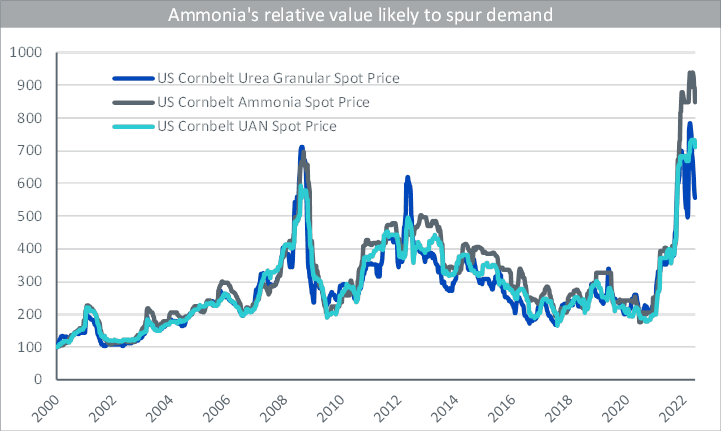
Rising fertiliser costs are weakening demand, in turn lowering yields
The Russia-Ukraine conflict has caused disruptions in fertiliser production and material price increases, which has put farmer margins and agricultural yields at risk elsewhere, driving the prices of most agricultural commodities higher. Russia and Ukraine account for a significant share of the global fertiliser trade. Russia produces 9% of global nitrogen fertiliser, 10% of global phosphate fertiliser, and 20% of global potash fertiliser. It exports more than two thirds of its production of each product. Belarus produces an additional 17% of global potash and exports most of it.
Owing to its high soil quality, Argentina tends to use less fertilisers, but Brazil (the world’s largest importer of fertilisers) of which 85% of its needs are imported, is likely to feel the impact more. Russia alone accounts for 25% of Brazil’s total fertiliser imports. Farmers can also plant more soybeans, which require less fertilisers than corn. The US and global corn balance are set to continue to tighten, which suggests that the current high price environment is set to linger. The high prices and low availability of fertilisers is making farmers reduce usage and is also resulting in lower fertiliser prices similar to the trend witnessed back in 2008.
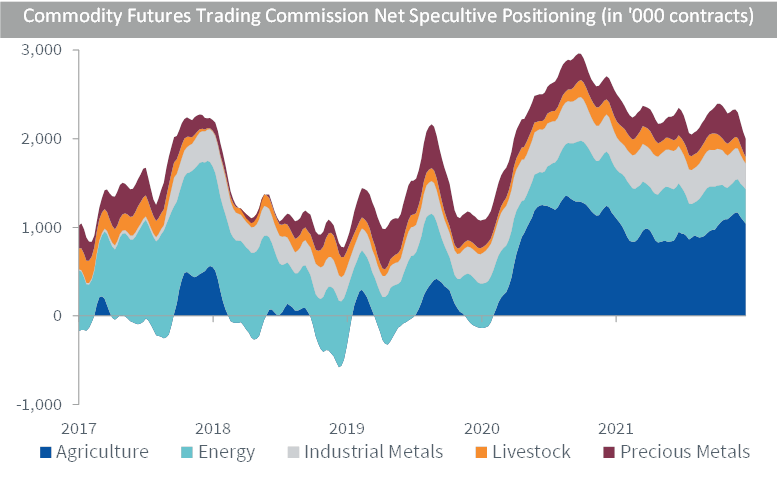
Speculative positioning garnering momentum among agricultural commodities
According to data from the Commodity Futures Trading Commission (CFTC), net speculative positioning in agricultural commodities has risen considerably since the covid pandemic. Tighter supply coupled with stockpiling by national governments concerned about food security has led to a rise in agricultural commodity prices. Not only has net speculative positioning on agricultural commodities risen versus its own history but also in comparison to other commodity subsectors, as illustrated in the chart below:
Adverse weather conditions impact agricultural commodities
El Niño and La Niña are the warm and cool phases of a recurring climate pattern across the tropical Pacific—the El Niño-Southern Oscillation, or “ENSO” for short. The pattern shifts back and forth irregularly every two to seven years, and each phase triggers predictable disruptions of temperature, precipitation. The current La Niña has been around since October 2021. It has been responsible for the South American droughts, milder weather in Southern parts of US and heavy rainfalls across the Pacific Northwest. There is a 51% chance La Niña could continue into the December to February period, with those odds down from last month’s forecast of 58% according to the US climate prediction centre. The waters across the equatorial Pacific Ocean are expected to stay cool or be close to normal between June and September, which means the influence on weather patterns won’t be enough to disrupt tropical storms and hurricanes in the Atlantic.
Conclusion
Agricultural commodities have posted a strong performance in 2022. Yet there remain plenty of factors that could drive the performance of this commodity subsector even higher. Agricultural commodities are unique owing to their high dependence on weather conditions that make them volatile but also offer diversification benefits.
Aneeka Gupta, Director, Macroeconomic Research, WisdomTree

Market is starting to take US/Iran headlines with a pinch of salt. Brent crude rose $2.8/b yesterday to an official close of $112.1/b. But after that it traded as low as $108.05/b before ending late night at around $109.7/b. Through the day it traded in a range of $106.87 – 112.72/b amid a flurry of news or rumors from Iran and the US. ”US temporary sanctions during negotiations” (falls alarm). ”We will bomb Iran” (not anyhow),… etc. While the market is still fluctuating to this kind of news flow, it is starting to take such headlines with a pinch of salt.

We’ll see. Maybe, maybe not. The Brent M1 contract is trading at $110.2/b this morning which very close to the average ticks through yesterday of $110.4/b.
Trump with bearish, verbal intervention whenever Brent trades above $110/b it seems. What seems to be a pattern is that Trump states something like ”very good negotiations going on with Iran”, ”New leaders in Iran are great,..”, ”Great progress in negotiations,…”, ”Deal in sight,..” etc whenever the Brent M1 contract trades above $110/b. An effort to cool the market. These hot air verbal interventions from Trump used to have a heavy bearish impact on prices, but they now seems to have less and less effect unless they are backed by reality.
As far as we can see there has been no real progress in the negotiations between the US and Iran with both sides still standing by their previous demands.
Iran is getting stronger while the cease fire lasts making a return to war for Trump yet harder. Iran is naturally in constant preparation for a return to war given Trump’s steady threats of bombing Iran again. Iran is naturally doing what ever is possible to prepare for a return to war. And every day the cease fire lasts it is better prepared. This naturally makes it more and more difficult and dangerous for the US to return to warring activity versus Iran as the consequences for energy infrastructure in the Persian Gulf will be more and more severe the longer the cease fire lasts. Israel seems to see it this way as well. That the war is not won and that current frozen state of a cease fire gives Iran opportunity to rebuild military and politically.
Global inventories are drawing down day by day. How much? In the meantime the Strait of Hormuz stays closed. There is varying measures and estimates of how much global inventories are drawing down. Our rough estimate, back of the envelope, is that global inventories are drawing down by at least some 10 mb/d or about 300 mb/d in a balance between loss of supply versus demand destruction. Other estimates we see are a monthly draw of 250-270 mb/d. The IEA only ’measured’ a draw in global observable stocks of 117 mb in April with oil on water rising 53 mb while on shore stocks fell 170 mb. But global stocks are hard to measure with large invisible, unmeasured stocks. As such a back of the envelope approach may be better.
Oil products is what the world is consuming. Oil product prices likely to rise while product stocks fall. Strategic Petroleum Reserves (SPR) are predominantly crude oil. Discharging oil from OECD SPR stocks, a sharp reduction in Chinese crude imports and a reduction in global refinery throughput of 6-7 mb/d has helped to keep crude oil markets satisfactorily supplied. But global inventories are drawing down none the less. And oil products is really what the world is consuming. So if global refinery throughput stays subdued, then demand will eventually have to match the supply of oil products. The likely path forward this summer is a steady draw down in jet fuel, diesel and gasoline. Higher prices for these. Then, if possible, higher refinery throughput and higher usage of crude in response to very profitable refinery margins. And lastly sharper draw in crude stocks and higher prices for these. But some 6 mb/d of oil products used to be exported through the Strait of Hormuz. And it may not be so easy to ramp up refinery activity across the world to compensate. Especially as Ukraine continues to damage Russian refineries as well as Russian crude production and export facilities.
Watch oil product stocks and prices as well as Brent calendar 2027. What to watch for this summer is thus oil product inventories falling and oil product premiums to crude rising. Another measure to watch is the Brent crude 2027 contract as it rises steadily day by day as the Strait of Hormuz stays closed and global oil inventories decline. The latter is close to the highest level since the start of the war and keeps rising.
The Brent M1 contract and the Brent 2027 prices and current price of jet fuel in Europe (ARA). All in USD/b

Our back of the envelope calculation of the global shortage created by the closure of the Strait of Hormuz. Note that 3.5 mb/d of discharge from SPR is also a draw. Note also that ’Forced demand loss’ of 2.5 mb/d is probably temporary and will fall back towards zero as logistics are sorted out leaving ’Price demand loss’ to do the job of balancing the market. Thus a shortfall of at least 9 mb/d created by the closure. More if SPR discharge is included and more if Forced demand loss recedes.

Brent is climbing higher. Front-month is at USD 106.3/bl this morning, close to a weekly high and a USD 9/bl jump from Mondays open. This is the move we flagged as a risk earlier in the week: the market shifting from ”a deal is around the corner” to ”this is going to take longer than we thought”.

Analyst Commodities, SEB
During April, rest-of-year Brent remained remarkably stable around USD 90/bl. A stability which rested on one single assumption: the SoH reopens around 1 May. That assumption is now slowly falling apart.
As we highlighted yesterday: every week of delay beyond 1 May adds (theoretically) ish USD 5/bl to the rest-of-year average, as global inventories draw 100 million barrels per week. i.e., a mid-May reopening implies rest-of-year Brent closer to USD 100/bl, and anything pushing into June or July takes us meaningfully higher.
What’s changed in the last 48 hours:
#1: The US military has formally warned that clearing suspected sea mines from SoH could take up to six months. That is a completely different timescale from what the financial market is pricing. Even a political deal tomorrow does not immediately reopen the strait.
#2: Trump has shifted his tone from urgency to ”strategic patience”. In yesterday’s press conference: ”Don’t rush me… I want a great deal.” The market is reading this as a president no longer feeling pressured by timelines, with the naval blockade running in the background.
#3: So far, the military activity is escalating, not de-escalating. Axios reports Iran is laying more mines in SoH. The US 3rd carrier strike group (USS George H.W. Bush) is arriving with two countermine vessels. Trump yesterday ordered the US Navy to destroy any Iranian boats caught laying mines. While CNN reports that the Pentagon is actively drawing up plans to strike Iranian SoH capabilities and individual Iranian military leaders if the ceasefire collapses. i.e., NOT a attitude consistent with an imminent deal!
Spot crude and product prices eased off the early-April highs on a combination of system rerouting and deal optimism. Both now weakening. Goldman estimates April Gulf output is reduced by 14.5 mbl/d, or 57% of pre-war supply, a number that keeps getting worse the longer this drags on.
Demand-side adaptation is ongoing: S. Korea has cut its Middle East crude dependence from 69% to 56% by pulling more from the Americas and Africa, and Japan is kicking off a second round of SPR releases from 1 May. But SPRs are finite.
Ref. to the negotiations, we should not bet on speed. The current Iranian leadership is dominated by genuine hardliners willing to absorb economic pain and run the clock to extract concessions. That is not a setup for a rapid resolution. US/Israeli media briefings keep framing the delay as ”internal Iranian divisions”, the reality is more complicated and points toward weeks and months, not days.
Our point is that the complexity is large, and higher prices have only just started (given a scenario where the negotiations drag out in time). The market spent April leaning on the USD 90/bl rest-of-year assumption; that case is diminishing by the hour. If ”early May reopening” is replaced by ”June, July or later” over the next week or two, both crude and products have meaningful room to reprice higher from here. There is a high risk being short energy and betting on any immediate political resolution(!).
Down on Friday. Up on Monday. The Brent June crude oil contract traded down 5.1% last week to a close of $90.38/b. It reached a high of $103.87/b last Monday and a low of $86.09/b on Friday as Iran announced that the Strait of Hormuz was fully open for transit. That quickly changed over the weekend as the US upheld its blockade of Iranian oil exports while Iran naturally responded by closing the SoH again. The US blew a hole in the engine room of the Iranian ship TOUSKA and took custody of the ship on Sunday. Brent crude is up 5.6% this morning to $95.4/b.
The cease-fire is expiring tomorrow. The US has said it will send a delegation for a second round of negotiations in Islamabad in Pakistan. But Iran has for now rejected a second round of talks as it views US demands as unrealistic and excessive while the US is also blocking the Strait of Hormuz.
While Brent is up 5% this morning, the financial market is still very optimistic that progress will be made. That talks will continue and that the SoH will fully open by the start of May which is consistent with a rest-of-year average Brent crude oil price of around $90/b with the market now trading that balance at around $88/b.
Financial optimism vs. physical deterioration. We have a divergence where the financial market is trading negotiations, improvements and resolution while at the same time the physical market is deteriorating day by day. Physical oil flows remain constrained by disrupted flows, longer voyage times and elevated freight and insurance costs.
Financial markets are betting that a US/Iranian resolution will save us in time from violent shortages down the road. But every day that the SoH remains closed is bringing us closer to a potentially very painful point of shortages and much higher prices.
The US blockade is also a weapon of leverage against its European and Asian allies. When Iran closed the SoH it held the world economy as a hostage against the US. The US blockade of the SoH is of course blocking Iranian oil exports. But it is also an action of disruption directed towards Europe and Asia. The US has called for the rest of the world to engaged in the war with Iran: ”If you want oil from the Persian Gulf, then go and get it”. A risk is that the US plays brinkmanship with the global oil market directed towards its European and Asian allies and maybe even towards China to force them to engage and take part. Maybe unthinkable. But unthinkable has become the norm with Trump in the White House.


Sommarväder skapar prisrally på elbörsen
Oil product price pain is set to rise as the Strait of Hormuz stays closed into summer

Solkraften pressar elpriserna dagtid

Michel Gubel ger sin syn på oljemarknaden