

Nyheter
Gold: how we value the precious metal


Gold is a unique asset class. Indeed, many investors even question whether it is an asset class. Is it a commodity, or a currency? What’s also interesting about gold is that even though it has been viewed as a form of investment for several millennia, there’s little consensus on how to actually value it.
In this article, we’ll look at how we value gold at WisdomTree and explain how we use historic price behaviour to generate gold price forecasts for the future.
The difficulty in valuing gold
It’s easy to understand why valuing gold is complex.
For a start, gold does not generate cash flow like other assets do, so traditional valuation techniques such as discounted cash flow (DCF) models don’t work.
Another complication lies in the fact that there have been many regime shifts in relation to the precious metal over the years. For example, between 1933 and 1974, investment in gold bullion was all-but barred in the US after President Franklin D. Roosevelt signed Executive Order 61021. Similarly, in China, gold bullion investment was effectively prohibited between 1950 and 20042. Today, these two countries are among the largest bullion investing nations in the world. So, clearly, using extremely long timeseries of data to calibrate a gold valuation model is not appropriate.
With little consensus on valuation methods, financial commentators are often quite emotive in their projections for the metal. There are the ‘gold bugs,’ who tend to be perma-bulls, while there are also gold bears who believe that the metal has little value.
The WisdomTree gold model
At WisdomTree, our goal has been to develop a robust, impartial gold model.
We recognise that many factors affect the price of gold, so we have modelled the precious metal in a multivariate fashion. We have been able to build a basic model with four key explanatory variables and our gold price forecasts can be positive, negative, or neutral, depending on the direction of these underlying variables. Notably, our model describes gold as more of a monetary asset than a commodity.
In our gold model, we show that changes in US Dollar gold prices are driven by (direction in parenthesis):
- Changes in the US Dollar basket (-)
- Consumer Price Index (CPI) inflation (+)
- Changes in nominal yields on 10-year US Treasuries (-)
- Investor sentiment (measured by speculative positioning in the futures market) (+)
We chose to put both inflation and nominal yields into the model as a proxy for real yields, rather than real yields directly so that we could use a longer data set (Treasury Inflation Protected Securities have only been around since 1997), and our model goes back to 1995 when Commodity Futures Trading Commission (CFTC) data on speculative futures market positioning first starts.
Figure 1 shows forecasts when calibrating our model using data from April 1996 to April 2017.
Figure 1. Gold price model in ”out of sample” test
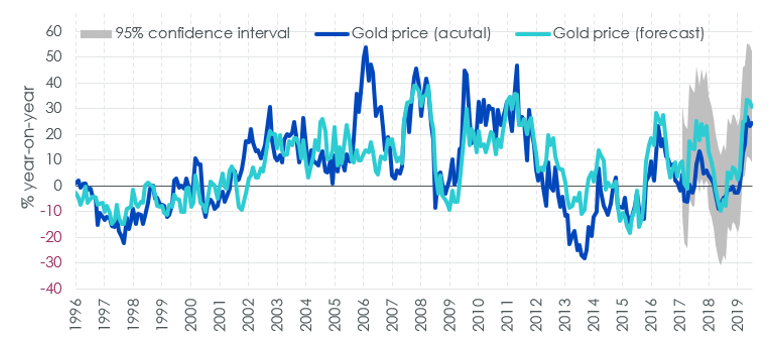
As you can see, our model tracks the actual price of gold quite well. However, we have also added new variables to the model to see if they enhance its explanatory power.
Additional variables
To this base model we added a number of extra variables over the April 1995 to April 2018 period. Here’s what we found:
- Equity markets: Year-on-year changes in gold prices were negatively related to year-on-year changes in the S&P 500 and including the equity market indicator in the model weakened the significance of nominal yields. So, we chose not to include an equity market factor in our final model.
- Volatility: Changes in the option implied volatility of the S&P500 (CBOE Volatility Index, VIX) did not help explain gold prices. Many people regard gold as a hedge against surprises, but we found that the VIX didn’t have a significant impact in our model. This may have been related to the monthly frequency of our model as surprises are often too short-lived to be picked up in a monthly model.
- ETP assets: Gold prices appeared to be negatively associated with changes in gold exchange traded product (ETP) assets under management (measured in ounces) and the results cast doubt on the popular assertion that rising gold ETP demand has been responsible for higher gold prices.
- US Federal Reserve (Fed) balance sheet: Changes in the Fed’s balance sheet size and changes in US M2 money supply growth were also not a significant factor in explaining gold prices. This was a surprising result, given the focus on monetary expansion in the context of gold price movements. However, it could just be the case that the US Dollar basket picks up most of the relationship. Changes in the combined balance sheets of the Fed, European Central Bank, Bank of Japan and Swiss National Bank were also not significant.
Does physical demand matter?
We also looked at whether non-ETP demand for gold (jewellery, technology, bullion, and central bank purchases) can explain gold price movements. To do this, we switched to a quarterly model of gold prices in order to incorporate the quarterly gold demand data from the World Gold Council, and shortened the span of the model to 2005 due to data limitations.
Here, our research indicated that physical gold demand is also not a relevant factor in explaining gold prices.
What has been the most important driver of gold prices in the past?
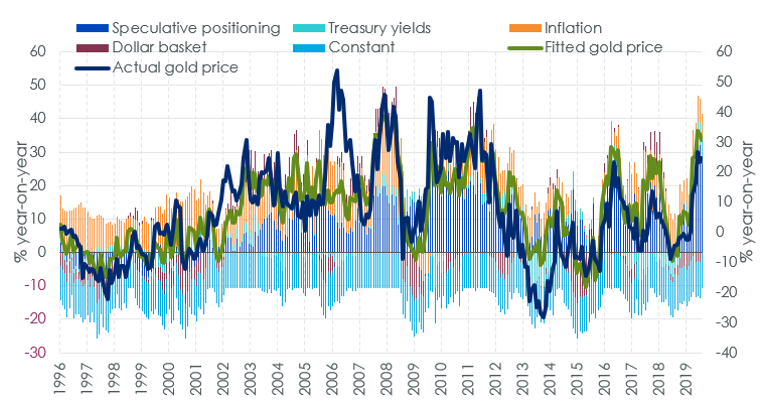
This is a question that comes up regularly and unfortunately, it’s not a simple question to answer. This is because, as shown in Figure 2, at times a variable can have a large impact on the price of gold and at other times its impact can be minimal.
Figure 2. The impact of each variable: attribution of fitted results vs. actual price
How we use our gold model
Ultimately, understanding gold’s historic behaviour allows us to make future gold price forecasts, as long as we have a view on the explanatory variables.
By analysing key macroeconomic factors, including Federal Reserve policy, Treasury yields, and exchange rates, our gold model can be used to produce gold price forecasts.
For those interested, we will shortly be releasing our updated outlook for gold prices up to Q2 2020.
By: Nitesh Shah, Director, Research, WisdomTree
This material is prepared by WisdomTree and its affiliates and is not intended to be relied upon as a forecast, research or investment advice, and is not a recommendation, offer or solicitation to buy or sell any securities or to adopt any investment strategy. The opinions expressed are as of the date of production and may change as subsequent conditions vary. The information and opinions contained in this material are derived from proprietary and non-proprietary sources. As such, no warranty of accuracy or reliability is given and no responsibility arising in any other way for errors and omissions (including responsibility to any person by reason of negligence) is accepted by WisdomTree, nor any affiliate, nor any of their officers, employees or agents. Reliance upon information in this material is at the sole discretion of the reader. Past performance is not a reliable indicator of future performance.


Nyheter
Hur säkrar vi Sveriges tillgång till kritiska metaller och mineral i en ny geopolitisk verklighet?

När världsläget förändras ställs Europas beroende av metaller och mineral på sin spets. Geopolitiska spänningar, handelskonflikter och ett mer oförutsägbart USA gör att vi inte längre kan ta gamla allianser för givna. Samtidigt kontrolleras en stor del av de kritiska råvarorna vi är beroende av av andra makter – inte minst Kina. Vad händer med Sveriges industriella förmåga i ett läge där importen stryps? Hur påverkas försvarsindustrin av Kinas exportrestriktioner? Är EU:s nya råvarupolitik tillräcklig för att minska sårbarheten – eller krävs ytterligare statliga insatser och beredskapslagring? Svemin anordnade den 25 juni ett seminarium som bestod av bestod av deltagare från myndigheter, politik och industri. Man diskuterar Sveriges och EU:s strategiska vägval i en ny global verklighet – och vad som krävs för att säkra tillgången till metaller när vi behöver dem som mest.
Lundin Mining är bolaget i Lundin-sfären som satsar stort på Vicuña-projektet i Argentina. Det ska lyfta Lundin Mining till att bli en av de tio största kopparproducenterna i världen skriver Affärsvärlden och upprepar sin köprekommendation för aktien.
”Även om en framgång inte är på förhand given tror vi att Vicuña har goda chanser att bli bra. Vi förnyar vårt köpråd för Lundin Mining”
Enligt Lundin Minings ledning kommer man att klara att finansiera sin del av investeringarna i Vicuña genom det löpande kassaflödet som man förväntar sig ska bli omkring 5 miljarder dollar kommande fem år i kombination med lån.

Många verksamheter tar nu ett sommaruppehåll och ute värmer solen, det är gott om vatten och vinden blåser. Lägre efterfrågan på el och goda förutsättningar för kraftproduktionen höll ner elpriserna under juni.

Elpriset på den nordiska elbörsen Nord Pool (utan påslag och exklusive moms) i elområde 1 och 2 (Norra Sverige) blev för juni 3,05 respektive 4,99 öre/kWh, vilket är rekordlågt och de lägsta på minst 25 år.
– Elpriset påverkas av en rad faktorer men vädret väger tyngst. På sommaren minskar efterfrågan på el och många verksamheter har ett uppehåll. Detta tillsammans med goda förutsättningar inom kraftproduktionen påverkar elpriset nedåt, säger Jonas Stenbeck, privatkundschef Vattenfall Försäljning Norden.
Den hydrologiska balansen, måttet för att uppskatta hur mycket vatten som finns lagrat ovanför kraftstationerna, ligger över normal nivå, särskilt i norra Skandinavien. Tillgängligheten för kärnkraften i Norden är just nu 82 procent av installerad effekt.
– De goda nordiska produktionsförutsättningarna gör elpriserna mindre känsliga för förändringar i omvärlden, säger Jonas Stenbeck.
Priserna på olja och gas kan dock ändras snabbt med anledning av en turbulent omvärld. På kontinenten har efterfrågan på gas sjunkit och nytt solkraftsrekord för Tyskland sattes på midsommarafton med en produktion på 52,5 GW.
– Många av de goda elvanor vi skaffade oss under elpriskrisen verkar leva kvar och gör nytta även på sommaren. De svenska hushållens elförbrukning under 2024 var faktiskt den lägsta detta millenium, säger Jonas Stenbeck.
| Medelspotpris | Juni 2024 | Juni 2025 |
| Elområde 1, Norra Sverige | 24,04 öre/kWh | 3,05 öre/kWh |
| Elområde 2, Norra Mellansverige | 24,04 öre/kWh | 4,99 öre/kWh |
| Elområde 3, Södra Mellansverige | 27,27 öre/kWh | 22,79 öre/kWh |
| Elområde 4, Södra Sverige | 62,70 öre/kWh | 40,70 öre/kWh |


Hur säkrar vi Sveriges tillgång till kritiska metaller och mineral i en ny geopolitisk verklighet?

Lundin Mining ska bli en av de tio största kopparproducenterna i världen

Sommarvädret styr elpriset i Sverige

Samtal om flera delar av råvarumarknaden
Tightening fundamentals – bullish inventories from DOE

Stor uppsida i Lappland Guldprospekterings aktie enligt analys
Silverpriset släpar efter guldets utveckling, har mer uppsida

Uppgången i oljepriset planade ut under helgen

Låga elpriser i sommar – men mellersta Sverige får en ökning

Mahvie Minerals växlar spår – satsar fullt ut på guld
-
 Nyheter4 veckor sedan
Stor uppsida i Lappland Guldprospekterings aktie enligt analys
-
 Nyheter4 veckor sedan
Silverpriset släpar efter guldets utveckling, har mer uppsida
-
 Nyheter3 veckor sedan
Uppgången i oljepriset planade ut under helgen
-
 Nyheter3 veckor sedan
Låga elpriser i sommar – men mellersta Sverige får en ökning
-
 Nyheter2 veckor sedan
Mahvie Minerals växlar spår – satsar fullt ut på guld
-
 Analys3 veckor sedan
Very relaxed at USD 75/b. Risk barometer will likely fluctuate to higher levels with Brent into the 80ies or higher coming 2-3 weeks
-

 Nyheter1 vecka sedan
Oljan, guldet och marknadens oroande tystnad
-

 Nyheter1 vecka sedan
Jonas Lindvall är tillbaka med ett nytt oljebolag, Perthro, som ska börsnoteras