

Analys
Defensive Assets: Gold, a precious ally in the fight against equity drawdown


In the previous instalments of this blog series, we highlighted the defensive behaviour of quality and high dividend equities, long duration government bonds and safe haven currencies as an asset, as well as an overlay to other asset classes. The last few weeks really put investors’ portfolio to the test and the least we can say is that those defensive assets did very well. While Global Equities (MSCI World net TR) lost 17.91% from the most recent tops on 12th February up to 9th March, Long Duration Treasuries (proxied by the Bloomberg Barclays US Treasury 10+) have return an incredible +21.99%. In the same period, Japanese Yen was up 7.54% versus the US Dollar and Quality stocks (proxied by the WisdomTree Global Quality Dividend Growth net TR) did cushion the fall, losing 15.73% and therefore outperforming the market by 2.27%1.
This week, our journey takes us to a fourth asset class, Commodities. Using our defensive framework, we will assess how single commodities or commodity sectors react to equity downturn. In particular, we will highlight how:
- precious metals such as Gold can bring potential diversification and defensiveness to a portfolio as well as act as inflation hedge on the upside. Gold was up 6.96% from 12th February to 9th March 2020;
- Broad commodities could act as a diversifier in a multi asset portfolio.
In the following, we analyse traditional Commodity benchmarks that use front month futures to invest in the different commodities in the universe (being commodities in general or sectors). The only exception are precious metals, were physical investments are considered (physical bullions in vaults for Gold for example). Enhanced commodities are meant to represent “smart beta” in commodities where the strategy can invest further along the curve (i.e. not always in the front month future) to improve the roll yield available to the investor while delivering similar spot and collateral returns. More information on this topic is available on our website. Those strategies have historically delivered strong outperformance over time while keeping the correlation with the benchmark very high.
Precious Metals stands out in Commodities
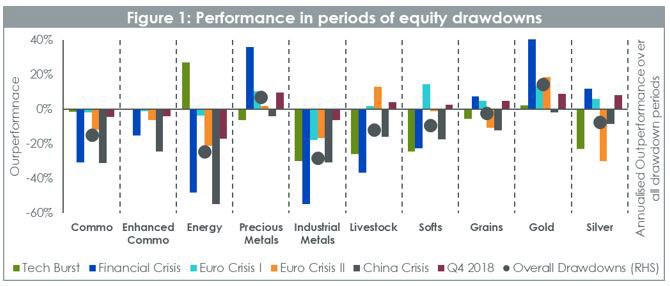
Our framework focuses on 4 characteristics, risk reduction, asymmetry of returns, diversification and valuation. Starting with drawdown protection in Figure 1, it is pretty clear that broad commodities and most commodities sectors are cyclical in nature. Enhanced Commodities fare better than traditional benchmark overall, but the standout defensive asset is precious metals and in particular Gold. In 5 out of the 6 drawdown periods, Gold performed positively, delivering 14.4% per year on average. To put this result in perspective, over those 6 periods, European equities have delivered -35.2%, Min Volatility equities -17.8%, Cash +2.8%, EUR Treasury AAA 8.4% and USD Treasury 11.3%2.
It is worth noting, however, that Energy can also deliver some downside protection when the equity downturn is the result of external shocks such as geopolitical uncertainties. In such, cases Energy and Oil, in particular, tend to react on the upside providing some protection aligned with Gold.
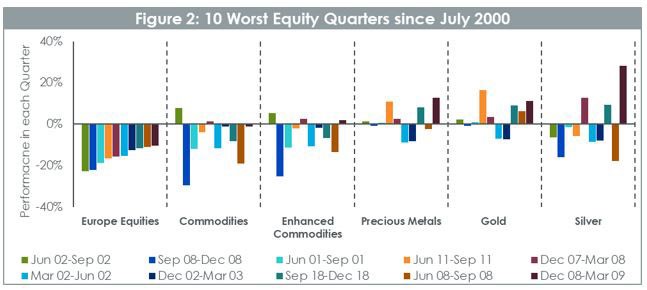
Looking further at the performance of Precious Metals in periods of drawdown we observe in figure 2 that over the 10 worst quarters for European equities in the last 20 years, Gold has 7 quarters of positive performance – a rate of 70%. On average gold outperformed equities by 19% in those quarters. Silver provides results that are more mixed despite outperforming equities by 14% on average. While over the full period commodities didn’t provide a positive return, in 8 of the 10 periods they outperformed equity markets by 8% on average proving that they are still a powerful diversifier. Enhanced Commodities fared even better outperforming equities by 9.6% on average per quarter.
Commodities a chief diversifier
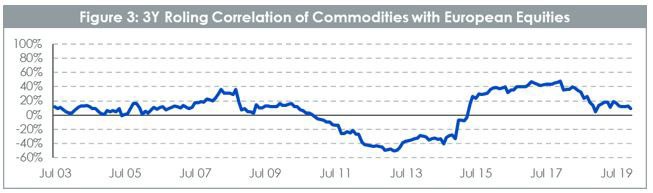
In fact, the rolling 3Y correlation between commodities and equities remains consistently below 50% with long periods where it is nil or even negative. From a pure portfolio construction point of view, this is very exciting as it hands us a diversifying asset that can help reduce the overall volatility of the portfolio.
Gold, a precious tool to build defensive portfolios
From a more macroeconomic perspective and looking at Commodities performance across business cycles, it is again very clear that Precious Metals offer a protection in economic slowdown or recession. In Figure 3, we have split the last 20 years in 4 types of periods using the Organisation for Economic Co-operation and Development (“OECD”) Composite Leading indicator (“CLI”). The CLI has been designed to decrease a few months before economy start to slow down or increase before the economy restarts. So, a strong decline in CLI tends to indicate a probable downturn in equity markets for example.
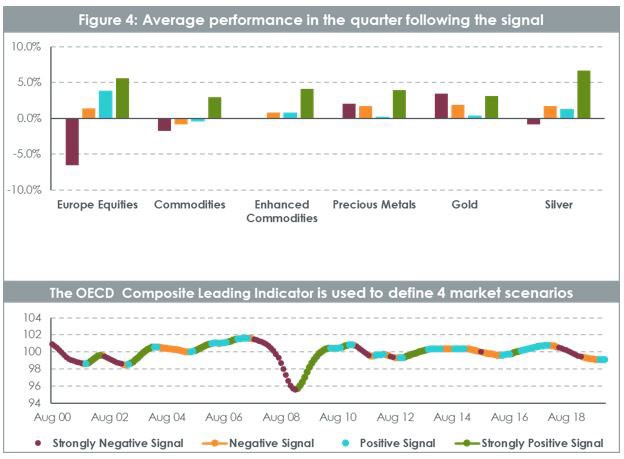
Enhanced Commodities behaved very well compared to front month commodities, cutting significantly the downside in negative economic environments and doing better in positive ones. It is worth noting as well the extent to which commodities and enhanced commodities perform when the economic signals are strong. This is linked to the well documented properties of commodities as an inflation hedge. Precious Metals exhibit a very strong and versatile profile driven mainly by gold.
It is interesting to note that Gold has outperformed very strongly in very negative or negative economic scenarios but also has done very well in periods of strong economic rebound, buoyed by its inflation hedge proprieties. This makes Gold a pretty asymmetric asset with strong positive performance in difficult economic periods but also good performance in strong rebound and when yields are expected to increase. Silver, similarly to palladium and platinum, offers also an interesting payoff, behaving part like a precious metal and part like an industrial metal. In periods where the economy is strong, it benefits from being used in the industry and behave more pro cyclically than gold. However, in economic downturn, it benefits from its status as a precious metal and delivers some protection.
This brings us to our fourth pillar in our framework: valuation. WisdomTree issued its quarterly outlook for Gold in January 2020, offering a number of scenarios fo the metal this year. In “Gold: how we value the precious metal”, we explain how we characterise gold’s past behaviour. Unlike other commodities where the balance of physical supply and demand influence the price, gold behaves more like a pseudo currency, driven by more macroeconomic variables like the interest rate environment, inflation, exchange rates and sentiment. Characterising gold’s past behaviour allows us to project where gold could go in the future (assuming it maintains consistent behaviour) using an internal model. In recent weeks, given the sharp rise in volatility of many asset markets and decisive action by a number of central banks across the globe, we are treading a path that looks like the bull case scenario presented our January 2020 outlooks. That scenario would see gold prices head over US$2000/oz by the end of the year. In that scenario, the Federal Reserve of the US embarks on policy easing (which has already started), that drives Treasury yields lower than where they were in December 2019 (Treasury yields have already broken new all-time lows of 0.35% on March 10th 2020). Inflation in that scenario is at an elevated 2.5% (which is in line with the January 2020 actual reading). Lastly, speculative positioning in gold futures markets remains elevated throughout the course of the year (at 350k contracts net long). In February 2020, we saw speculative positioning hit fresh highs (388k) and at the time of writing (10th March 2020), it remains above the 350k. We caution that if the current shock we are experiencing is temporary, we could get the recent interest rate cuts reversed, Treasury yields could rise to 2% and positing in gold futures could head back to more normal levels (closer to 120k). That was what we presented as a base case in January, where gold would end the year at US$1640/oz. So the downside from the levels ate the time of writing is somewhat limited (with gold trading at US$1650/oz at the time of writing) even if we end up in what was the base case.
This concludes our 6 weeks grand tour of the “natural” defensive assets among the main 4 asset classes. Next week we will start focusing on portfolio construction and on different ideas to design defensive and versatile portfolios.
Europe Equities is proxied by the STOXX Europe 600 net total return index. Broad Commodities (Commo) is proxied by the Bloomberg Commodity Total Return Index. Enhanced Commodities is proxied by Optimized Roll Commodity Total Return Index. Energy is proxied by the Bloomberg Energy subindex Total Return Index. Precious Metals is proxied by the Bloomberg Precious Metals subindex Total Return Index. Industrial Metals is proxied by the Bloomberg Industrial Metals subindex Total Return Index. Livestock is proxied by the Bloomberg Livestock subindex Total Return Index. Softs is proxied by the Bloomberg Softs subindex Total Return Index. Grains is proxied by the Bloomberg Grains subindex Total Return Index. Gold is proxied by the LBMA Gold Price PM Index. Silver is proxied by the LBMA Silver Price index.
By: Pierre Debru, Director, Research
Source
1 WisdomTree, Bloomberg. In EUR.
2 WisdomTree, Bloomberg. In EUR. Europe Equities is proxied by the STOXX Europe 600 net total return index. Min Vol is proxied by MSCI World Min Volatility net total return index. Cash Euro is proxied by a series of daily compounded Eonia. EUR Treasury AAA is proxied by the Bloomberg Barclays EUR Aggregate Treasury AAA total return index. USD Treasury is proxied by the Bloomberg Barclays USD Treasury total return index.

Brent crude has climbed roughly USD 1.5-2 per barrel since Friday, yet falling USD 0.3 per barrel this mornig and currently trading near USD 67.25/bbl after yesterday’s climb. While the rally reflects short-term geopolitical tension, price action has been choppy, and crude remains locked in a broader range – caught between supply-side pressure and spot resilience.

Prices have been supported by renewed Ukrainian drone strikes targeting Russian infrastructure. Over the weekend, falling debris triggered a fire at the 20mtpa Kirishi refinery, following last week’s attack on the key Primorsk terminal.
Argus estimates that these attacks have halted ish 300 kbl/d of Russian refining capacity in August and September. While the market impact is limited for now, the action signals Kyiv’s growing willingness to disrupt oil flows – supporting a soft geopolitical floor under prices.
The political environment is shifting: the EU is reportedly considering sanctions on Indian and Chinese firms facilitating Russian crude flows, while the U.S. has so far held back – despite Bessent warning that any action from Washington depends on broader European participation. Senator Graham has also publicly criticized NATO members like Slovakia and Hungary for continuing Russian oil imports.
It’s worth noting that China and India remain the two largest buyers of Russian barrels since the invasion of Ukraine. While New Delhi has been hit with 50% secondary tariffs, Beijing has been spared so far.
Still, the broader supply/demand balance leans bearish. Futures markets reflect this: Brent’s prompt spread (gauge of near-term tightness) has narrowed to the current USD 0.42/bl, down from USD 0.96/bl two months ago, pointing to weakening backwardation.
This aligns with expectations for a record surplus in 2026, largely driven by the faster-than-anticipated return of OPEC+ barrels to market. OPEC+ is gathering in Vienna this week to begin revising member production capacity estimates – setting the stage for new output baselines from 2027. The group aims to agree on how to define “maximum sustainable capacity,” with a proposal expected by year-end.
While the IEA pegs OPEC+ capacity at 47.9 million barrels per day, actual output in August was only 42.4 million barrels per day. Disagreements over data and quota fairness (especially from Iraq and Nigeria) have already delayed this process. Angola even quit the group last year after being assigned a lower target than expected. It also remains unclear whether Russia and Iraq can regain earlier output levels due to infrastructure constraints.
Also, macro remains another key driver this week. A 25bp Fed rate cut is widely expected tomorrow (Wednesday), and commodities in general could benefit a potential cut.
Summing up: Brent crude continues to drift sideways, finding near-term support from geopolitics and refining strength. But with surplus building and market structure softening, the upside may remain capped.
Brent crude is essentially flat on the week, but after a volatile ride. Prices started Monday near USD 65.5/bl, climbed steadily to a mid-week high of USD 67.8/bl on Wednesday evening, before falling sharply – losing about USD 2/bl during Thursday’s session.
Brent is currently trading around USD 65.8/bl, right back where it began. The volatility reflects the market’s ongoing struggle to balance growing surplus risks against persistent geopolitical uncertainty and resilient refined product margins. Thursday’s slide snapped a three-day rally and came largely in response to a string of bearish signals, most notably from the IEA’s updated short-term outlook.
The IEA now projects record global oversupply in 2026, reinforcing concerns flagged earlier by the U.S. EIA, which already sees inventories building this quarter. The forecast comes just days after OPEC+ confirmed it will continue returning idle barrels to the market in October – albeit at a slower pace of +137,000 bl/d. While modest, the move underscores a steady push to reclaim market share and adds to supply-side pressure into year-end.
Thursday’s price drop also followed geopolitical incidences: Israeli airstrikes reportedly targeted Hamas leadership in Doha, while Russian drones crossed into Polish airspace – events that initially sent crude higher as traders covered short positions.
Yet, sentiment remains broadly cautious. Strong refining margins and low inventories at key pricing hubs like Europe continue to support the downside. Chinese stockpiling of discounted Russian barrels and tightness in refined product markets – especially diesel – are also lending support.
On the demand side, the IEA revised up its 2025 global demand growth forecast by 60,000 bl/d to 740,000 bl/d YoY, while leaving 2026 unchanged at 698,000 bl/d. Interestingly, the agency also signaled that its next long-term report could show global oil demand rising through 2050.
Meanwhile, OPEC offered a contrasting view in its latest Monthly Oil Market Report, maintaining expectations for a supply deficit both this year and next, even as its members raise output. The group kept its demand growth estimates for 2025 and 2026 unchanged at 1.29 million bl/d and 1.38 million bl/d, respectively.
We continue to watch whether the bearish supply outlook will outweigh geopolitical risk, and if Brent can continue to find support above USD 65/bl – a level increasingly seen as a soft floor for OPEC+ policy.
Brent crude makes some gains as Israel’s attack on Hamas in Qatar rattles markets. Brent crude spiked to a high of USD 67.38/b yesterday as Israel made a strike on Hamas in Qatar. But it wasn’t able to hold on to that level and only closed up 0.6% in the end at USD 66.39/b. This morning it is starting on the up with a gain of 0.9% at USD 67/b. Still rattled by Israel’s attack on Hamas in Qatar yesterday. Brent is getting some help on the margin this morning with Asian equities higher and copper gaining half a percent. But the dark cloud of surplus ahead is nonetheless hanging over the market with Brent trading two dollar lower than last Tuesday.

Geopolitical risk premiums in oil rarely lasts long unless actual supply disruption kicks in. While Israel’s attack on Hamas in Qatar is shocking, the geopolitical risk lifting crude oil yesterday and this morning is unlikely to last very long as such geopolitical risk premiums usually do not last long unless real disruption kicks in.
US API data yesterday indicated a US crude and product stock build last week of 3.1 mb. The US API last evening released partial US oil inventory data indicating that US crude stocks rose 1.3 mb and middle distillates rose 1.5 mb while gasoline rose 0.3 mb. In total a bit more than 3 mb increase. US crude and product stocks usually rise around 1 mb per week this time of year. So US commercial crude and product stock rose 2 mb over the past week adjusted for the seasonal norm. Official and complete data are due today at 16:30.
A 2 mb/week seasonally adj. US stock build implies a 1 – 1.4 mb/d global surplus if it is persistent. Assume that if the global oil market is running a surplus then some 20% to 30% of that surplus ends up in US commercial inventories. A 2 mb seasonally adjusted inventory build equals 286 kb/d. Divide by 0.2 to 0.3 and we get an implied global surplus of 950 kb/d to 1430 kb/d. A 2 mb/week seasonally adjusted build in US oil inventories is close to noise unless it is a persistent pattern every week.
US IEA STEO oil report: Robust surplus ahead and Brent averaging USD 51/b in 2026. The US EIA yesterday released its monthly STEO oil report. It projected a large and persistent surplus ahead. It estimates a global surplus of 2.2 m/d from September to December this year. A 2.4 mb/d surplus in Q1-26 and an average surplus for 2026 of 1.6 mb/d resulting in an average Brent crude oil price of USD 51/b next year. And that includes an assumption where OPEC crude oil production only averages 27.8 mb/d in 2026 versus 27.0 mb/d in 2024 and 28.6 mb/d in August.
Brent will feel the bear-pressure once US/OECD stocks starts visible build. In the meanwhile the oil market sits waiting for this projected surplus to materialize in US and OECD inventories. Once they visibly starts to build on a consistent basis, then Brent crude will likely quickly lose altitude. And unless some unforeseen supply disruption kicks in, it is bound to happen.
US IEA STEO September report. In total not much different than it was in January

US IEA STEO September report. US crude oil production contracting in 2026, but NGLs still growing. Close to zero net liquids growth in total.


Tyskland har så höga elpriser att företag inte har råd att använda elektricitet
Brent crude ticks higher on tension, but market structure stays soft

Kinas elproduktion slog nytt rekord i augusti, vilket även kolkraft gjorde

Det stigande guldpriset en utmaning för smyckesköpare

Aktier i guldbolag laggar priset på guld

Meta bygger ett AI-datacenter på 5 GW och 2,25 GW gaskraftverk
Aker BP gör ett av Norges största oljefynd på ett decennium, stärker resurserna i Yggdrasilområdet

Ett samtal om koppar, kaffe och spannmål
Brent sideways on sanctions and peace talks
Sommarens torka kan ge högre elpriser i höst
-
 Nyheter4 veckor sedan
Meta bygger ett AI-datacenter på 5 GW och 2,25 GW gaskraftverk
-
 Nyheter4 veckor sedan
Aker BP gör ett av Norges största oljefynd på ett decennium, stärker resurserna i Yggdrasilområdet
-
 Nyheter4 veckor sedan
Ett samtal om koppar, kaffe och spannmål
-
Analys4 veckor sedan
Brent sideways on sanctions and peace talks
-
 Nyheter4 veckor sedan
Sommarens torka kan ge högre elpriser i höst
-
Analys4 veckor sedan
Brent edges higher as India–Russia oil trade draws U.S. ire and Powell takes the stage at Jackson Hole
-

 Nyheter3 veckor sedan
Mahvie Minerals är verksamt i guldrikt område i Finland
-
Analys3 veckor sedan
Increasing risk that OPEC+ will unwind the last 1.65 mb/d of cuts when they meet on 7 September