

Analys
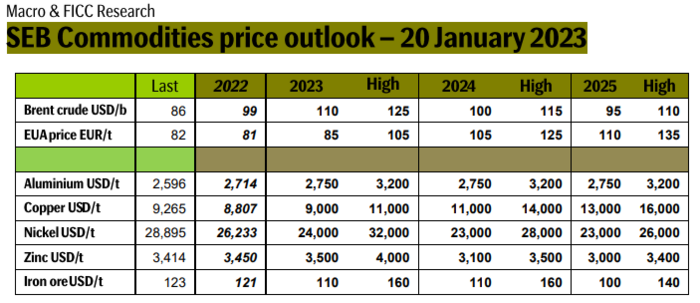
SEB Metals Weekly: China Covid exit is bullish for metals

China Covid exit is bullish for metals
Softer inflation, slight macro-optimism, and China taking a rapid exit from Covid restrictions. Markets have become more optimistic. Inflation indices have eased and that has created some hopes that central banks won’t lift interest to a level that will kill the economy in 2023. Natural gas prices in Europe have fallen sharply. This has suddenly reduced energy-inflationary pressure and removed the direst downside economic risks for the region. But general market optimism is far from super-strong yet. The S&P 500 index has only gained 1.9% since our previous forecast on 1 Nov 2021, and oil prices are down nearly 10% in a reflection of concerns for global growth. China has however removed all Covid-restrictions almost overnight. It is now set to move out of its three years of Covid-19 isolation and lockdowns at record speed. Industrial metals are up 20% and the Hong Kong equity index is up 40% as a result (since 1 Nov-22). China’s sudden and rapid Covid-19 exit is plain and simply bullish for the Chinese economy to the point that mobility indices are already rebounding quickly. SEB’s general view is that inflation impulses will fade quickly. No need then for central banks across the world to kill the global economy with further extreme rate hikes. These developments have removed much of the downside price risks for metals in 2023 and we have to a large degree shifted our 2024 forecast to 2023.
Lower transparency, more geopolitics, more borders, and higher prices and exponential spikes. The first decade of this century was about emerging markets, the BRICs, the commodity price boom, the commodity investment boom, and free markets with free flow of commodities and labor with China and Russia hand in hand with western countries walking towards the future. High capex spending in the first decade led to plentiful supply and low prices for commodities from 2011 to 2020. A world of plenty, friends everywhere, free flow of everything, and no need to worry. The coming decade will likely be very different. Supply growth will struggle due to mediocre capex spending over the past 10 years. Prices will on average be significantly higher. There will be frequent exponential price spikes whenever demand hits supply barriers. Price transparency will be significantly reduced due to borders, taxes, sanctions, geopolitical alignments, and carbon intensities. Prices will be much less homogenous. Aluminium will no longer be just one price and one quality. Who made it, where was it made, where will it be consumed and what the carbon content will create a range of prices. Same for most other metals.
Copper: Struggling supply and China revival propel copper prices higher. Unrest in Peru is creating significant supply risks for copper as the country accounts for 10% of the global supply. Chile accounts for 27% of global production. Production there is disappointing with Codelco, the Chilean state-owned copper mining company, struggling to hit production targets. The Cobre Panama mine in Panama is at risk of being closed over a tax dispute between Quantum and the government. Cobre Panama is one of the biggest new mines globally over the past 10 years. The rapid exit from Covid restrictions in China is bullish for the Chinese economy and thus for copper demand and it has helped to propel prices higher along with the mentioned supply issues. The Chinese property market will continue to struggle, and it normally accounts for 20% of global copper demand while China accounted for 55% of global copper demand in 2021. While China is no longer prioritizing the housing market it is full speed ahead for solar, wind, EVs, and electrification in general. So, weakening Chinese copper demand from housing will likely be replaced by the new prioritized growth sectors. Global supply growth is likely going to be muted in the decade to come while demand growth will be somewhere between a normal 3% pa. to a strong 4% pa. to a very strong 5% pa. Copper prices will be high, and demand will hit the supply barrier repeatedly with exponential spikes as the world is working hard to accelerate the energy transition. Copper prices could easily spike to USD 15-16,000/ton nearest years.
Nickel: Tight high-quality nickel market but a surplus for a low-quality nickel. Nickel production is growing aggressively in Indonesia. The country is projected to account for 60-70% of global supply in 2030. This will become a huge and extremely concentrated geopolitical risk for the world’s consumers of nickel. Indonesia has an abundance of low-grade C2 nickel. The challenge is to convert low-quality C2 nickel to high-quality C1. We are set for a surplus of C2 nickel but the market for C1 nickel will depend strongly on the conversion capacity for C2 to C1. Low price transparency will also help to send prices flying between USD 20,000/ton and USD 30,000/ton. Strong growth in nickel production in Indonesia should initially call for prices down to USD 20,000/ton. But Indonesia is a price setter. It will account for 50% of global supply in 2023. It doesn’t make sense for Indonesia to kill the nickel price. If the nickel price drops, then Indonesia could quickly regulate supply. There should be a premium to nickel due to this. As a result, we expect the nickel price to average USD 24,000/ton in 2023. C2 to C1 conversion capacity may be strained and there should also be a monopoly premium due to the size of Indonesia. Converting C2 to C1 is however extremely carbon intensive and that could be an increasing issue in the years to come.
Zinc: Super-tight global market. European LME inventories are ZERO and zinc smelters there are still closed. European zinc smelters account for 16% of global zinc smelter capacity. Most of this was closed over the past year due to extremely high energy prices. European LME zinc stockpiles are now down to a stunning zero! The global zinc market is extremely tight. Reopening of European zinc smelting seems unlikely in H1-23 with a continued super-tight market as a result both in Europe and globally.
Aluminium: Price likely to be in the range of USD 2400 – 3200/ton and line with coal prices in China. Aluminium prices have historically been tightly tied to the price of coal. But coal prices have been all over the place since the start of 2021 with huge price differences between Amsterdam, Australia, and domestic Chinese coal prices which are now largely state-controlled. China banning imports of Australian coal, the Chinese energy crisis in 2021, and Russia’s invasion of Ukraine in 2022 are ingredients here. This sent aluminium prices flying high and low. Coal prices in China today imply a price of aluminium between USD 2400/ton and 3150/ton with the LME 3mth aluminium price nicely in between at USD 2590/ton. The global coal market should now become more orderly as China now again is accepting Australian coal. Energy costs have fallen sharply in Europe and some producers in the Netherlands have talked about possible restarts of production. China is likely to reduce its exports of primary aluminium. Energy security of supply is high on the agenda in China, and it makes no sense to emit lots of CO2 in China and indirectly export energy in the form of primary aluminium. Growth in non-China aluminium demand in the years to come will have to be covered by non-China producers which have the potential to force prices higher and away from coal as the price driver. While LME has one price for the 3mth aluminium price we’ll likely get larger and larger price differences across the world in the form of possibly extreme price premiums for example in the EU and the US.
Wild moves yesterday. Brent crude traded to a high of $114.43/b and a low of $96.0/b and closed at $99.94/b yesterday.

US – Iran negotiations ongoing or not? What a day. Donald Trump announced that good talks were ongoing between Iran and the US and that the 48 hour deadline before bombing Iranian power plants and energy infrastructure was postponed by five days subject to success of ongoing meetings. Iranian media meanwhile stated that no meetings were ongoing at all.
Today we are scratching our heads trying to figure out what yesterday was all about.
Friends and family playing the market? Was it just Trump and his friends and family who were playing with oil and equity markets with $580m and $1.46bn in bets being placed by someone in oil and equity markets just 15 minutes before Trump’s announcement?
Was Trump pulling a TACO as he reached his political and economic pain point: Brent at $112/b, US Gas at $4/gal, SPX below 200dma and US 10yr above 4.4%?
Different Iranian factions with Trump talking with one of them? Are there real negotiations going on but with the US talking to one faction in Iran while another, the hardliners, are not involved and are denying any such negotiations going on?
Extending the ultimatum to attack and invade Kharg island next weekend? Or, is the five day delay of the deadline a tactical decision to allow US amphibious assault ships and marines to arrive in the Gulf in the upcoming weekend while US and Israeli continues to degrade Iranian military targets till then. And then next weekend a move by the US/Israel to attack and conquer for example the Kharg island?
We do not really know which it is or maybe a combination of these.
We did get some kind of TACO ydy. But markets have been waiting for some kind of TACO to happen and yesterday we got some kind of TACO. And Brent crude is now trading at $101.5/b as a result rather than at $112-114/b as it did no the high yesterday.
But what really matters in our view is the political situation on the ground in Iran. Will hardliners continue to hold power or will a more pragmatic faction gain power?
If the hardliners remain in power then oil pain should extend all the way to US midterm elections. The hardliners were apparently still in charge as of last week. Iran immediately retaliated and damaged LNG infrastructure in Qatar after Israel hit Iranian South Pars. The SoH was still closed and all messages coming out of Iran indicated defiance. Hardliners continues in power has a huge consequence for oil prices going forward. The regime has played its ’oil-weapon’ (closing or chocking the Strait of Hormuz). It is using it to achieve political goals. Deterrence: it needs to be so politically and economically expensive to attack Iran that it won’t happen again in the future. Or at least that the US/Israel thinks 10-times over before they attack again. The highest Brent crude oil closing price since the start of the war is $112.19/b last Friday. In comparison the 20-year inflation adjusted Brent price is $103/b. So Brent crude last Friday at $112.19/b isn’t a shockingly high price. And it is still far below the nominal high of $148/b from 2008 which is $220/b if inflation adjusted. So once in a lifetime Iran activates its most powerful weapon. The oil weapon. It needs to show the power of this weapon and it needs to reap political gains. Getting Brent to $112/b and intraday high of $119.5/b (9 March) isn’t a display of the power of that weapon. And it is not a deterrence against future attacks.
So if the hardliners remain in power in Iran, then the SoH will likely remain chocked all the way to US midterm elections and Brent crude will at a minimum go above the historical nominal high of $148/b from 2008.
Thus the outlook for the oil price for the rest of the year doesn’t depend all that much of whether Trump pulls a TACO or not. Stops bombing or not. It depends more on who is in charge in Iran. If it is the hardliners, then deterrence against future attacks via chocking of the SoH and high oil prices is the likely line of action. It is impacting the world but the Iranian ’oil-weapon’ is directed towards the US president and the the US midterm elections.
If a pragmatic faction gets to power in Iran, then a very prosperous future is possible. However, if power is shifting towards a more pragmatic faction in Iran then a completely different direction could evolve. Such a faction could possibly be open for cooperation with the US and the GCC and possibly put its issues versus Israel aside. Then the prosperity we have seen evolving in Dubai could be a possible future also for Iran.
So far it looks like the hardliners are fully in charge. As far as we can see, the hardliners are still fully in control in Iran. That points towards continued chocking of the SoH and oil prices ticking higher as global inventories (the oil market buffers) are drawn lower. And not just for a few more weeks, but possibly all the way to the US midterm elections.
A brief sigh of relief yesterday as oil infra at Kharg wasn’t damaged. But higher today. Brent crude dabbled around a bit yesterday in relief that oil infrastructure at Iran’s Kharg island wasn’t damaged. It traded briefly below the 100-line and in a range of $99.54 – 106.5/b. Its close was near the low at $100.21/b.
No easy victorious way out for Trump. So no end in sight yet. Brent is up 3.2% today to $103.4/b with no signs that the war will end anytime soon. Trump has no easy way to declare victory and mission accomplished as long as Iran is in full control of the Strait of Hormuz while also holding some 440 kg of uranium enriched to 60% and not far from weapons grade at 90%. As long as these two factors are unresolved it is difficult for Trump to pull out of the Middle East. Naturally he gets increasingly frustrated over the situation as the oil price and US retail gas prices keeps ticking higher while the US is tied into the mess in the Middle East. Trying to drag NATO members into his mess but not much luck there.
When commodity prices spike they spike 2x, 3x, 4x or 5x. Supply and demand for commodities are notoriously inflexible. When either of them shifts sharply, the the price can easily go to zero (April 2022) or multiply 2x, 3x, or even 5x of normal. Examples in case cobalt in 2025 where Kongo restricted supply and the price doubled. Global LNG in 2022 where the price went 5x normal for the full year average. Demand for tungsten in ammunition is up strongly along with full war in the middle east. And its price? Up 537%.
Why hasn’t the Brent crude oil price gone 2x, 3x, 4x or 5x versus its normal of $68/b given close to full stop in the flow of oil of the Strait of Hormuz? We are after all talking about close to 20% of global supply being disrupted. The reason is the buffers. It is fairly easy to store oil. Commercial operators only hold stocks for logistical variations. It is a lot of oil in commercial stocks, but that is predominantly because the whole oil system is so huge. In addition we have Strategic Petroleum Reserves (SPRs) of close to 2500 mb of crude and 1000 mb of oil products. The IEA last week decided to release 400 mb from global SPR. Equal to 20 days of full closure of the Strait of Hormuz. Thus oil in commercial stocks on land, commercial oil in transit at sea and release of oil from SPRs is currently buffering the situation.
But we are running the buffers down day by day. As a result we see gradually increasing stress here and there in the global oil market. Asia is feeling the pinch the most. It has very low self sufficiency of oil and most of the exports from the Gulf normally head to Asia. Availability of propane and butane many places in India (LPG) has dried up very quickly. Local prices have tripled as a result. Local availability of crude, bunker oil, fuel oil, jet fuel, naphtha and other oil products is quickly running down to critical levels many places in Asia with prices shooting up. Oman crude oil is marked at $153/b. Jet fuel in Singapore is marked at $191/b.
Oil at sea originating from Strait of Hormuz from before 28 Feb is rapidly emptied. Oil at sea is a large pool of commercial oil. An inventory of oil in constant move. If we assume that the average journey from the Persian Gulf to its destinations has a volume weighted average of 13.5 days then the amount of oil at sea originating from the Persian Gulf when the the US/Israel attacked on 28 Feb was 13.5 days * 20 mb/d = 269 mb. Since the strait closed, this oil has increasingly been delivered at its destinations. Those closest to the Strait, like Pakistan, felt the emptying of this supply chain the fastest. Propane prices shooting to 3x normal there already last week and restaurants serving cold food this week is a result of that. Some 50-60% of Asia’s imports of Naphtha normally originates from the Persian Gulf. So naphtha is a natural pain point for Asia. The Gulf also a large and important exporter of Jet fuel. That shut in has lifted jet prices above $200/b.
To simplify our calculations we assume that no oil has left the Strait since that date and that there is no increase in Saudi exports from Yanbu. Then the draining of this inventory at sea originated from the Persian Gulf will essentially look like this:
The supply chain of oil at sea originating from the Strait of Hormuz is soon empty. Except for oil allowed through the Strait of Hormuz by Iran and increased exports from Yanbu in the Red Sea. Not included here.

Oil at sea is falling fast as oil is delivered without any new refill in the Persian Gulf. Waivers for Russian crude is also shifting Russian crude to consumers. Brent crude will likely start to feel the pinch much more forcefully when oil at sea is drawn down another 200 mb to around 1000 mb. That is not much more than 10 days from here.

Oil and oil products are starting to become very pricy many places. Brent crude has still been shielded from spiking like the others.

Closing at highest since Aug 2022. Brent crude gained 9.2% yesterday. The trading range was limited to $95.2 – 101.85/b with a close at $100.46/b and higher than the Monday close of $98.96/b. Ydy close was the highest close since August 2022. This morning Brent is up 2% to $102.4/b and is trading at the highest intraday level since Monday when it high an intraday high of $119.5/b.
A military hit at Iran’s Kharg island would be a big, big bang for the oil price. The big, big risk for the weekend is that oil infrastructure could be damaged. For example Iran’s Kharg island which is Iran’s major oil export hub. If damaged we would have a longer lasting loss of supply stretching way beyond Trump’s announced ”two more weeks”. It will make the spot price spike higher and it will lift the curve. Brent crude 2027 swap would jump above $80/b immediately. An attack on Kharg island would naturally lead Iran to strike back at other oil infrastructures in the Gulf. Especially those belonging to countries who harbor US military bases. I.e. countries who essentially are supporting the attack by US and Israel towards Iran. Though if not in spirit, then in practical operational terms. An attack on Kharg island would not just lead to a lasting outage of supply from Iran until it would be repaired. It would immediately endanger other oil infrastructure in the region as well and additional lasting loss of supply.
No one in their right mind would dare to sit short oil over the coming weekend. Oil is thus set to close the week at a very strong note today.
Prepare for another 400 mb SPR release next week. This week’s announcement of a 400 mb release from Strategic Oil Reserves totally underwhelmed the market with the oil price going higher rather than lower following the announcement. For one it means that the market expects the war and the closure of the Strait of Hormuz to last longer than Trump’s recent announced ”two more weeks”. 400 mb only amounts to 20 days of lost supply to the world through Hormuz and we are already at day 14. So next week when we are getting close to the 20 day mark, we are likely to see another announcement of another 400 mb release of SPR stocks to the market. Preparing for the next 20 days of war.
Global oil logistics in total disarray. We have previously addressed the issue of the huge logistical web of the global oil market which is now in total disarray. The logistical disruption started to fry the oil market at the end of last week. Helped to spike the oil market on Monday. What we hear from our shipping clients is that the problems with supply of fuels locally in Korea, Singapore, India and Africa are getting worse with physical availability of fuels there drying up. It is getting increasingly difficult to find physical supply of bunker oil with local, physical prices shooting way higher than financial benchmarks. To the point that biofuels have become the cheap option many places. Availability of fuels in the US is still good. Not so surprising as the US is self-sufficient with crude and refineries.
The disruption in global oil logistics doesn’t seem to improve. Rather the opposite. If you cannot get fuel to run your ships, then how can you distribute fuels to where it is needed.
Buy Brent Dec-2026 calls with strike $150/b!! As the days goes by the oil price is ticking higher while Trump is getting one day closer to US midterm elections. Trump was betting that he could put this war to bead well before November. But that will probably not be up to him to decide. It will be up to Iran to decide when to reopen the Strait of Hormuz. It is very hard to imagine that Iran will let Trump easily off the hock after he has killed its Supreme Leader. This will likely go all the way to November. Buy Brent Dec-2026 calls with strike $150/b!!
Brent closed at highest since 2022 ydy. Will end this Friday at a very strong note! Consumers still dreaming of $60/b oil


Christian Kopfer om läget för oljan

Marknaden måste börja betrakta de höga kopparpriserna som det nya normala

Det fysiska spotpriset på brentolja har slagit nytt rekord

40 minuter med Javier Blas om hur världen verkligen påverkas av energikrisen

Efter tillväxten: Guldbrev satsar på expansion i Europa
40 minuter med Javier Blas om hur världen verkligen påverkas av energikrisen

Elpriserna fördubblas, stor osäkerhet inför sommaren

MP Materials, USA:s svar på Kinas dominans över sällsynta jordartsmetaller
Det fysiska spotpriset på brentolja har slagit nytt rekord

Studsvik har idag ansökt om att få bygga 1200-1600 MW kärnkraft i Valdemarsvik
-
 Nyheter2 veckor sedan
40 minuter med Javier Blas om hur världen verkligen påverkas av energikrisen
-
 Nyheter3 veckor sedan
Elpriserna fördubblas, stor osäkerhet inför sommaren
-
 Nyheter4 veckor sedan
MP Materials, USA:s svar på Kinas dominans över sällsynta jordartsmetaller
-
 Nyheter2 veckor sedan
Det fysiska spotpriset på brentolja har slagit nytt rekord
-
 Nyheter4 veckor sedan
Studsvik har idag ansökt om att få bygga 1200-1600 MW kärnkraft i Valdemarsvik
-
 Nyheter2 veckor sedan
Marknaden måste börja betrakta de höga kopparpriserna som det nya normala
-

 Nyheter4 veckor sedan
Matproduktion är beroende av gödsel, Gulfkriget skapar brist
-
Analys4 veckor sedan
TACO (or Whatever It Was) Sends Oil Lower — Iran Keeps Choking Hormuz