

Analys
El Niño: the impact on agricultural commodities
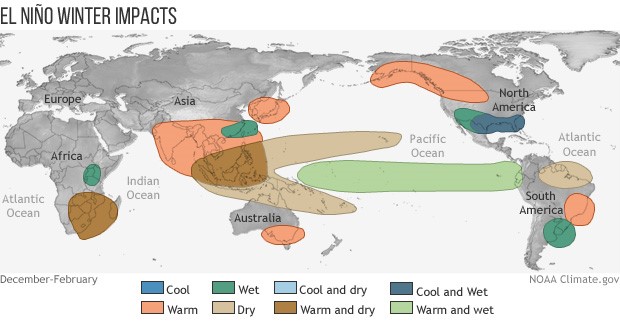
 El Niño refers to a climate cycle in the Pacific Ocean that has a global impact on weather patterns. The name, which loosely translates to ‘Christ child’, traces its origin back to Peruvian fisherman in the 1600s, who observed that fish yields would often decline around Christmas time as sea water temperatures rose. The effects of El Niño include specific wind patterns across the Pacific Ocean, heavy rain in South America, and droughts in Australia and parts of Asia including India and Indonesia.
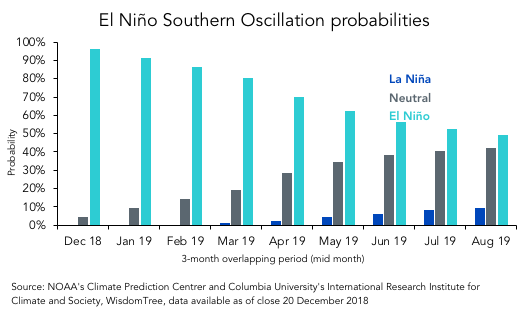
With the National Oceanic and Atmospheric Administration (NOAA) forecasting a 96% probability of an El Niño weather event during the current Northern Hemisphere winter, there is a strong chance that we could see some weather abnormalities in the coming months.
Figure 1. The probability of El Niño occurring this year
Why El Niño matters for agricultural commodity prices
El Niño can have a significant impact on the fortunes of the agricultural industry, as the growing of agricultural products is highly sensitive to weather patterns. The right amount of sun and rain at the right time is important to produce the optimal yield. For example, droughts can ruin a crop because of insufficient water, while floods can wash away plants, or delay the process of harvesting a good crop from the ground, causing it to spoil.
While El Niño can have a considerable effect on agricultural commodity prices, the specific impact on the price of any individual commodity will depend on the El Niño’s amplitude and timing, as well as locational factors such as where the crop is grown and how prepared the farmers are for extreme conditions.
Figure 2. Weather impact of El Niño
Analysing the impact on agricultural commodity prices
When assessing likely El Niño effects, the first step is to consider the time of the year that El Niño is likely to begin. In this case, the NOAA believes that the event is likely to arrive in the Northern Hemisphere winter this year, but there is a good chance that it could linger into the Northern Hemisphere summer with a lower intensity. The next step is to assess which part of the crop cycle it will affect. According to research by Iizumi et al., a weather disturbance during the ‘reproductive’ growth period of the crop cycle tends to have the largest impact on crop yields.
Using insights from Iizumi et al. we have assessed the possible near-term impact from an El Niño on crops that are in the reproductive phase of growth. We summarise our key thoughts below:
Bullish on sugar, cocoa, and wheat
Agricultural commodities that we are bullish on in the event of an El Niño include sugar, cocoa, and wheat.
Sugar production is highly concentrated in India and certain regions of Brazil. If El Niño occurs, it’s likely that both countries could see below-average rainfall and drier conditions, and this could drive prices higher.
Indonesia, which produces 10% of global cocoa supply, could also be directly affected by an El Niño, and dry warm weather in Indonesia could potentially drive cocoa prices higher.
Australia, which produces 4% of global wheat supply, is another country that could face dry weather if El Niño emerges. This could have a positive impact on wheat prices, although much of the wheat harvest is expected to be completed by mid-January, which should limit the impact of an El Niño.
Bearish on soybean, corn and Arabica coffee
In contrast, we are bearish on soybean, corn, and Arabica coffee.
Brazil and Argentina, who together are responsible for almost half of the world’s soybean supply, are likely to experience favourable growing conditions in the event of an El Niño. As such, an El Niño could prove to be price negative for soybean prices.
Figure 3. The effect of El Niño on soybean growing during the December to March reproductive growth phase
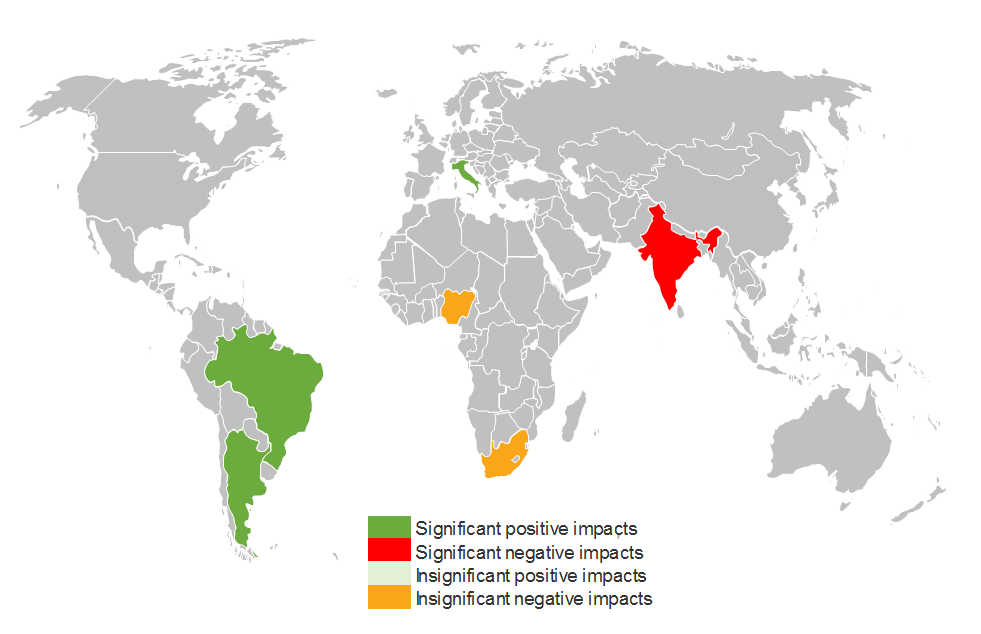
Source: Adapted by WisdomTree from “Impacts of Southern Oscillation on the global yields of major crops” by Iizumi et al, May 2014
The effects of El Niño on corn are less significant, but could be mildly positive for growing conditions in South America and parts of Australia, and hence slightly price bearish.
Arabica coffee production is highly concentrated in Brazil, Mexico, Colombia and Central America. These countries could experience favourable growing conditions, and given that most of the coffee in these regions will be in a reproductive growth phase in the months ahead, we could see a positive supply shock to the commodity, which would be bearish for prices.
Other factors
We caution that the analysis above is based on the pure effect of an El Niño event and does not consider the many other factors that can impact crop yields. We’ll also point out that agricultural commodity prices can be affected by a number of other developments such as exchange-rate movements and trade policies. However, the analysis is useful as a rough guide as to how commodity prices could potentially be affected if we do experience an El Niño event in the near term.


Brent crude has climbed roughly USD 1.5-2 per barrel since Friday, yet falling USD 0.3 per barrel this mornig and currently trading near USD 67.25/bbl after yesterday’s climb. While the rally reflects short-term geopolitical tension, price action has been choppy, and crude remains locked in a broader range – caught between supply-side pressure and spot resilience.

Prices have been supported by renewed Ukrainian drone strikes targeting Russian infrastructure. Over the weekend, falling debris triggered a fire at the 20mtpa Kirishi refinery, following last week’s attack on the key Primorsk terminal.
Argus estimates that these attacks have halted ish 300 kbl/d of Russian refining capacity in August and September. While the market impact is limited for now, the action signals Kyiv’s growing willingness to disrupt oil flows – supporting a soft geopolitical floor under prices.
The political environment is shifting: the EU is reportedly considering sanctions on Indian and Chinese firms facilitating Russian crude flows, while the U.S. has so far held back – despite Bessent warning that any action from Washington depends on broader European participation. Senator Graham has also publicly criticized NATO members like Slovakia and Hungary for continuing Russian oil imports.
It’s worth noting that China and India remain the two largest buyers of Russian barrels since the invasion of Ukraine. While New Delhi has been hit with 50% secondary tariffs, Beijing has been spared so far.
Still, the broader supply/demand balance leans bearish. Futures markets reflect this: Brent’s prompt spread (gauge of near-term tightness) has narrowed to the current USD 0.42/bl, down from USD 0.96/bl two months ago, pointing to weakening backwardation.
This aligns with expectations for a record surplus in 2026, largely driven by the faster-than-anticipated return of OPEC+ barrels to market. OPEC+ is gathering in Vienna this week to begin revising member production capacity estimates – setting the stage for new output baselines from 2027. The group aims to agree on how to define “maximum sustainable capacity,” with a proposal expected by year-end.
While the IEA pegs OPEC+ capacity at 47.9 million barrels per day, actual output in August was only 42.4 million barrels per day. Disagreements over data and quota fairness (especially from Iraq and Nigeria) have already delayed this process. Angola even quit the group last year after being assigned a lower target than expected. It also remains unclear whether Russia and Iraq can regain earlier output levels due to infrastructure constraints.
Also, macro remains another key driver this week. A 25bp Fed rate cut is widely expected tomorrow (Wednesday), and commodities in general could benefit a potential cut.
Summing up: Brent crude continues to drift sideways, finding near-term support from geopolitics and refining strength. But with surplus building and market structure softening, the upside may remain capped.
Brent crude is essentially flat on the week, but after a volatile ride. Prices started Monday near USD 65.5/bl, climbed steadily to a mid-week high of USD 67.8/bl on Wednesday evening, before falling sharply – losing about USD 2/bl during Thursday’s session.
Brent is currently trading around USD 65.8/bl, right back where it began. The volatility reflects the market’s ongoing struggle to balance growing surplus risks against persistent geopolitical uncertainty and resilient refined product margins. Thursday’s slide snapped a three-day rally and came largely in response to a string of bearish signals, most notably from the IEA’s updated short-term outlook.
The IEA now projects record global oversupply in 2026, reinforcing concerns flagged earlier by the U.S. EIA, which already sees inventories building this quarter. The forecast comes just days after OPEC+ confirmed it will continue returning idle barrels to the market in October – albeit at a slower pace of +137,000 bl/d. While modest, the move underscores a steady push to reclaim market share and adds to supply-side pressure into year-end.
Thursday’s price drop also followed geopolitical incidences: Israeli airstrikes reportedly targeted Hamas leadership in Doha, while Russian drones crossed into Polish airspace – events that initially sent crude higher as traders covered short positions.
Yet, sentiment remains broadly cautious. Strong refining margins and low inventories at key pricing hubs like Europe continue to support the downside. Chinese stockpiling of discounted Russian barrels and tightness in refined product markets – especially diesel – are also lending support.
On the demand side, the IEA revised up its 2025 global demand growth forecast by 60,000 bl/d to 740,000 bl/d YoY, while leaving 2026 unchanged at 698,000 bl/d. Interestingly, the agency also signaled that its next long-term report could show global oil demand rising through 2050.
Meanwhile, OPEC offered a contrasting view in its latest Monthly Oil Market Report, maintaining expectations for a supply deficit both this year and next, even as its members raise output. The group kept its demand growth estimates for 2025 and 2026 unchanged at 1.29 million bl/d and 1.38 million bl/d, respectively.
We continue to watch whether the bearish supply outlook will outweigh geopolitical risk, and if Brent can continue to find support above USD 65/bl – a level increasingly seen as a soft floor for OPEC+ policy.
Brent crude makes some gains as Israel’s attack on Hamas in Qatar rattles markets. Brent crude spiked to a high of USD 67.38/b yesterday as Israel made a strike on Hamas in Qatar. But it wasn’t able to hold on to that level and only closed up 0.6% in the end at USD 66.39/b. This morning it is starting on the up with a gain of 0.9% at USD 67/b. Still rattled by Israel’s attack on Hamas in Qatar yesterday. Brent is getting some help on the margin this morning with Asian equities higher and copper gaining half a percent. But the dark cloud of surplus ahead is nonetheless hanging over the market with Brent trading two dollar lower than last Tuesday.

Geopolitical risk premiums in oil rarely lasts long unless actual supply disruption kicks in. While Israel’s attack on Hamas in Qatar is shocking, the geopolitical risk lifting crude oil yesterday and this morning is unlikely to last very long as such geopolitical risk premiums usually do not last long unless real disruption kicks in.
US API data yesterday indicated a US crude and product stock build last week of 3.1 mb. The US API last evening released partial US oil inventory data indicating that US crude stocks rose 1.3 mb and middle distillates rose 1.5 mb while gasoline rose 0.3 mb. In total a bit more than 3 mb increase. US crude and product stocks usually rise around 1 mb per week this time of year. So US commercial crude and product stock rose 2 mb over the past week adjusted for the seasonal norm. Official and complete data are due today at 16:30.
A 2 mb/week seasonally adj. US stock build implies a 1 – 1.4 mb/d global surplus if it is persistent. Assume that if the global oil market is running a surplus then some 20% to 30% of that surplus ends up in US commercial inventories. A 2 mb seasonally adjusted inventory build equals 286 kb/d. Divide by 0.2 to 0.3 and we get an implied global surplus of 950 kb/d to 1430 kb/d. A 2 mb/week seasonally adjusted build in US oil inventories is close to noise unless it is a persistent pattern every week.
US IEA STEO oil report: Robust surplus ahead and Brent averaging USD 51/b in 2026. The US EIA yesterday released its monthly STEO oil report. It projected a large and persistent surplus ahead. It estimates a global surplus of 2.2 m/d from September to December this year. A 2.4 mb/d surplus in Q1-26 and an average surplus for 2026 of 1.6 mb/d resulting in an average Brent crude oil price of USD 51/b next year. And that includes an assumption where OPEC crude oil production only averages 27.8 mb/d in 2026 versus 27.0 mb/d in 2024 and 28.6 mb/d in August.
Brent will feel the bear-pressure once US/OECD stocks starts visible build. In the meanwhile the oil market sits waiting for this projected surplus to materialize in US and OECD inventories. Once they visibly starts to build on a consistent basis, then Brent crude will likely quickly lose altitude. And unless some unforeseen supply disruption kicks in, it is bound to happen.
US IEA STEO September report. In total not much different than it was in January

US IEA STEO September report. US crude oil production contracting in 2026, but NGLs still growing. Close to zero net liquids growth in total.


Brent crude ticks higher on tension, but market structure stays soft

Kinas elproduktion slog nytt rekord i augusti, vilket även kolkraft gjorde

Det stigande guldpriset en utmaning för smyckesköpare

Aktier i guldbolag laggar priset på guld
Volatile but going nowhere. Brent crude circles USD 66 as market weighs surplus vs risk

Meta bygger ett AI-datacenter på 5 GW och 2,25 GW gaskraftverk
Aker BP gör ett av Norges största oljefynd på ett decennium, stärker resurserna i Yggdrasilområdet

Ett samtal om koppar, kaffe och spannmål
Brent sideways on sanctions and peace talks
Sommarens torka kan ge högre elpriser i höst
-
 Nyheter4 veckor sedan
Meta bygger ett AI-datacenter på 5 GW och 2,25 GW gaskraftverk
-
 Nyheter4 veckor sedan
Aker BP gör ett av Norges största oljefynd på ett decennium, stärker resurserna i Yggdrasilområdet
-
 Nyheter4 veckor sedan
Ett samtal om koppar, kaffe och spannmål
-
Analys4 veckor sedan
Brent sideways on sanctions and peace talks
-
 Nyheter4 veckor sedan
Sommarens torka kan ge högre elpriser i höst
-
Analys4 veckor sedan
Brent edges higher as India–Russia oil trade draws U.S. ire and Powell takes the stage at Jackson Hole
-

 Nyheter3 veckor sedan
Mahvie Minerals är verksamt i guldrikt område i Finland
-
Analys3 veckor sedan
Increasing risk that OPEC+ will unwind the last 1.65 mb/d of cuts when they meet on 7 September