

Analys
A two currency oil market

 China today launched its long awaited yuan denominated oil contract at the International Energy Exchange (INE) in Shanghai. Seven crude streams from UAE, Qatar, Oman, Yemen Iraq and China will define the pricing of the contract. There is substantial scepticism towards the contract. Most of the sceptical arguments will in our view dissipate over time as rules, regulations and capital controls are adapted and adjusted as time goes by. The Chinese government likely has plenty of leverage to make the contract a success making it into an Asian oil benchmark representing a vibrant and growing oil demand which today accounts for 27% of global demand.

Bjarne Schieldrop, Chief analyst commodities
The launch of the contract will open up for international participation in China’s commodity market for the first time. International oil players will need to hold renminbi books reflecting an oil market which here onwards will roll on two currency wheels.
The rapidly rising risk that Donald, Mike and John will tear up the current Iranian nuclear deal in mid-May makes it likely that Iran will accept crude oil settlement in renminbi in not too long in order to avert the risk of renewed dollar sanctions which it experienced so painfully from 2012 to 2015.
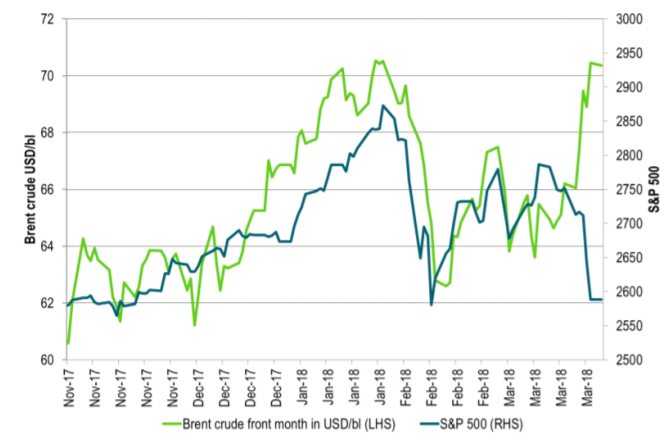
Price action: Brent jumps while equities fall as Venezuela and Iran supply risk increases on John Bolton
The front month Brent crude oil contract jumped 2.2% on Friday to $70.45/bl on news that John Bolton was replacing Lt. Gen. H:R: McMaster as the US national security advisor. John Bolton is known to be abrasive, undiplomatic, deeply conservative and nationalistic with hawkish views on Iran and North Korea. As such he matches both Donald Trump and his new secretary of state Mike Pompeo. It is now difficult to see how the Iran Nuclear deal can survive beyond mid-May when a new round of US waivers is needed to carry the deal forward yet another quarter, unless of course the deal is significantly re-worked. Apparently however the non-US signatories to the Iran nuclear deal are still in the dark with respect to what and how Donald Trump want’s the deal to be re-written. The May waiver deadline is approaching rapidly and as far as we know there is no real work in progress in order to re-work the deal. The appointment of John Bolton also increases the risk for sanctions towards Venezuela. Venezuela’s oil production and export is already in free fall but hanging on a thread by US refineries who are supplying Venezuela with naphtha in exchange of heavy crude oil. Venezuela would not be able to export much oil without the naphtha or light crude which is critical for diluting its heavy crude to a quality which is exportable. Thus US oil sanctions towards Venezuela would cut the last thread.
A two currency oil market
After years and years of waiting the Chinese Yuan denominated oil contract quoted at the Shanghai International Energy Exchange (INE) is finally here. China did try to launch an oil futures contract back in 1993 but it basically blew up due to uncontrollable price volatility. This time around China has taken good time to prepare the launch of its new oil contract in order to make sure that there is no second round flop like in 1993. China last year became the world’s top oil importer with an average import of 8.4 m bl/d. At the same time it is also the world’s sixth biggest oil producer with an average production last year of 3.8 m bl/d.
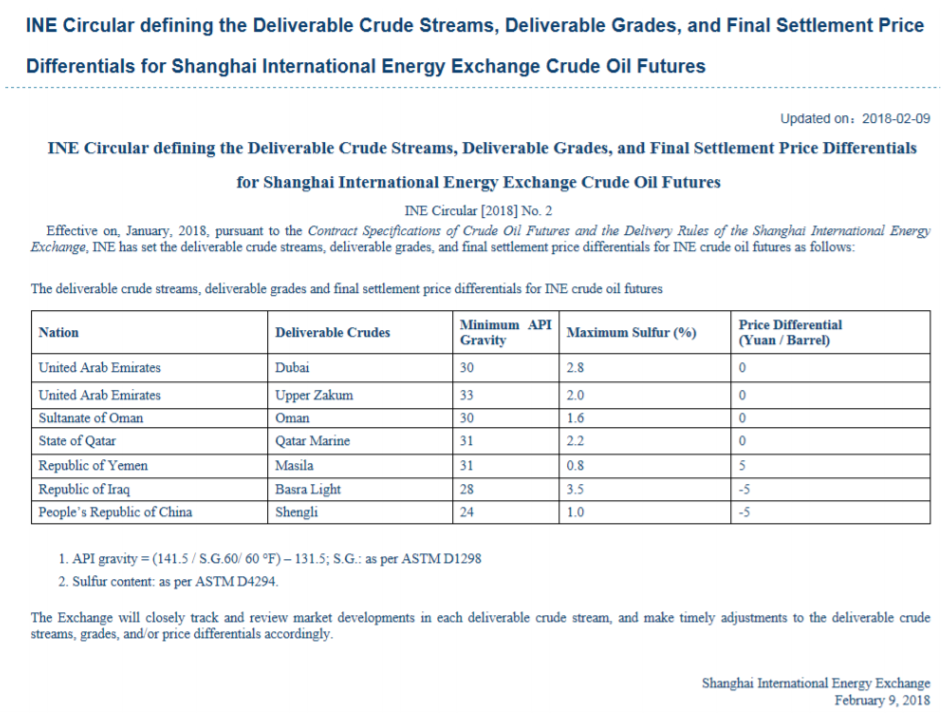
Seven crude streams in the INE contract with characteristics close to the Dubai crude slate
Seven deliverable crude streams in Shanghai will be used to settle the INE crude oil contract. They originate from UAE, Oman, Qatar, Yemen and China itself. The crude streams are distinctly different from the light, sweet crude benchmarks of Brent crude and WTI. The INE crude streams are on average (across the different grades) required to have an API gravity of more than 29.6 and a sulphur content of less than 2%. In comparison the WTI benchmark is very light with an API of 39.6 and only about 0.24% sulphur. As such the INE benchmark is distinctly different from both Brent crude and WTI. It is however very close to the Dubai crude oil marker which has an API of 31 and a sulphur content of 2%. As such one could say that the INE contract is the Dubai marker in Asia quoted in renminbi.
The new INE contract could be a representation of 27 m bl/d of vibrant Asian oil demand
The new Chinese oil contract will likely over time come to represent Asian oil demand in general. In 2018 Asian demand is set to average 27 m bl/d (IEA) or 27% of global consumption. It has been argued that the new benchmark will be a bad price hedge for oil deliveries in other places in Asia than Shanghai. This is based on the assumption that the oil price fundamentally is set either in the US (WTI), in the Gulf (Dubai marker) or in Europe (Brent). And as such it should mathematically be better to hedge with one of these three price points rather than the new Chinese INE contract. However, if the driver of the global oil market and thus oil price dynamics is instead really set by the vibrant oil demand in Asia rather than the three mentioned oil price benchmarks then it would clearly be better to hedge with the INE contract.
In our view the new INE contract is not an effort to replace the existing global crude oil benchmarks. It is instead filling a needed vacuum in the global oil market: A marker for the Asian market. It has been argued that the existing crude benchmarks are successful since they are located at hubs with both large production and consumption. But this is also actually true for the new benchmark with China being the sixth largest oil producer in the world as well as the biggest oil importer in the world.
The INE contract has several disadvantages but these are likely to dissipate over time
To start with the INE contract seems to have several disadvantages. It will have limited trading hours with the last trading slot ending at 0700 am GMT and thus just before the London market opens. The Chinese government has also set crude oil storage costs at twice the global average level in order to avoid excessive price volatility due from potential games between the physical market and the new INE contract. Such high storage costs will be negative for the necessary interplay and price discovery between the local physical market (derived from storage economics) and the INE financial instruments. Another reason for the very high storage cost may be to avoid commodity storage games used for shadow financing and circumvention of capital controls which has flourished for other commodities traded in China. The quotation of the INE contract in renminbi will also be a negative as seen by most current oil market participants in the current dollar dominated oil market. And lastly Chinese capital controls and unpredictable regulations will also be a concern for many potential participants.
Many of these negatives will however dissipate over time. Trading hours will expand, storage costs will normalize, general capital controls will ease and rules and regulations will stabilize. And lastly the renminbi will be more and more accepted currency world-wide. The Chinese government does have time to adjust and the current mode of the INE market is launch phase with some trail and error. The front month INE contract is actually the September 2018 contract allowing plenty of time for adjustment. So we do not think that one should judge the contract in the early phase on the many negative traits which have been highlighted.
Plenty of participants ready to transact – Open interest will be the measure of success
More than 6,000 trading accounts have been opened for the INE contract including China’s largest oil companies and 150 brokerage firms. Larger foreign financial institutions like J.P.Morgan have also opened accounts. To further attract foreign participants the Chinese Government has waived income taxes for foreign investors for the first three years. An addition attraction of the INE oil contract is that it will be the first time foreigners will be able to trade commodities in China.
We agree that over time it will be the size of the number of open contracts and not turnover per se which will be the sign of success for the contract. So the open interest in the INE contract will be the parameter to watch. It will be the fingerprint showing that the INE contract fills a need and is actively used as a hedging tool.
The Chinese government has power to tilt the market towards the new contract
The Chinese government has a lot of power in order to ensure that the INE contract becomes a success with widespread use. The easy way is of course to demand that all domestic crude oil purchasing is done with settlement versus the INE contract benchmark. In that way any oil producer who would like to sell oil to China would have to accept the INE contract and settlement in renminbi. China could of course also lean on the countries who cooperate with China on the Belt and Road Initiative (BRI) with six major infrastructure projects in overdrive this year. Asking the involved countries in these BRI projects to use or support the new INE oil contract could be a natural request.
We think that the launch of the INE contract in China is a natural development reflecting that China is the world’s top oil importer, the sixth largest oil producer and a natural benchmark for oil prices in Asia. However, essentially what it all boils down to is that China wants to be able to purchase its oil in renminbi. There are several countries already on-board: Russia, Venezuela, Nigeria and Angola are all already selling oil to China in renminbi. We assume that UAE, Oman, Qatar, Yemen and Iraq also are accepting renminbi as payment for crude delivered to China since six of the seven crude streams in the INE contract originates from them.
No Iranian crude slates in the INE contract yet but Iran should be a natural participant
It is surprising to see that there are no crude oil streams from Iran in the new INE contract. The Iran Heavy crude stream with API = 30.2 and Sulphur = 1.8% should be a natural match the INE crude slate profile.
Iran is one of the countries which have been heavily hit by the weaponized USD. In 2012 the US applied pressure through the SWIFT system. It blocked clearing for every Iranian bank, froze $100 billion of Iranian assets which together with other measures helped to block Iranian oil exports which roughly dropped 1 m bl/d due to this.
US pressure is building up against the Iran nuclear deal – should naturally drive Iran towards the INE contract
Now pressure is rising rapidly towards Iran. In the US forces are gathering to tear apart the Iran nuclear deal with the recent appointment of Mike Pompeo as US secretary of state and John Bolton as the US national security advisor. Donald Trump together with these two now looks ready to tear apart the current Iran nuclear deal as waivers are up for renewal in mid-May. The Saudi crown prince Mohammed bin Salman also seemed to apply pressure against Iran at his meeting with Donald Trump. Thus Saudi Arabia seems like it is sticking with the US while Iran, Iraq, Oman, UAE, Qatar and Yemen are drifting over towards China. China and the US are at the same time drifting apart amid increasing trade tensions with political tensions in the South China Sea being the icing on the cake so to speak. It seems highly plausible in our view that Iran in not too long with explicitly state that they also accept payment in renminbi for oil sales to China.
Saudi Arabia however seems for the time being to stick even tighter to the dollar-oil deal which the House of Saud presumably struck with Nixon and Kissinger back in 1974 in exchange for protection and geopolitical support.
Crude slates in the INE contract
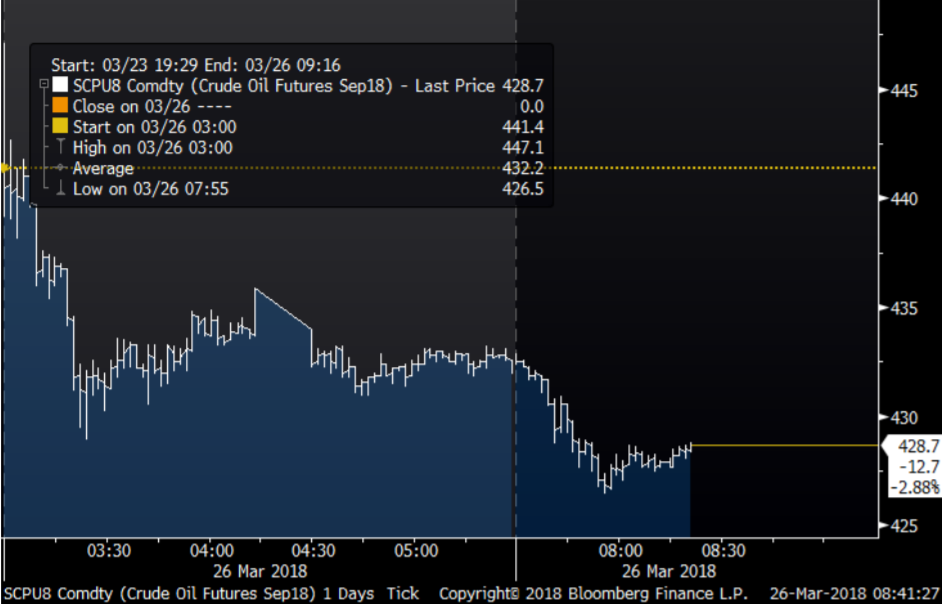
Ch1: Yes, the INE September contract started to trade first time on 26 March 2018
Ch2: Brent crude went opposite of equities last week
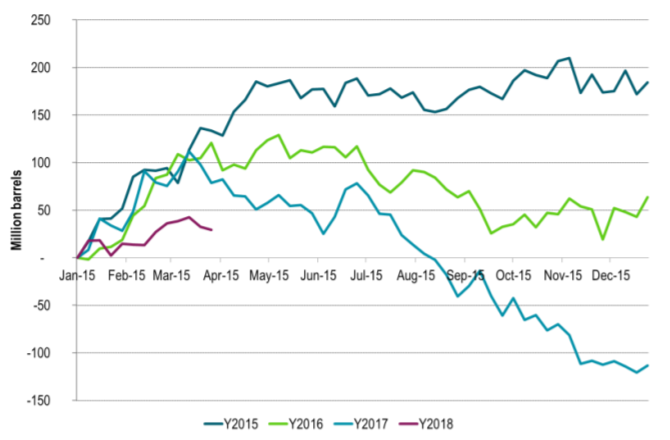
Ch3: Weekly US, EU, Singapore and Floating stocks lower 2nd week

Wild moves yesterday. Brent crude traded to a high of $114.43/b and a low of $96.0/b and closed at $99.94/b yesterday.

US – Iran negotiations ongoing or not? What a day. Donald Trump announced that good talks were ongoing between Iran and the US and that the 48 hour deadline before bombing Iranian power plants and energy infrastructure was postponed by five days subject to success of ongoing meetings. Iranian media meanwhile stated that no meetings were ongoing at all.
Today we are scratching our heads trying to figure out what yesterday was all about.
Friends and family playing the market? Was it just Trump and his friends and family who were playing with oil and equity markets with $580m and $1.46bn in bets being placed by someone in oil and equity markets just 15 minutes before Trump’s announcement?
Was Trump pulling a TACO as he reached his political and economic pain point: Brent at $112/b, US Gas at $4/gal, SPX below 200dma and US 10yr above 4.4%?
Different Iranian factions with Trump talking with one of them? Are there real negotiations going on but with the US talking to one faction in Iran while another, the hardliners, are not involved and are denying any such negotiations going on?
Extending the ultimatum to attack and invade Kharg island next weekend? Or, is the five day delay of the deadline a tactical decision to allow US amphibious assault ships and marines to arrive in the Gulf in the upcoming weekend while US and Israeli continues to degrade Iranian military targets till then. And then next weekend a move by the US/Israel to attack and conquer for example the Kharg island?
We do not really know which it is or maybe a combination of these.
We did get some kind of TACO ydy. But markets have been waiting for some kind of TACO to happen and yesterday we got some kind of TACO. And Brent crude is now trading at $101.5/b as a result rather than at $112-114/b as it did no the high yesterday.
But what really matters in our view is the political situation on the ground in Iran. Will hardliners continue to hold power or will a more pragmatic faction gain power?
If the hardliners remain in power then oil pain should extend all the way to US midterm elections. The hardliners were apparently still in charge as of last week. Iran immediately retaliated and damaged LNG infrastructure in Qatar after Israel hit Iranian South Pars. The SoH was still closed and all messages coming out of Iran indicated defiance. Hardliners continues in power has a huge consequence for oil prices going forward. The regime has played its ’oil-weapon’ (closing or chocking the Strait of Hormuz). It is using it to achieve political goals. Deterrence: it needs to be so politically and economically expensive to attack Iran that it won’t happen again in the future. Or at least that the US/Israel thinks 10-times over before they attack again. The highest Brent crude oil closing price since the start of the war is $112.19/b last Friday. In comparison the 20-year inflation adjusted Brent price is $103/b. So Brent crude last Friday at $112.19/b isn’t a shockingly high price. And it is still far below the nominal high of $148/b from 2008 which is $220/b if inflation adjusted. So once in a lifetime Iran activates its most powerful weapon. The oil weapon. It needs to show the power of this weapon and it needs to reap political gains. Getting Brent to $112/b and intraday high of $119.5/b (9 March) isn’t a display of the power of that weapon. And it is not a deterrence against future attacks.
So if the hardliners remain in power in Iran, then the SoH will likely remain chocked all the way to US midterm elections and Brent crude will at a minimum go above the historical nominal high of $148/b from 2008.
Thus the outlook for the oil price for the rest of the year doesn’t depend all that much of whether Trump pulls a TACO or not. Stops bombing or not. It depends more on who is in charge in Iran. If it is the hardliners, then deterrence against future attacks via chocking of the SoH and high oil prices is the likely line of action. It is impacting the world but the Iranian ’oil-weapon’ is directed towards the US president and the the US midterm elections.
If a pragmatic faction gets to power in Iran, then a very prosperous future is possible. However, if power is shifting towards a more pragmatic faction in Iran then a completely different direction could evolve. Such a faction could possibly be open for cooperation with the US and the GCC and possibly put its issues versus Israel aside. Then the prosperity we have seen evolving in Dubai could be a possible future also for Iran.
So far it looks like the hardliners are fully in charge. As far as we can see, the hardliners are still fully in control in Iran. That points towards continued chocking of the SoH and oil prices ticking higher as global inventories (the oil market buffers) are drawn lower. And not just for a few more weeks, but possibly all the way to the US midterm elections.
A brief sigh of relief yesterday as oil infra at Kharg wasn’t damaged. But higher today. Brent crude dabbled around a bit yesterday in relief that oil infrastructure at Iran’s Kharg island wasn’t damaged. It traded briefly below the 100-line and in a range of $99.54 – 106.5/b. Its close was near the low at $100.21/b.
No easy victorious way out for Trump. So no end in sight yet. Brent is up 3.2% today to $103.4/b with no signs that the war will end anytime soon. Trump has no easy way to declare victory and mission accomplished as long as Iran is in full control of the Strait of Hormuz while also holding some 440 kg of uranium enriched to 60% and not far from weapons grade at 90%. As long as these two factors are unresolved it is difficult for Trump to pull out of the Middle East. Naturally he gets increasingly frustrated over the situation as the oil price and US retail gas prices keeps ticking higher while the US is tied into the mess in the Middle East. Trying to drag NATO members into his mess but not much luck there.
When commodity prices spike they spike 2x, 3x, 4x or 5x. Supply and demand for commodities are notoriously inflexible. When either of them shifts sharply, the the price can easily go to zero (April 2022) or multiply 2x, 3x, or even 5x of normal. Examples in case cobalt in 2025 where Kongo restricted supply and the price doubled. Global LNG in 2022 where the price went 5x normal for the full year average. Demand for tungsten in ammunition is up strongly along with full war in the middle east. And its price? Up 537%.
Why hasn’t the Brent crude oil price gone 2x, 3x, 4x or 5x versus its normal of $68/b given close to full stop in the flow of oil of the Strait of Hormuz? We are after all talking about close to 20% of global supply being disrupted. The reason is the buffers. It is fairly easy to store oil. Commercial operators only hold stocks for logistical variations. It is a lot of oil in commercial stocks, but that is predominantly because the whole oil system is so huge. In addition we have Strategic Petroleum Reserves (SPRs) of close to 2500 mb of crude and 1000 mb of oil products. The IEA last week decided to release 400 mb from global SPR. Equal to 20 days of full closure of the Strait of Hormuz. Thus oil in commercial stocks on land, commercial oil in transit at sea and release of oil from SPRs is currently buffering the situation.
But we are running the buffers down day by day. As a result we see gradually increasing stress here and there in the global oil market. Asia is feeling the pinch the most. It has very low self sufficiency of oil and most of the exports from the Gulf normally head to Asia. Availability of propane and butane many places in India (LPG) has dried up very quickly. Local prices have tripled as a result. Local availability of crude, bunker oil, fuel oil, jet fuel, naphtha and other oil products is quickly running down to critical levels many places in Asia with prices shooting up. Oman crude oil is marked at $153/b. Jet fuel in Singapore is marked at $191/b.
Oil at sea originating from Strait of Hormuz from before 28 Feb is rapidly emptied. Oil at sea is a large pool of commercial oil. An inventory of oil in constant move. If we assume that the average journey from the Persian Gulf to its destinations has a volume weighted average of 13.5 days then the amount of oil at sea originating from the Persian Gulf when the the US/Israel attacked on 28 Feb was 13.5 days * 20 mb/d = 269 mb. Since the strait closed, this oil has increasingly been delivered at its destinations. Those closest to the Strait, like Pakistan, felt the emptying of this supply chain the fastest. Propane prices shooting to 3x normal there already last week and restaurants serving cold food this week is a result of that. Some 50-60% of Asia’s imports of Naphtha normally originates from the Persian Gulf. So naphtha is a natural pain point for Asia. The Gulf also a large and important exporter of Jet fuel. That shut in has lifted jet prices above $200/b.
To simplify our calculations we assume that no oil has left the Strait since that date and that there is no increase in Saudi exports from Yanbu. Then the draining of this inventory at sea originated from the Persian Gulf will essentially look like this:
The supply chain of oil at sea originating from the Strait of Hormuz is soon empty. Except for oil allowed through the Strait of Hormuz by Iran and increased exports from Yanbu in the Red Sea. Not included here.

Oil at sea is falling fast as oil is delivered without any new refill in the Persian Gulf. Waivers for Russian crude is also shifting Russian crude to consumers. Brent crude will likely start to feel the pinch much more forcefully when oil at sea is drawn down another 200 mb to around 1000 mb. That is not much more than 10 days from here.

Oil and oil products are starting to become very pricy many places. Brent crude has still been shielded from spiking like the others.

Closing at highest since Aug 2022. Brent crude gained 9.2% yesterday. The trading range was limited to $95.2 – 101.85/b with a close at $100.46/b and higher than the Monday close of $98.96/b. Ydy close was the highest close since August 2022. This morning Brent is up 2% to $102.4/b and is trading at the highest intraday level since Monday when it high an intraday high of $119.5/b.
A military hit at Iran’s Kharg island would be a big, big bang for the oil price. The big, big risk for the weekend is that oil infrastructure could be damaged. For example Iran’s Kharg island which is Iran’s major oil export hub. If damaged we would have a longer lasting loss of supply stretching way beyond Trump’s announced ”two more weeks”. It will make the spot price spike higher and it will lift the curve. Brent crude 2027 swap would jump above $80/b immediately. An attack on Kharg island would naturally lead Iran to strike back at other oil infrastructures in the Gulf. Especially those belonging to countries who harbor US military bases. I.e. countries who essentially are supporting the attack by US and Israel towards Iran. Though if not in spirit, then in practical operational terms. An attack on Kharg island would not just lead to a lasting outage of supply from Iran until it would be repaired. It would immediately endanger other oil infrastructure in the region as well and additional lasting loss of supply.
No one in their right mind would dare to sit short oil over the coming weekend. Oil is thus set to close the week at a very strong note today.
Prepare for another 400 mb SPR release next week. This week’s announcement of a 400 mb release from Strategic Oil Reserves totally underwhelmed the market with the oil price going higher rather than lower following the announcement. For one it means that the market expects the war and the closure of the Strait of Hormuz to last longer than Trump’s recent announced ”two more weeks”. 400 mb only amounts to 20 days of lost supply to the world through Hormuz and we are already at day 14. So next week when we are getting close to the 20 day mark, we are likely to see another announcement of another 400 mb release of SPR stocks to the market. Preparing for the next 20 days of war.
Global oil logistics in total disarray. We have previously addressed the issue of the huge logistical web of the global oil market which is now in total disarray. The logistical disruption started to fry the oil market at the end of last week. Helped to spike the oil market on Monday. What we hear from our shipping clients is that the problems with supply of fuels locally in Korea, Singapore, India and Africa are getting worse with physical availability of fuels there drying up. It is getting increasingly difficult to find physical supply of bunker oil with local, physical prices shooting way higher than financial benchmarks. To the point that biofuels have become the cheap option many places. Availability of fuels in the US is still good. Not so surprising as the US is self-sufficient with crude and refineries.
The disruption in global oil logistics doesn’t seem to improve. Rather the opposite. If you cannot get fuel to run your ships, then how can you distribute fuels to where it is needed.
Buy Brent Dec-2026 calls with strike $150/b!! As the days goes by the oil price is ticking higher while Trump is getting one day closer to US midterm elections. Trump was betting that he could put this war to bead well before November. But that will probably not be up to him to decide. It will be up to Iran to decide when to reopen the Strait of Hormuz. It is very hard to imagine that Iran will let Trump easily off the hock after he has killed its Supreme Leader. This will likely go all the way to November. Buy Brent Dec-2026 calls with strike $150/b!!
Brent closed at highest since 2022 ydy. Will end this Friday at a very strong note! Consumers still dreaming of $60/b oil


Christian Kopfer om läget för oljan

Marknaden måste börja betrakta de höga kopparpriserna som det nya normala

Det fysiska spotpriset på brentolja har slagit nytt rekord

40 minuter med Javier Blas om hur världen verkligen påverkas av energikrisen

Efter tillväxten: Guldbrev satsar på expansion i Europa
40 minuter med Javier Blas om hur världen verkligen påverkas av energikrisen

Elpriserna fördubblas, stor osäkerhet inför sommaren

MP Materials, USA:s svar på Kinas dominans över sällsynta jordartsmetaller
Det fysiska spotpriset på brentolja har slagit nytt rekord

Studsvik har idag ansökt om att få bygga 1200-1600 MW kärnkraft i Valdemarsvik
-
 Nyheter2 veckor sedan
40 minuter med Javier Blas om hur världen verkligen påverkas av energikrisen
-
 Nyheter3 veckor sedan
Elpriserna fördubblas, stor osäkerhet inför sommaren
-
 Nyheter4 veckor sedan
MP Materials, USA:s svar på Kinas dominans över sällsynta jordartsmetaller
-
 Nyheter2 veckor sedan
Det fysiska spotpriset på brentolja har slagit nytt rekord
-
 Nyheter4 veckor sedan
Studsvik har idag ansökt om att få bygga 1200-1600 MW kärnkraft i Valdemarsvik
-
 Nyheter2 veckor sedan
Marknaden måste börja betrakta de höga kopparpriserna som det nya normala
-

 Nyheter4 veckor sedan
Matproduktion är beroende av gödsel, Gulfkriget skapar brist
-
Analys4 veckor sedan
TACO (or Whatever It Was) Sends Oil Lower — Iran Keeps Choking Hormuz