

Analys
Modity om elpriset vecka 10 2015

Veckans marknadskommentar
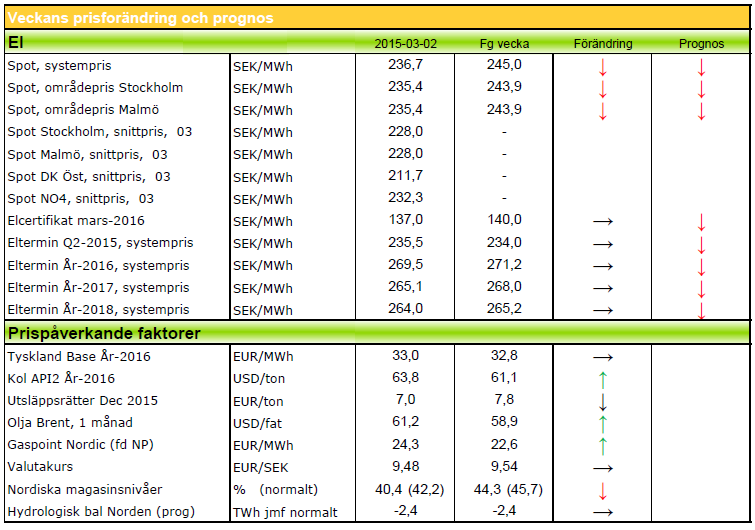
Brents uppgång har mattats medan WTI har vänt ned igen. Kolet upp en aning. Elen är upp på inte fullt så varma, blöta och blåsiga prognoser som förut. Utsläppsrätterna ned idag men trendkanalen är uppåt. Hydrobalansen blev starkare och är nu klart över normal nivå. Elcertens fall har pausat och stannat kvar på låg nivå.
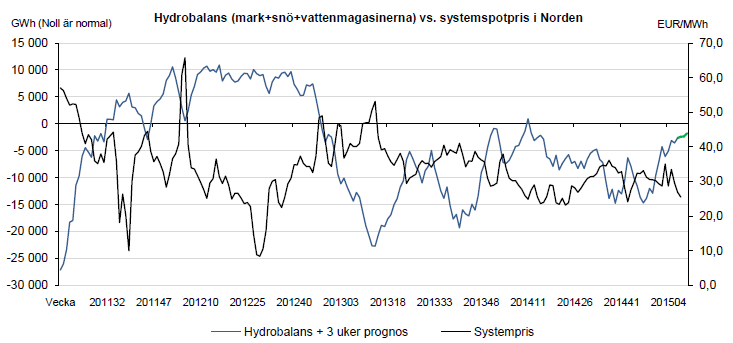
Hydrobalansen ligger v08 på 1,4 TWh över normalen. Det är lite mindre än vad som var väntat och det beror på att den väntade påfyllningen från massiva lågtryck inte blev riktigt så stor, när de i stället vek av söderut. Avsmältningen på lägre nivåer har dock ökat och eftersom man fått balansera stor vindkraft så har vattenmagasinen byggts på en del under förra veckan. Fortfarande ligger det mycket snö högre upp, så totalt sett ser det alltså bra ut! Väderprognoserna har i viss mån ändrat karaktär mot det kallare hållet – åtminstone på kontinenten. Över Skandinavien är det fortfarande milt med aningen lägre nederbörd. Dock mer än normalt.
Kärnkraftverken i Norden har idag den 2/3 en produktion på 87 % (10 881 MW). Ringhals 1 kör nu aningen reducerat men väntas komma tillbaka upp under dagen. Annars är Oskarshamn 2 kvar ute till september och Ringhals 2 till november. De finska verken körs nu som vi är vana vid – 100 %.
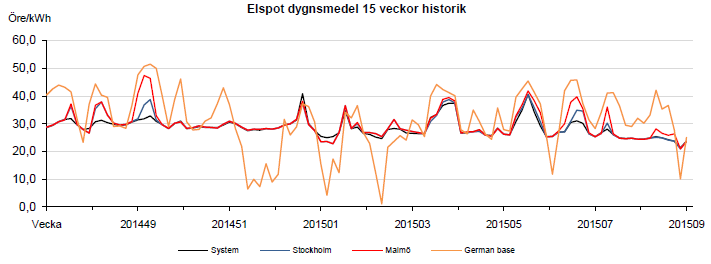
Systemspotpriset förra veckan blev 25,52 €/MWh. Det var en tillbakagång på nästan tre euro. I prisområde SE3 blev den 25,34 och i SE4 26,73. Fortfarande ser vi press på vattenkraften. Systemet är känsligt i detta läge när magasinsnivåerna för sommaren och hösten behöver justeras lite nedåt men då vinden kräver återhållsamhet med vattnet, får det ju stanna kvar i magasinen så länge. I går visades några timmar med negativa siffror i DK2 på grund av stort vindtillskott.
Terminspriser
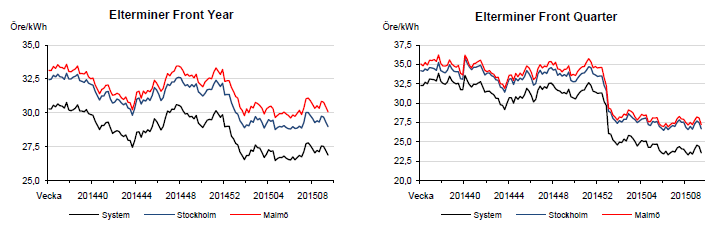
Och jag hann inte mer än säga ned innan det vände och började gå upp! Det var ett trendbrott i vädret som uppenbarade sig från mitten av förra veckan. Där syntes både lägre temperaturer och blockerande högtryck med lite nederbörd. Däremot var det en kortvarig uppenbarelse och strax därefter kom de våta, varma prognoserna med inrullande lågtryck från norra Atlanten tillbaka i prognosbilden. Där är vi nu. Priserna har följaktligen vänt ned igen. Inte ända ned till läget innan men nästan. Just idag har nederbörden i prognoserna dragits ned över perioden, så vi ser ett litet uppställ för närvarande. Som skrivet ovan är vattenläget gott och vi ser inga fundamentala faktorer som tyder på högre priser i dagsläget. Q2 omsätts i skrivande stund på 25,20. År 16 handlas nu på 28,80 €/MWh.
Bränslemarknaden
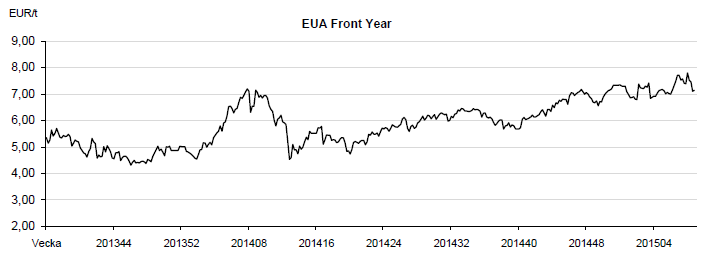
Utsläppsrätter, CO2
ENVI:s förslag gick igenom i tisdags, när omröstningen var. Det betyder i korthet att MSR ska vara fungerande senast 31 dec 2018. Detta kunde tydligen accepteras av alla parter och det innebär i praktiken en skärpning av nuvarande tidsschema. Marknaden reagerade lamt med fallande priser. Återstoden av veckan blev också en nedgång. Omsätts idag kring drygt sju euro. Tittar man på kursutveckingen i ett tekniskt analytiskt perspektiv är vi i en uppåtgående trendkanal.
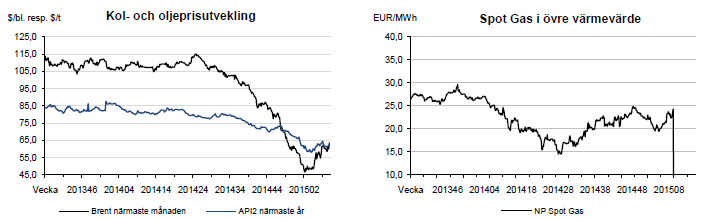
Olja: Det är stor spread mellan amerikanska WTI-oljan och europeiska Brent. Brent prisas högre. För att det ska jämna ut sig krävs att USA bestämmer sig för att exportera sin olja genom att bygga rör, främst till Kanada. Detta verkar inte vara aktuellt för den sittande administrationen. Prissituationen är i stort sett sidledes men eftersom det är ett överutbud totalt i marknaden är antydan nedåt.
Kol: Australiensiska Glencore har annonserat en reduktion av sin kolproduktion. Något som stabliliserat priserna en aning och till och med fått dem att gå upp. Vi kan samtidigt se att torrfrakterna nu kostar mindre än på mycket länge, vilket håller nere konsumentpriserna. Fortfarande råder en överutbudssituation.
Naturgas: I England har man tagit ut den för uppvärmning lagrade gasen lite snabbare än vad som var tänkt. En kallare vinter har lett till en sådan åtgärd. Detta skulle normalt trigga en press uppåt på priserna i marknaden men man har lyckats ersätta mycket av volymen men billig LNG. I Ukraina är det förstås inte helt stabilt men landet har lyckats betala en del av den närmsta skulden man hade till Ryssland för levererad gas. Man försöker komma undan betalningsansvar för den del av gasen som gått till ryskdominernade områden. Ett understatement är att alla parter inte är helt överens i denna fråga..!
Elcertifikat
Efter förra veckans kraftiga nedgång har det stannat upp och hållit sig på den historiskt låga nivån. Lite oklart vad det var som gjorde nedgången så stor. Det har under förra veckan varit normal omsättning och senast är det en liten knorr uppåt i kursen. Mars -15 stängde i fredags på 137 SEK. Övriga priser: Mars-16 141 SEK och Mars-17 143,5 SEK.
Valuta
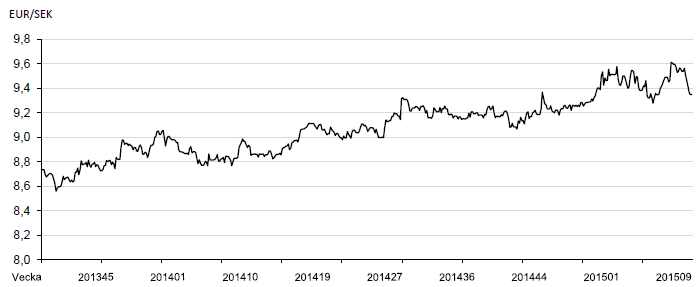
Valutakommentar
Som vi sa i senaste veckobrevet borde kronan stärkas mot euron och handla ner mot stödet på 9,30. Vi trodde inte att det skulle gå så snabbt men förra veckan stärktes kronan till 9,32 på anledning av den mycket starka BNP siffran som släpptes. BNP överraskade på uppsidan och steg 2,7% på årsbasis mot förväntat 1,5%. 9,30 förväntas hålla på nedsidan och vi handlar alltjämt i samma range som tidigare, 9,30 – 9,70. Mot dollarn är kronan alltjämt svag och man får betala 8,35 på spotmarknaden för en dollar. Vi har nu 11 månader bakom oss med högre bottnar och högre toppar. Rekyler är alltjämt köpvärda.
Teknisk analys
Teknisk analys Q2-15
Q2 handlades mellan 24,21 och 26,30 €/MWh förra veckan. Just nu handlas den på 25,15. Även om nedåttrenden är bruten så såg vi en kraftig avvisning av priset efter uppstället. Det är bearish och innebär att högre priser ansågs säljvärda och att marknaden nu kan komma att vilja testa botten av befintlig range, dvs 24,21. Ett test av botten av rangen kommer visa oss om den nivån fortfarande anses köpvärd eller om den ger vika för ännu lägre priser.
Teknisk analys År-16
År-16 handlades mellan 28,15 och 29,10 €/MWh förra veckan. Precis som för frontkvartalet så blev kontraktet avvisat efter att ha testat toppen av den €1-breda prisintervallet vi befinner oss i. Just nu omsätts 28,65 vilket är i mitten av rangen och det är inte helt omöjligt att marknaden nu vill handla ner mot botten på 27,95 även om det i nuläget är hugget som stucket vilket håll priset vill bryta ut. Det är en förhållandevis smal och lång range vilket innebär att när botten eller toppen väl bryts så kommer vi i snabb takt handla ner eller upp ett par Euro.
[box]Denna energimarknadskommentar om elpriset publiceras på Råvarumarknaden.se med tillstånd och i samarbete med Modity Energy Trading.[/box]
Ansvarsfriskrivning
Energimarknadskommentaren har producerats av Modity Energy Trading. Informationen är rapporterad i god tro och speglar de aktuella åsikterna hos medarbetarna, dessa kan ändras utan varsel. Modity Energy Trading tar inget ansvar för handlingar baserade på informationen.
Om Modity Energy Trading
Modity Energy Trading erbjuder energibolag och större företag den erfarenhet, kompetens och analysredskap som krävs för en trygg och effektiv förvaltning av energiportföljen. Modity bedriver handel med allt från el och gas, till elcertifikat, valutor och utsläppsrätter. Företagets kunder får dessutom ta del av deras analysprodukter som t.ex det fullständiga marknadsbrevet med ytterligare kommentarer och prognoser. För ytterligare information se hemsidan.


Down on Friday. Up on Monday. The Brent June crude oil contract traded down 5.1% last week to a close of $90.38/b. It reached a high of $103.87/b last Monday and a low of $86.09/b on Friday as Iran announced that the Strait of Hormuz was fully open for transit. That quickly changed over the weekend as the US upheld its blockade of Iranian oil exports while Iran naturally responded by closing the SoH again. The US blew a hole in the engine room of the Iranian ship TOUSKA and took custody of the ship on Sunday. Brent crude is up 5.6% this morning to $95.4/b.

The cease-fire is expiring tomorrow. The US has said it will send a delegation for a second round of negotiations in Islamabad in Pakistan. But Iran has for now rejected a second round of talks as it views US demands as unrealistic and excessive while the US is also blocking the Strait of Hormuz.
While Brent is up 5% this morning, the financial market is still very optimistic that progress will be made. That talks will continue and that the SoH will fully open by the start of May which is consistent with a rest-of-year average Brent crude oil price of around $90/b with the market now trading that balance at around $88/b.
Financial optimism vs. physical deterioration. We have a divergence where the financial market is trading negotiations, improvements and resolution while at the same time the physical market is deteriorating day by day. Physical oil flows remain constrained by disrupted flows, longer voyage times and elevated freight and insurance costs.
Financial markets are betting that a US/Iranian resolution will save us in time from violent shortages down the road. But every day that the SoH remains closed is bringing us closer to a potentially very painful point of shortages and much higher prices.
The US blockade is also a weapon of leverage against its European and Asian allies. When Iran closed the SoH it held the world economy as a hostage against the US. The US blockade of the SoH is of course blocking Iranian oil exports. But it is also an action of disruption directed towards Europe and Asia. The US has called for the rest of the world to engaged in the war with Iran: ”If you want oil from the Persian Gulf, then go and get it”. A risk is that the US plays brinkmanship with the global oil market directed towards its European and Asian allies and maybe even towards China to force them to engage and take part. Maybe unthinkable. But unthinkable has become the norm with Trump in the White House.
Wild moves yesterday. Brent crude traded to a high of $114.43/b and a low of $96.0/b and closed at $99.94/b yesterday.
US – Iran negotiations ongoing or not? What a day. Donald Trump announced that good talks were ongoing between Iran and the US and that the 48 hour deadline before bombing Iranian power plants and energy infrastructure was postponed by five days subject to success of ongoing meetings. Iranian media meanwhile stated that no meetings were ongoing at all.
Today we are scratching our heads trying to figure out what yesterday was all about.
Friends and family playing the market? Was it just Trump and his friends and family who were playing with oil and equity markets with $580m and $1.46bn in bets being placed by someone in oil and equity markets just 15 minutes before Trump’s announcement?
Was Trump pulling a TACO as he reached his political and economic pain point: Brent at $112/b, US Gas at $4/gal, SPX below 200dma and US 10yr above 4.4%?
Different Iranian factions with Trump talking with one of them? Are there real negotiations going on but with the US talking to one faction in Iran while another, the hardliners, are not involved and are denying any such negotiations going on?
Extending the ultimatum to attack and invade Kharg island next weekend? Or, is the five day delay of the deadline a tactical decision to allow US amphibious assault ships and marines to arrive in the Gulf in the upcoming weekend while US and Israeli continues to degrade Iranian military targets till then. And then next weekend a move by the US/Israel to attack and conquer for example the Kharg island?
We do not really know which it is or maybe a combination of these.
We did get some kind of TACO ydy. But markets have been waiting for some kind of TACO to happen and yesterday we got some kind of TACO. And Brent crude is now trading at $101.5/b as a result rather than at $112-114/b as it did no the high yesterday.
But what really matters in our view is the political situation on the ground in Iran. Will hardliners continue to hold power or will a more pragmatic faction gain power?
If the hardliners remain in power then oil pain should extend all the way to US midterm elections. The hardliners were apparently still in charge as of last week. Iran immediately retaliated and damaged LNG infrastructure in Qatar after Israel hit Iranian South Pars. The SoH was still closed and all messages coming out of Iran indicated defiance. Hardliners continues in power has a huge consequence for oil prices going forward. The regime has played its ’oil-weapon’ (closing or chocking the Strait of Hormuz). It is using it to achieve political goals. Deterrence: it needs to be so politically and economically expensive to attack Iran that it won’t happen again in the future. Or at least that the US/Israel thinks 10-times over before they attack again. The highest Brent crude oil closing price since the start of the war is $112.19/b last Friday. In comparison the 20-year inflation adjusted Brent price is $103/b. So Brent crude last Friday at $112.19/b isn’t a shockingly high price. And it is still far below the nominal high of $148/b from 2008 which is $220/b if inflation adjusted. So once in a lifetime Iran activates its most powerful weapon. The oil weapon. It needs to show the power of this weapon and it needs to reap political gains. Getting Brent to $112/b and intraday high of $119.5/b (9 March) isn’t a display of the power of that weapon. And it is not a deterrence against future attacks.
So if the hardliners remain in power in Iran, then the SoH will likely remain chocked all the way to US midterm elections and Brent crude will at a minimum go above the historical nominal high of $148/b from 2008.
Thus the outlook for the oil price for the rest of the year doesn’t depend all that much of whether Trump pulls a TACO or not. Stops bombing or not. It depends more on who is in charge in Iran. If it is the hardliners, then deterrence against future attacks via chocking of the SoH and high oil prices is the likely line of action. It is impacting the world but the Iranian ’oil-weapon’ is directed towards the US president and the the US midterm elections.
If a pragmatic faction gets to power in Iran, then a very prosperous future is possible. However, if power is shifting towards a more pragmatic faction in Iran then a completely different direction could evolve. Such a faction could possibly be open for cooperation with the US and the GCC and possibly put its issues versus Israel aside. Then the prosperity we have seen evolving in Dubai could be a possible future also for Iran.
So far it looks like the hardliners are fully in charge. As far as we can see, the hardliners are still fully in control in Iran. That points towards continued chocking of the SoH and oil prices ticking higher as global inventories (the oil market buffers) are drawn lower. And not just for a few more weeks, but possibly all the way to the US midterm elections.
A brief sigh of relief yesterday as oil infra at Kharg wasn’t damaged. But higher today. Brent crude dabbled around a bit yesterday in relief that oil infrastructure at Iran’s Kharg island wasn’t damaged. It traded briefly below the 100-line and in a range of $99.54 – 106.5/b. Its close was near the low at $100.21/b.
No easy victorious way out for Trump. So no end in sight yet. Brent is up 3.2% today to $103.4/b with no signs that the war will end anytime soon. Trump has no easy way to declare victory and mission accomplished as long as Iran is in full control of the Strait of Hormuz while also holding some 440 kg of uranium enriched to 60% and not far from weapons grade at 90%. As long as these two factors are unresolved it is difficult for Trump to pull out of the Middle East. Naturally he gets increasingly frustrated over the situation as the oil price and US retail gas prices keeps ticking higher while the US is tied into the mess in the Middle East. Trying to drag NATO members into his mess but not much luck there.
When commodity prices spike they spike 2x, 3x, 4x or 5x. Supply and demand for commodities are notoriously inflexible. When either of them shifts sharply, the the price can easily go to zero (April 2022) or multiply 2x, 3x, or even 5x of normal. Examples in case cobalt in 2025 where Kongo restricted supply and the price doubled. Global LNG in 2022 where the price went 5x normal for the full year average. Demand for tungsten in ammunition is up strongly along with full war in the middle east. And its price? Up 537%.
Why hasn’t the Brent crude oil price gone 2x, 3x, 4x or 5x versus its normal of $68/b given close to full stop in the flow of oil of the Strait of Hormuz? We are after all talking about close to 20% of global supply being disrupted. The reason is the buffers. It is fairly easy to store oil. Commercial operators only hold stocks for logistical variations. It is a lot of oil in commercial stocks, but that is predominantly because the whole oil system is so huge. In addition we have Strategic Petroleum Reserves (SPRs) of close to 2500 mb of crude and 1000 mb of oil products. The IEA last week decided to release 400 mb from global SPR. Equal to 20 days of full closure of the Strait of Hormuz. Thus oil in commercial stocks on land, commercial oil in transit at sea and release of oil from SPRs is currently buffering the situation.
But we are running the buffers down day by day. As a result we see gradually increasing stress here and there in the global oil market. Asia is feeling the pinch the most. It has very low self sufficiency of oil and most of the exports from the Gulf normally head to Asia. Availability of propane and butane many places in India (LPG) has dried up very quickly. Local prices have tripled as a result. Local availability of crude, bunker oil, fuel oil, jet fuel, naphtha and other oil products is quickly running down to critical levels many places in Asia with prices shooting up. Oman crude oil is marked at $153/b. Jet fuel in Singapore is marked at $191/b.
Oil at sea originating from Strait of Hormuz from before 28 Feb is rapidly emptied. Oil at sea is a large pool of commercial oil. An inventory of oil in constant move. If we assume that the average journey from the Persian Gulf to its destinations has a volume weighted average of 13.5 days then the amount of oil at sea originating from the Persian Gulf when the the US/Israel attacked on 28 Feb was 13.5 days * 20 mb/d = 269 mb. Since the strait closed, this oil has increasingly been delivered at its destinations. Those closest to the Strait, like Pakistan, felt the emptying of this supply chain the fastest. Propane prices shooting to 3x normal there already last week and restaurants serving cold food this week is a result of that. Some 50-60% of Asia’s imports of Naphtha normally originates from the Persian Gulf. So naphtha is a natural pain point for Asia. The Gulf also a large and important exporter of Jet fuel. That shut in has lifted jet prices above $200/b.
To simplify our calculations we assume that no oil has left the Strait since that date and that there is no increase in Saudi exports from Yanbu. Then the draining of this inventory at sea originated from the Persian Gulf will essentially look like this:
The supply chain of oil at sea originating from the Strait of Hormuz is soon empty. Except for oil allowed through the Strait of Hormuz by Iran and increased exports from Yanbu in the Red Sea. Not included here.

Oil at sea is falling fast as oil is delivered without any new refill in the Persian Gulf. Waivers for Russian crude is also shifting Russian crude to consumers. Brent crude will likely start to feel the pinch much more forcefully when oil at sea is drawn down another 200 mb to around 1000 mb. That is not much more than 10 days from here.

Oil and oil products are starting to become very pricy many places. Brent crude has still been shielded from spiking like the others.


Market Still Betting on Timely Resolution, But Each Day Raises Shortage Risk

Christian Kopfer om läget för oljan

Marknaden måste börja betrakta de höga kopparpriserna som det nya normala

Det fysiska spotpriset på brentolja har slagit nytt rekord

40 minuter med Javier Blas om hur världen verkligen påverkas av energikrisen
40 minuter med Javier Blas om hur världen verkligen påverkas av energikrisen

Elpriserna fördubblas, stor osäkerhet inför sommaren

MP Materials, USA:s svar på Kinas dominans över sällsynta jordartsmetaller
Det fysiska spotpriset på brentolja har slagit nytt rekord

Studsvik har idag ansökt om att få bygga 1200-1600 MW kärnkraft i Valdemarsvik
-
 Nyheter3 veckor sedan
40 minuter med Javier Blas om hur världen verkligen påverkas av energikrisen
-
 Nyheter4 veckor sedan
Elpriserna fördubblas, stor osäkerhet inför sommaren
-
 Nyheter4 veckor sedan
MP Materials, USA:s svar på Kinas dominans över sällsynta jordartsmetaller
-
 Nyheter2 veckor sedan
Det fysiska spotpriset på brentolja har slagit nytt rekord
-
 Nyheter4 veckor sedan
Studsvik har idag ansökt om att få bygga 1200-1600 MW kärnkraft i Valdemarsvik
-
 Nyheter2 veckor sedan
Marknaden måste börja betrakta de höga kopparpriserna som det nya normala
-

 Nyheter4 veckor sedan
Matproduktion är beroende av gödsel, Gulfkriget skapar brist
-
Analys4 veckor sedan
TACO (or Whatever It Was) Sends Oil Lower — Iran Keeps Choking Hormuz