

Analys
Elpriset – Hur ser situation ut för nästkommande kvartal?

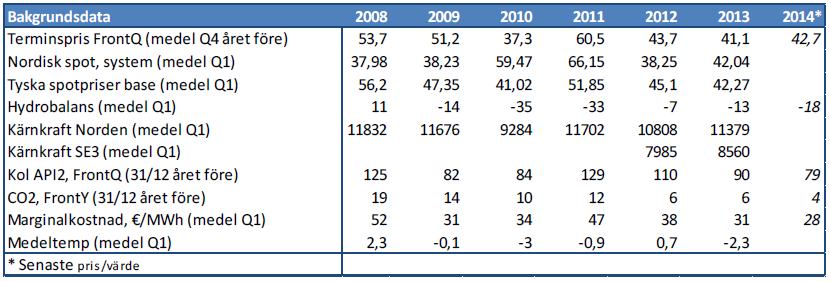
Bakgrundsdata
Dagens situation och hydrobalans
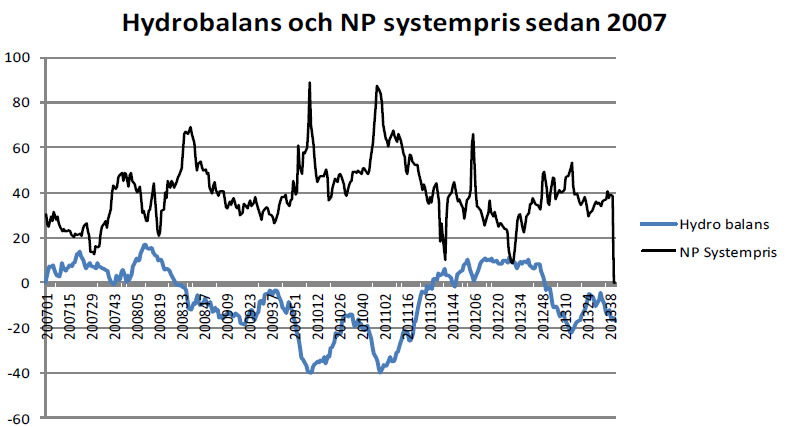
Vi har idag en hydrobalans (inkl. 10 dagars prognos) på ca -18 TWh. Skulle vi utgå från att hydrobalansen blir ca -15 TWh under Q1-14 så har vi två år bakom oss att titta på: 2009 och 2013. Båda dessa år var marginalkostnaden för kol något högre än prognoserna visar idag; ca €31/MWh mot dagens ca €28/MWh. Vi borde alltså, fundamentalt med dessa traditionella faktorer i bakgrunden, få något lägre priser i Q1-14 än vi hade under dessa två år. Terminspriset ligger idag dock ca €5/MWh högre än utfallet i Q1-09 och ca €1/MWh högre än utfallet i Q1-13. Vi hade under dessa år en mycket hög tillgänglighet på kärnkraft så för att det här ska stämma så måste också kärnkrafttillgängligheten ligga runt 90% under första kvartalet 2014. Vi har haft en del strul med kärnkraftkraften och nu har vi en tillgänglighet på drygt 80%, vi bör dock vara uppe i 90% när Ringhals 3 kommer in till november. Detta är dock en osäkerhet som bör speglas i priset vilket gör att det är rimligt att vi ligger lika eller till och med någon euro över utfallet Q1-09 , alltså som vi gör idag.
Om hydrobalansen försämras…
Sedan är det dock så att de senaste 5 åren så har hydroläget försämrats sedan v.44 hösten innan till kvartal 1 året efter, de flesta år med mellan 10-20 TWh. Trenden pekar alltså på att vi skulle få ett försämrat hydrologiskt läge till Q1-14. Detta skulle isåfall betyda att det finns fog för betydligt högre priser under Q1-14 än om vi tittar endast på nuvarande situation.
Skulle vi, efter en torr höst och start på vinter, landa på en hydrologisk balans runt -35 TWh under Q1-14 så hamnar vi i samma läge som vi hade år 2010 och 2011. Dessa år hade vi en marginalkostnad för kol på €34/MWh respektive €47/MWh, alltså betydligt högre än dagens €28/MWh. 2010 är väl isåfall det år som liknar nuvarande situation bäst då vi hade ett kolpris på ungefär samma nivå som idag men ett CO2 pris på ca €12/MWh. Detta år trodde man i oktober på ett spotpris under Q1 på ca €37/MWh men det blev hela €59,5/MWh! Tyskland (base) landade dock ca €18/MWh under vårt nordiska spotpris. Med vårt dåliga hydrologiska läge fick vi alltså importera kraft till tyska peaknivåer.
Sammanfattningsvis kan man alltså säga att Q1-14 verkar rimligt prissatt idag om det hydrologiska läget stannar på ca -15 TWh men att det finns en betydande uppsida om hydrologin försämras mot -30 TWh. Flera analytiker menar dessutom att vi kan räkna med att priserna i Tyskland under fler timmar än tidigare kan gå upp till marginalkostnaden för gas (ca €50-55/MWh och upp till €70/MWh för kortsiktig uppstart) då den är mer lättreglerad än kol vilket behövs när inte den förnybara kraften räcker till. Generellt så ser vi att spotpriserna i allt större utsträckning påverkas av sol- och vindförhållanderna på kontinenten. Vi har också frågan om CO2 där normalt €1/t uppgång i priset på utsläppsrätter påverkar det nordiska elpriset med ca €0,8/MWh.
Hur ser då utsikterna ut?
Så hur ser det nu ut, vad är sannolikheten för att vi ska få en torr fortsättning på hösten och början på vintern? Lutar det åt en kall eller mild vinter? Kan vi se ökade CO2 priser redan innan årsskiftet? Det är naturligtvis omöjligt att sia om vädret så här tidigt men Georg Müller, meteorolog på Thomson Reuters Point Carbon, och flera med honom menar att vi nog kan få se en relativt mild och våt november medan december och januari troligen kommer bli mer åt det kalla och torra hållet. Vi ser inga tecken på en uppgång i bränslepriser under de närmaste två kvartalen och kärnkraftprognserna pekar på ca 90% tillgänglighet under vintern. Hur mycket vind och sol vi kommer se i Tyskland är tyvärr mycket svårt att ha en prognos på för så lång sikt. När det gäller CO2 så räknar man med att få ett beslut kring ”back-loading” av utsläppsrätter i slutet av året och det verkar i nuläget bli ett positivt utslag vilket troligen kommer få priserna att stiga ett par euro, alltså även här är risken på uppsidan. Vi räknar dock inte med något mer klargörande kring en mer långsiktig lösning på de låga CO2 priserna denna sida av årsskiftet.
Risker på nedsidan
Riskerna på nedsidan är att det blir en betydligt våtare höst/start på vinter än väntat och att hydroläget då förbättras till runt normalen. Då kan vi se lägre terminspriser på Q1-14, ev. ner till runt €40/MWh nivån. Trots att vi, när vi fundamentalt jämför oss med tidigare år, borde kunna ligga ytterligare något lägre så finns där en riskpremie för dålig tillgång på förnyelsebar kraft. Dåligt med vindkraft i Norden och vind– och solkraft på kontinenten skulle innebära tillfälliga importbehov där den reglerbara gaskraften är prissättande. När det gäller leverans så kan spotpriserna under Q1-14 dock mycket väl bli än lägre vid en hydrologi runt normalen, bra med kärnkraft och relativt milt väder. 2012 hade vi t.ex. ett genomsnittligt spotpris under jan-mars på €38,2/ MWh (i linje med dåvarande marginalkostnad på kol) trots ett underskott på -7 TWh. Vi hade då 85 % kärnkrafttillgänglighet i Sverige.
Kort slutsats
Hur sammanfattar vi då allt det här? Jo, vi anser i nuläget att riskerna på uppsidan för terminskontraktet Q1-14 är större än på nedsidan. Får vi se samma utveckling som flera tidigare år där hydrobalansen försämrats kraftigt fram till årsskiftet, prognoser pekar på en kall vinter och om dessutom kärnkraften skulle fortsätta strula kan vi mycket väl närma oss tyska peakpriser runt €50-55/MWh.
Författare: Mia Bodin
[box]Denna artikel om elpriset publiceras på Råvarumarknaden.se med tillstånd och i samarbete med Modity Energy Trading.[/box]
Ansvarsfriskrivning
Energimarknadskommentaren har producerats av Modity Energy Trading. Informationen är rapporterad i god tro och speglar de aktuella åsikterna hos medarbetarna, dessa kan ändras utan varsel. Modity Energy Trading tar inget ansvar för handlingar baserade på informationen.
Om Modity Energy Trading
Modity Energy Trading erbjuder energibolag och större företag den erfarenhet, kompetens och analysredskap som krävs för en trygg och effektiv förvaltning av energiportföljen. Modity bedriver handel med allt från el, gas och biobränslen till elcertifikat, valutor och utsläppsrätter. Företagets kunder får dessutom ta del av deras analysprodukter som t.ex det fullständiga marknadsbrevet med ytterligare kommentarer och prognoser. För ytterligare information se hemsidan.


Parts of the Brent crude curve dipping into the high $50ies/b. Brent crude fell 2.3% over the week to Friday. It closed the week at $61.29/b, a slight gain on the day, but also traded to a low of $60.14/b that same day and just barely avoided trading into the $50ies/b. This morning it is risk-on in equities which seems to help industrial metals a little higher. But no such luck for oil. It is down 0.8% at $60.8/b. This week looks set for Brent crude to dip its feet in the $50ies/b. The Brent 3mth contract actually traded into the high $50ies/b on Friday.

The front-end backwardation has been on a weakening foot and is now about to fully disappear. The lowest point of the crude oil curve has also moved steadily lower and lower and its discount to the 5yr contract is now $6.8/b. A solid contango. The Brent 3mth contract did actually dip into the $50ies/b intraday on Friday when it traded to a low point of $59.93/b.
More weakness to come as lots of oil at sea comes to ports. Mid-East OPEC countries have boosted exports along with lower post summer consumption and higher production. The result is highly visibly in oil at sea which increased by 17 mb to 1,311 mb over the week to Sunday. Up 185 mb since mid-August. On its way to discharge at a port somewhere over the coming month or two.
Don’t forget that the oil market path ahead is all down to OPEC+. Remember that what is playing out in the oil market now is all by design by OPEC+. The group has decided that the unwind of the voluntary cuts is what it wants to do. In a combination of meeting demand from consumers as well as taking back market share. But we need to remember that how this plays out going forward is all at the mercy of what OPEC+ decides to do. It will halt the unwinding at some point. It will revert to cuts instead of unwind at some point.
A few months with Brent at $55/b and 40-50 US shale oil rigs kicked out may be what is needed. We think OPEC+ needs to see the exit of another 40-50 drilling rigs in the US shale oil patches to set US shale oil production on a path to of a 1 mb/d year on year decline Dec-25 to Dec-26. We are not there yet. But a 2-3 months period with Brent crude averaging $55/b would probably do it.
Oil on water increased 17 mb over the week to Sunday while oil in transit increased by 23 mb. So less oil was standing still. More was moving.

Crude oil floating storage (stationary more than 7 days). Down 11 mb over week to Sunday

The lowest point of the Brent crude oil curve versus the 5yr contract. Weakest so far this year.

Crude oil 1mth to 3mth time-spreads. Dubai held out strongly through summer, but then that center of strength fell apart in late September and has been leading weakness in crude curves lower since then.

Rebounding along with most markets. But concerns over solidity of Gaza peace may also contribute. Brent crude fell 0.8% yesterday to $61.91/b and its lowest close since May this year. This morning it is bouncing up 0.9% to $62.5/b along with a softer USD amid positive sentiment with both equities and industrial metals moving higher. Concerns that the peace in Gaza may be less solid than what one might hope for also yields some support to Brent. Bets on tech stocks are rebounding, defying fears of trade war. Money moving back into markets. Gold continues upwards its strong trend and a softer dollar helps it higher today as well.
US crude & products probably rose 5.6 mb last week (API) versus a normal seasonal decline of 2.4 mb. The US API last night partial and thus indicative data for US oil inventories. Their data indicates that US crude stocks rose 7.4 mb last week, gasoline stocks rose 3.0 mb while Distillate stocks fell 4.8 mb. Altogether an increase in commercial crude and product stocks of 5.6 mb. Commercial US crude and product stocks normally decline by 2.4 mb this time of year. So seasonally adjusted the US inventories rose 8 mb last week according to the indicative numbers by the API. That is a lot. Also, the counter seasonal trend of rising stocks versus normally declining stocks this time of year looks on a solid pace of continuation. If the API is correct then total US crude and product stocks would stand 41 mb higher than one year ago and 6 mb higher than the 2015-19 average. And if we combine this with our knowledge of a sharp increase in production and exports by OPEC(+) and a large increase in oil at sea, then the current trend in US oil inventories looks set to continue. So higher stocks and lower crude oil prices until OPEC(+) switch to cuts. Actual US oil inventory data today at 18:00 CET.
US commercial crude and product stocks rising to 1293 mb in week 41 if last nights indicative numbers from API are correct.

Crude oil soon coming to a port near you. OPEC has lifted production sharply higher this autumn. At the same time demand for oil in the Middle-East has fallen as we have moved out of summer heat and crude oil burn for power for air-conditioning. The Middle-East oil producers have thus been able to lift exports higher on both accounts. Crude oil and condensates on water has shot up by 177 mb since mid-August. This oil is now on its way to ports around the world. And when they arrive, it will likely help to lift stocks onshore higher. That is probably when we will lose the last bit of front-end backwardation the the crude oil curves. That will help to drive the front-month Brent crude oil price down to the $60/b line and revisit the high $50ies/b. Then the eyes will be all back on OPEC+ when they meet in early November and then again in early December.
Crude oil and condensates at sea have moved straight up by 177 mb since mid-August as OPEC(+) has produced more, consumed less and exported more.

When it starts to move lower it moves rather quickly. Gaza, China, IEA. Brent crude is down 2.1% today to $62/b after having traded as high as $66.58/b last Thursday and above $70/b in late September. The sell-off follows the truce/peace in Gaze, a flareup in US-China trade and yet another bearish oil outlook from the IEA.
A lasting peace in Gaze could drive crude oil at sea to onshore stocks. A lasting peace in Gaza would probably calm down the Houthis and thus allow more normal shipments of crude oil to sail through the Suez Canal, the Red Sea and out through the Bab-el-Mandeb Strait. Crude oil at sea has risen from 48 mb in April to now 91 mb versus a pre-Covid normal of about 50-60 mb. The rise to 91 mb is probably the result of crude sailing around Africa to be shot to pieces by the Houthis. If sailings were to normalize through the Suez Canal, then it could free up some 40 mb in transit at sea moving onshore into stocks.
The US-China trade conflict is of course bearish for demand if it continues.
Bearish IEA yet again. Getting closer to 2026. Credibility rises. We expect OPEC to cut end of 2025. The bearish monthly report from the IEA is what it is, but the closer we get to 2026, the more likely the IEA is of being ball-park right in its outlook. In its monthly report today the IEA estimates that the need for crude oil from OPEC in 2026 will be 25.4 mb/d versus production by the group in September of 29.1 mb/d. The group thus needs to do some serious cutting at the end of 2025 if it wants to keep the market balanced and avoid inventories from skyrocketing. Given that IEA is correct that is. We do however expect OPEC to implement cuts to avoid a large increase in inventories in Q1-26. The group will probably revert to cuts either at its early December meeting when they discuss production for January or in early January when they discuss production for February. The oil price will likely head yet lower until the group reverts to cuts.
Dubai: The Mid-East anchor dragging crude oil lower. Surplus emerging in Mid-East pricing. Crude oil prices held surprisingly strong all through the summer. A sign and a key source of that strength came from the strength in the front-end backwardation of the Dubai crude oil curve. It held out strong from mid-June and all until late September with an average 1-3mth time-spread premium of $1.8/b from mid-June to end of September. The 1-3mth time-spreads for Brent and WTI however were in steady deterioration from late June while their flat prices probably were held up by the strength coming from the Persian Gulf. Then in late September the strength in the Dubai curve suddenly collapsed. Since the start of October it has been weaker than both the Brent and the WTI curves. The Dubai 1-3mth time-spread now only stands at $0.25/b. The Middle East is now exporting more as it is producing more and also consuming less following elevated summer crude burn for power (Aircon) etc.
The only bear-element missing is a sudden and solid rise in OECD stocks. The only thing that is missing for the bear-case everyone have been waiting for is a solid, visible rise in OECD stocks in general and US oil stocks specifically. So watch out for US API indications tomorrow and official US oil inventories on Thursday.
No sign of any kind of fire-sale of oil from Saudi Arabia yet. To what we can see, Saudi Arabia is not at all struggling to sell its oil. It only lowered its Official Selling Prices (OSPs) to Asia marginally for November. A surplus market + Saudi determination to sell its oil to the market would normally lead to a sharp lowering of Saudi OSPs to Asia. Not yet at least and not for November.
The 5yr contract close to fixed at $68/b. Of importance with respect to how far down oil can/will go. When the oil market moves into a surplus then the spot price starts to trade in a large discount to the 5yr contract. Typically $10-15/b below the 5yr contract on average in bear-years (2009, 2015, 2016, 2020). But the 5yr contract is usually pulled lower as well thus making this approach a moving target. But the 5yr contract price has now been rock solidly been pegged to $68/b since 2022. And in the 2022 bull-year (Brent spot average $99/b), the 5yr contract only went to $72/b on average. If we assume that the same goes for the downside and that 2026 is a bear-year then the 5yr goes to $64/b while the spot is trading at a $10-15/b discount to that. That would imply an average spot price next year of $49-54/b. But that is if OPEC doesn’t revert to cuts and instead keeps production flowing. We think OPEC(+) will trim/cut production as needed into 2026 to prevent a huge build-up in global oil stocks and a crash in prices. But for now we are still heading lower. Into the $50ies/b.


Australien och USA investerar 8,5 miljarder USD för försörjningskedja av kritiska mineraler
Brent crude set to dip its feet into the high $50ies/b this week

Vad guldets uppgång egentligen betyder för världen

Spotpriset på guld över 4300 USD och silver över 54 USD
Crude oil soon coming to a port near you

OPEC+ missar produktionsmål, stöder oljepriserna

Goldman Sachs höjer prognosen för guld, tror priset når 4900 USD

Ett samtal om guld, olja, fjärrvärme och förnybar energi

Blykalla och amerikanska Oklo inleder ett samarbete
Guld nära 4000 USD och silver 50 USD, därför kan de fortsätta stiga
-
 Nyheter4 veckor sedan
OPEC+ missar produktionsmål, stöder oljepriserna
-
 Nyheter2 veckor sedan
Goldman Sachs höjer prognosen för guld, tror priset når 4900 USD
-
 Nyheter4 veckor sedan
Ett samtal om guld, olja, fjärrvärme och förnybar energi
-
 Nyheter3 veckor sedan
Blykalla och amerikanska Oklo inleder ett samarbete
-
 Nyheter3 veckor sedan
Guld nära 4000 USD och silver 50 USD, därför kan de fortsätta stiga
-
Analys4 veckor sedan
Are Ukraine’s attacks on Russian energy infrastructure working?
-

 Nyheter4 veckor sedan
Guldpriset uppe på nya höjder, nu 3750 USD
-
Nyheter3 veckor sedan
Ett samtal om guld, olja, koppar och stål