

Analys
SHB Råvarubrevet 15 november 2013

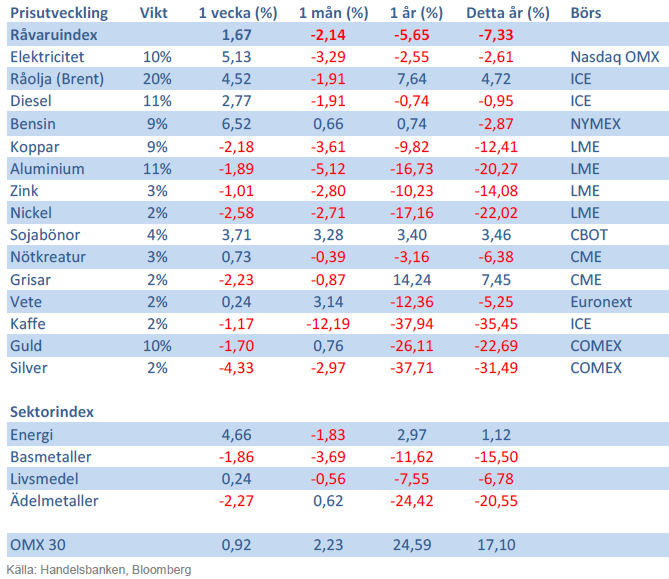
 Råvaror allmänt
Ökad sysselsättning i USA
Positiv data i form av Amerikansk sysselsättning gav stöd åt råvarumarknaden. Sysselsättningen för oktober steg kraftigt och sysselsättningen för september reviderades upp. Med tanke på nedstängningen av en del statliga myndigheter och de svårigheter som då uppstod var utfallet klart över förväntan. Det starka utfallet ökar på marginalen sannolikheten för att Federal Reserve påbörjar nedskalningen av obligationsköp och vilket fart på globala långräntor. Å andra sidan, med anledning av nedstängningen är oktoberdata svårtolkad, inte minst då statistiska undersökningar inte kunnat utföras enligt normala rutiner. Så det är inte helt självklart att sysselsättning förblir över 200 000 framöver.
Janet Yellen kommer med största sannolikhet att efterträda Fedchefen Ben Bernanke när hans mandatperiod tar slut den 31 januari. Yellen är en stark anhängare av kvantitativa lättnader (obligationsköp) och veckans utfrågning i Senaten var ett kvitto på att Fed lär fortsätta på inslagen linje under hennes ledning. Det bidrog till ökad riskaptit då investerare tolkade det som att en minskning av tillgångsköpen inte ligger runt hörnet ännu.
Utfallet från strategimötet i Kina som påbörjades förra fredagen har ännu inte publicerats. Tillväxtstarka uttalande kommer ge råvaror en fortsatt skjuts uppåt och vi ser speciellt basmetaller som köpvärda.
Basmetaller
Fallande priser för metallerna
Handelsbankens basmetallindex faller drygt 1 % under veckan. Yellens uttalande vid nomineringsutfrågningen i torsdags tolkades som mjuka av marknaden då inga tydliga besked om tapering gavs. Detta skapade visserligen uppgångar men de stora metallerna koppar, aluminium, nickel och zink slutar veckan på minus. Koppar leder nedgången med nästan 3 procent, bland annat till följd av data som visar på fallande investeringar i kraftnätverk i Kina, som är ner 20% y-o-y. Koppar till bland annat kraftledningar står för 40 % av Kinas totala kopparkonsumtion.
LME meddelade förra veckan att de inför kortare leveranstider från börsens lager från och med 1 april 2014. Långa kötider har som bekant pressat upp fysikiska premier (med 100-200 procent över 10 årsnittet). Regleringen innebär förkortning av leveranstiden från 100 till 50 dagar. Trots fallande priser denna vecka tycker vi metallerna ser köpvärda ut. Visar ledarna i Kina på starka tillväxtmål gäller det att vara positionerad för en uppgång.
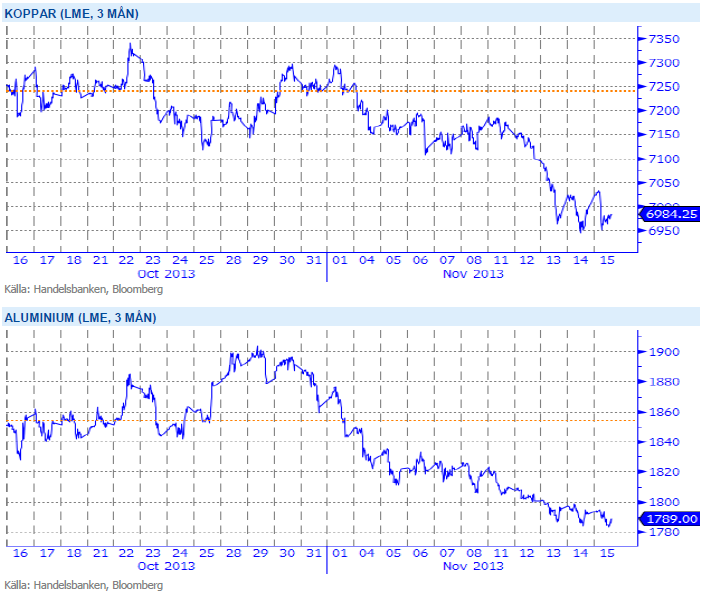
Vi tror att Kinas tillväxt kommer överraska positivt under Q4 och Q1, vilket kommer stärka metallerna. Vi tror på: LONG BASMETALLER
Ädelmetaller
Guldet fortsätter sin väg ned
En ganska händelsefattig vecka för guldet närmar sig sitt slut, och vi bibehåller vår negativa syn på ädelmetallsektorn. Guldet handlar nu 1.5 % lägre än förra veckan, och större delen av prisfallet inträffade vid förra fredagens starka arbetslöshetsstatistik från USA.
Den troliga utnämningen av Janet Yellen som Bernankes efterträdare vid Fed-rodret borde peka mot ytterligare stimulativ penningpolitik i USA (kvantitativa lättnader) och en förskjutning av tapering in i framtiden. Detta ska ställas mot förbättrad amerikansk ekonomisk statistik. Samtidigt ser bilden lite svagare ut i Europa igen efter ECB:s sänkning, och bilden för guldet är alltjämt oklar. Veckan som gått har sett ytterligare små utflöden ur guld-ETF:er, en trend som pågått ända sedan årsskiftet då guldet handlade strax under 1700 USD per uns. Investeringsflödena ger därmed inget stöd för någon teori om att guldets vändning uppåt skulle vara nära i antågande.
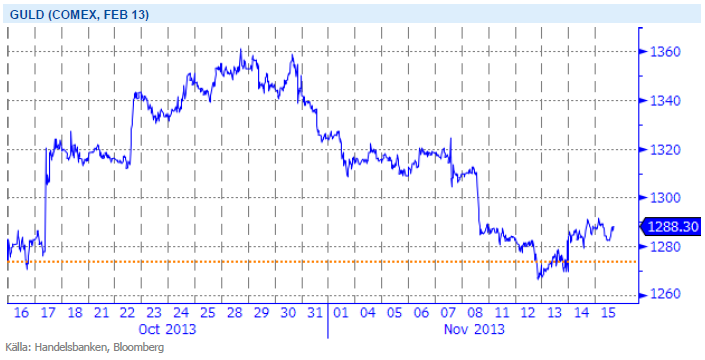
Efter en uppgång under sommaren tror vi åter att guldets väg lutar utför. Vi tror på: SHRT GULD H
Energi
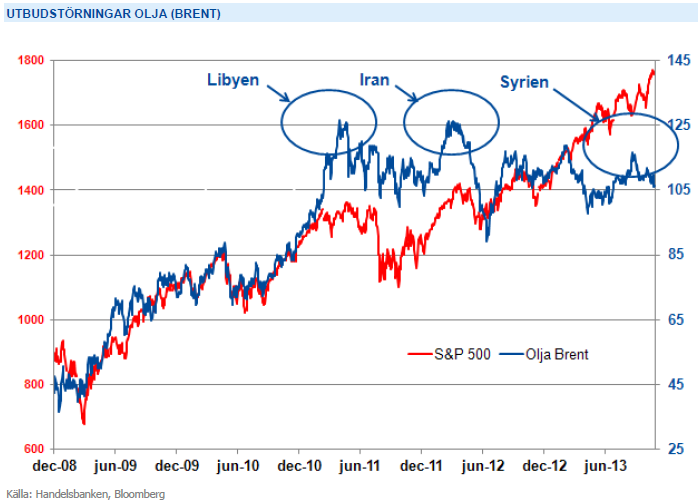
Osäkerhet i Libyen stärker oljan
Oljemarknaden stiger närmare 3 procent under veckan med stöd från amerikansk sysselsättningsstatistik och den politiska oron i Libyen. Även om amerikanska lagersiffror fortsätter stiga mot förväntan tror vi att oljepriset kan komma att stiga något ytterligare, främst med tanke på osäkerheten i Libyens utbud och det ständigt återkommande säkerhetsfrågorna kring Iran vilket motiverar en liten riskpremie även om det fundamentalt ser något bättre än för några veckor sedan. Vi går mot vintertid vilket snabbt kan driva på oron kring en låg reservkapacitet så vi ligger fast med vår syn om att Brentoljan alltid är köpvärd ner mot nivåer om 104-105 dollar med potential på uppsidan.
Elmarknaden fortsätter att stiga med närmare 2 procent denna vecka som ett resultat av en något starkare Tysk marknad och utsikter om mer normalt väder från inledningen av nästa vecka samtidigt som energikolet som väntat finner stöd på dessa låga nivåer. Energibalansen visar på ett underskott om 18 TWh mot normalen och Forsmark 1 har gått halvt ur drift pga av dränageläckage så vår positiva syn på prisutvecklingen kvarstår.
Energiunderskott tillsammans med osäkerhet kring kärnkraftsverken inför vintern talar för högre elpris. Vi tror på: LONG EL
Livsmedel
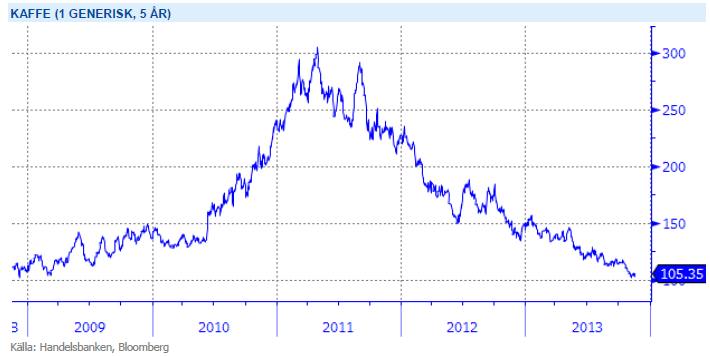
Kaffepriset ned 66% sedan maj 2012
Terminspriset (marskontraktet) på Arabicakaffe i New York bröt genom 1.10 dollar/Ib nivån i slutet av oktober och har inte riktigt orkat ta sig upp igen sen dess. Kaffepriset har fallit 66 procent sedan maj 2011 och handlas idag på samma nivå som mars 2009. Den totala produktionen från de största kaffe-exportörerna för kaffeåret 2012/2013 uppskattas landa på rekordnivåer och likaså den totala exporten.
Det är naturligtvis för tidigt att göra en rättvis uppskattning av världsproduktionen för kaffeåret 2013/2014 och efter nästan tre raka år med fallande priser har vi ännu inte sett ett trendbrott. Men det som bl.a. talar för en uppsida är de låga priserna som kan komma att avskräcka kaffeodlarna från att vilja investera i kaffebönor. Även defekter från bladsvamp i Mexico och Centralamerika, som orsakade ett produktionsbortfall på 2.7 miljoner bags (1 bag=60 kg) 2012/2013, sägs ha en signifikant effekt på kommande skörd. Lägg därtill att världskonsumtionen väntas stiga med 2,4 procent i snitt årligen.
Försening av skörden efter längre perioder av nederbörd i Brasilien samt en stark brasiliansk real driver upp sockerpriset. Vi tror på: BULL SOCKER
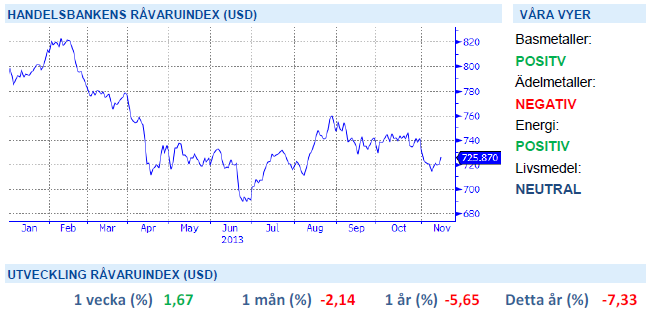
Handelsbankens Råvaruindex
Handelsbankens råvaruindex består av de underliggande indexen för respektive råvara. Vikterna är bestämda till hälften från värdet av nordisk produktion (globala produktionen för sektorindex) och till hälften från likviditeten i terminskontrakten.
[box]SHB Råvarubrevet är producerat av Handelsbanken och publiceras i samarbete och med tillstånd på Råvarumarknaden.se[/box]
Ansvarsbegränsning
Detta material är producerat av Svenska Handelsbanken AB (publ) i fortsättningen kallad Handelsbanken. De som arbetar med innehållet är inte analytiker och materialet är inte oberoende investeringsanalys. Innehållet är uteslutande avsett för kunder i Sverige. Syftet är att ge en allmän information till Handelsbankens kunder och utgör inte ett personligt investeringsråd eller en personlig rekommendation. Informationen ska inte ensamt utgöra underlag för investeringsbeslut. Kunder bör inhämta råd från sina rådgivare och basera sina investeringsbeslut utifrån egen erfarenhet.
Informationen i materialet kan ändras och också avvika från de åsikter som uttrycks i oberoende investeringsanalyser från Handelsbanken. Informationen grundar sig på allmänt tillgänglig information och är hämtad från källor som bedöms som tillförlitliga, men riktigheten kan inte garanteras och informationen kan vara ofullständig eller nedkortad. Ingen del av förslaget får reproduceras eller distribueras till någon annan person utan att Handelsbanken dessförinnan lämnat sitt skriftliga medgivande. Handelsbanken ansvarar inte för att materialet används på ett sätt som strider mot förbudet mot vidarebefordran eller offentliggörs i strid med bankens regler.


Market is starting to take US/Iran headlines with a pinch of salt. Brent crude rose $2.8/b yesterday to an official close of $112.1/b. But after that it traded as low as $108.05/b before ending late night at around $109.7/b. Through the day it traded in a range of $106.87 – 112.72/b amid a flurry of news or rumors from Iran and the US. ”US temporary sanctions during negotiations” (falls alarm). ”We will bomb Iran” (not anyhow),… etc. While the market is still fluctuating to this kind of news flow, it is starting to take such headlines with a pinch of salt.

We’ll see. Maybe, maybe not. The Brent M1 contract is trading at $110.2/b this morning which very close to the average ticks through yesterday of $110.4/b.
Trump with bearish, verbal intervention whenever Brent trades above $110/b it seems. What seems to be a pattern is that Trump states something like ”very good negotiations going on with Iran”, ”New leaders in Iran are great,..”, ”Great progress in negotiations,…”, ”Deal in sight,..” etc whenever the Brent M1 contract trades above $110/b. An effort to cool the market. These hot air verbal interventions from Trump used to have a heavy bearish impact on prices, but they now seems to have less and less effect unless they are backed by reality.
As far as we can see there has been no real progress in the negotiations between the US and Iran with both sides still standing by their previous demands.
Iran is getting stronger while the cease fire lasts making a return to war for Trump yet harder. Iran is naturally in constant preparation for a return to war given Trump’s steady threats of bombing Iran again. Iran is naturally doing what ever is possible to prepare for a return to war. And every day the cease fire lasts it is better prepared. This naturally makes it more and more difficult and dangerous for the US to return to warring activity versus Iran as the consequences for energy infrastructure in the Persian Gulf will be more and more severe the longer the cease fire lasts. Israel seems to see it this way as well. That the war is not won and that current frozen state of a cease fire gives Iran opportunity to rebuild military and politically.
Global inventories are drawing down day by day. How much? In the meantime the Strait of Hormuz stays closed. There is varying measures and estimates of how much global inventories are drawing down. Our rough estimate, back of the envelope, is that global inventories are drawing down by at least some 10 mb/d or about 300 mb/d in a balance between loss of supply versus demand destruction. Other estimates we see are a monthly draw of 250-270 mb/d. The IEA only ’measured’ a draw in global observable stocks of 117 mb in April with oil on water rising 53 mb while on shore stocks fell 170 mb. But global stocks are hard to measure with large invisible, unmeasured stocks. As such a back of the envelope approach may be better.
Oil products is what the world is consuming. Oil product prices likely to rise while product stocks fall. Strategic Petroleum Reserves (SPR) are predominantly crude oil. Discharging oil from OECD SPR stocks, a sharp reduction in Chinese crude imports and a reduction in global refinery throughput of 6-7 mb/d has helped to keep crude oil markets satisfactorily supplied. But global inventories are drawing down none the less. And oil products is really what the world is consuming. So if global refinery throughput stays subdued, then demand will eventually have to match the supply of oil products. The likely path forward this summer is a steady draw down in jet fuel, diesel and gasoline. Higher prices for these. Then, if possible, higher refinery throughput and higher usage of crude in response to very profitable refinery margins. And lastly sharper draw in crude stocks and higher prices for these. But some 6 mb/d of oil products used to be exported through the Strait of Hormuz. And it may not be so easy to ramp up refinery activity across the world to compensate. Especially as Ukraine continues to damage Russian refineries as well as Russian crude production and export facilities.
Watch oil product stocks and prices as well as Brent calendar 2027. What to watch for this summer is thus oil product inventories falling and oil product premiums to crude rising. Another measure to watch is the Brent crude 2027 contract as it rises steadily day by day as the Strait of Hormuz stays closed and global oil inventories decline. The latter is close to the highest level since the start of the war and keeps rising.
The Brent M1 contract and the Brent 2027 prices and current price of jet fuel in Europe (ARA). All in USD/b

Our back of the envelope calculation of the global shortage created by the closure of the Strait of Hormuz. Note that 3.5 mb/d of discharge from SPR is also a draw. Note also that ’Forced demand loss’ of 2.5 mb/d is probably temporary and will fall back towards zero as logistics are sorted out leaving ’Price demand loss’ to do the job of balancing the market. Thus a shortfall of at least 9 mb/d created by the closure. More if SPR discharge is included and more if Forced demand loss recedes.

Brent is climbing higher. Front-month is at USD 106.3/bl this morning, close to a weekly high and a USD 9/bl jump from Mondays open. This is the move we flagged as a risk earlier in the week: the market shifting from ”a deal is around the corner” to ”this is going to take longer than we thought”.

Analyst Commodities, SEB
During April, rest-of-year Brent remained remarkably stable around USD 90/bl. A stability which rested on one single assumption: the SoH reopens around 1 May. That assumption is now slowly falling apart.
As we highlighted yesterday: every week of delay beyond 1 May adds (theoretically) ish USD 5/bl to the rest-of-year average, as global inventories draw 100 million barrels per week. i.e., a mid-May reopening implies rest-of-year Brent closer to USD 100/bl, and anything pushing into June or July takes us meaningfully higher.
What’s changed in the last 48 hours:
#1: The US military has formally warned that clearing suspected sea mines from SoH could take up to six months. That is a completely different timescale from what the financial market is pricing. Even a political deal tomorrow does not immediately reopen the strait.
#2: Trump has shifted his tone from urgency to ”strategic patience”. In yesterday’s press conference: ”Don’t rush me… I want a great deal.” The market is reading this as a president no longer feeling pressured by timelines, with the naval blockade running in the background.
#3: So far, the military activity is escalating, not de-escalating. Axios reports Iran is laying more mines in SoH. The US 3rd carrier strike group (USS George H.W. Bush) is arriving with two countermine vessels. Trump yesterday ordered the US Navy to destroy any Iranian boats caught laying mines. While CNN reports that the Pentagon is actively drawing up plans to strike Iranian SoH capabilities and individual Iranian military leaders if the ceasefire collapses. i.e., NOT a attitude consistent with an imminent deal!
Spot crude and product prices eased off the early-April highs on a combination of system rerouting and deal optimism. Both now weakening. Goldman estimates April Gulf output is reduced by 14.5 mbl/d, or 57% of pre-war supply, a number that keeps getting worse the longer this drags on.
Demand-side adaptation is ongoing: S. Korea has cut its Middle East crude dependence from 69% to 56% by pulling more from the Americas and Africa, and Japan is kicking off a second round of SPR releases from 1 May. But SPRs are finite.
Ref. to the negotiations, we should not bet on speed. The current Iranian leadership is dominated by genuine hardliners willing to absorb economic pain and run the clock to extract concessions. That is not a setup for a rapid resolution. US/Israeli media briefings keep framing the delay as ”internal Iranian divisions”, the reality is more complicated and points toward weeks and months, not days.
Our point is that the complexity is large, and higher prices have only just started (given a scenario where the negotiations drag out in time). The market spent April leaning on the USD 90/bl rest-of-year assumption; that case is diminishing by the hour. If ”early May reopening” is replaced by ”June, July or later” over the next week or two, both crude and products have meaningful room to reprice higher from here. There is a high risk being short energy and betting on any immediate political resolution(!).
Down on Friday. Up on Monday. The Brent June crude oil contract traded down 5.1% last week to a close of $90.38/b. It reached a high of $103.87/b last Monday and a low of $86.09/b on Friday as Iran announced that the Strait of Hormuz was fully open for transit. That quickly changed over the weekend as the US upheld its blockade of Iranian oil exports while Iran naturally responded by closing the SoH again. The US blew a hole in the engine room of the Iranian ship TOUSKA and took custody of the ship on Sunday. Brent crude is up 5.6% this morning to $95.4/b.
The cease-fire is expiring tomorrow. The US has said it will send a delegation for a second round of negotiations in Islamabad in Pakistan. But Iran has for now rejected a second round of talks as it views US demands as unrealistic and excessive while the US is also blocking the Strait of Hormuz.
While Brent is up 5% this morning, the financial market is still very optimistic that progress will be made. That talks will continue and that the SoH will fully open by the start of May which is consistent with a rest-of-year average Brent crude oil price of around $90/b with the market now trading that balance at around $88/b.
Financial optimism vs. physical deterioration. We have a divergence where the financial market is trading negotiations, improvements and resolution while at the same time the physical market is deteriorating day by day. Physical oil flows remain constrained by disrupted flows, longer voyage times and elevated freight and insurance costs.
Financial markets are betting that a US/Iranian resolution will save us in time from violent shortages down the road. But every day that the SoH remains closed is bringing us closer to a potentially very painful point of shortages and much higher prices.
The US blockade is also a weapon of leverage against its European and Asian allies. When Iran closed the SoH it held the world economy as a hostage against the US. The US blockade of the SoH is of course blocking Iranian oil exports. But it is also an action of disruption directed towards Europe and Asia. The US has called for the rest of the world to engaged in the war with Iran: ”If you want oil from the Persian Gulf, then go and get it”. A risk is that the US plays brinkmanship with the global oil market directed towards its European and Asian allies and maybe even towards China to force them to engage and take part. Maybe unthinkable. But unthinkable has become the norm with Trump in the White House.


Sommarväder skapar prisrally på elbörsen
Oil product price pain is set to rise as the Strait of Hormuz stays closed into summer

Solkraften pressar elpriserna dagtid

Michel Gubel ger sin syn på oljemarknaden