

Analys
SHB Råvarubrevet 14 mars 2014

Råvaror allmänt: Säsongsmässig nedgång på ingång
 Veckan bjöd på mycket svag data, främst från Kina där industriproduktion och export fallit dramatiskt. Marknaden börjar vackla i övertygelsen om att vädrets makter ligger bakom den oväntat svaga amerikanska statistiken under de senaste månaderna. Fortfarande har dock tex räntemarknaden prisat in att data ska studsa upp till nivåer där vi avslutade förra året men det ter sig allt mer osannolikt och nedsiderisken har ökat under denna vecka. Årets råvaruår har verkligen fått en smakstart med kaffe upp 75 %, lean hogs upp 36 %, guld, majs, nickel och kakao upp 12 %. I bottenträsket hittar vi el och koppar som tappat omkring 12 %. Spridningen är stor och råvarors egen fundamenta har verkligen tagit över efter ett antal år där råvaror följt aktier under centralbankernas piska.
Nu tror vi inte att årets inledande trend kommer vara speciellt länge. Väderdrivna prisuppgångar är tillfälliga till sin natur. Krisen i Ukraina verkar inte eskalera till krig, Putins rörelseutrymme har indirekt minskat i och med utländska investerares rädsla för Ryssland. Framför oss ligger istället en säsongsmässigt svag period då Kina tar råvaror från lager som byggts upp under det industriproduktionssvaga första kvartalet. Då infaller det kinesiska nyårsfirandet och många industriarbetsdagar ersätts av ledighet. Därefter dröjer det till mitten av sommaren före Kina åter brukar öka importen av råvaror för att fylla upp inför årets fjärde kvartal som tillsammans med det andra är årets starkaste i termer av industriproduktion. Kinas lagercykel skapar ett säsongsmönster där man ska sälja råvaror före påsk och köpa dem lagom till midsommarsillen. Vi ser inget tecken på att detta år skall bli annorlunda. Därför byter vi syn på energi och basmetaller till sälj. Vi behåller dock får positiva syn på nickel som drivs av Indonesiens exportstop och ser inget skäl till att den stigande trenden för guld och kaffe ska brytas.
Basmetaller: Svagt för koppar och järnmalm
Veckan har fortsatt turbulent för koppar och järnmalm. Järnmalmspriset (62% Fe till Kina) föll med närmare 12 procent då oron för hög skuldsättning/överkapacitet tynger sektorn. Givet att Kina svarar för 40-50% av den globala järnmalm- och kopparkonsumtionen så blir effekten av kinaoro stor på just dessa råvaror. Rörelsen på järnmalm accelererades av diverse aggressiva försök att likvidera laster som använts som säkerhet för lån på något högra nivåer (järnmalm och koppar används i stor utsträckning som säkerhet för lån pga av strama kreditförhållanden i Kina). Denna lagerfinansiering har gjort att de kinesiska lagren skjutit iväg till rekordnivåer på uppemot 105 miljoner ton. Spotmarknaden har återhämtat närmare hälften av rörelsen mot slutet av veckan. Vi tror på fortsatt kopparfall och baserar det till 50 % på kinesisk lagercykel där lagren nu är välfyllda efter senaste månadernas höga import, 25 % på allmän kinaoro i spåren av kreditåtstramning och 25 % drivet av risk för att amerikansk makro blir en negativ överraskning framöver.
Marknaden har redan prisat in en studs upp i USA:s inköpschefsindex och risken ligger därför på nedsidan. Även om prisutvecklingen enbart följer kinesiskt säsongsmönster från de senaste fyra åren så spår vi att restockingperioden precis avslutats och destocking (från höga lager av järnmalm och normalhöga lager på koppar) nu tar över och kan fortgå ända till sommaren.
Vi håller en negativ vy för basmetaller generellt givet säsongsmönster, men håller fortsatt nickel som köpvärd.
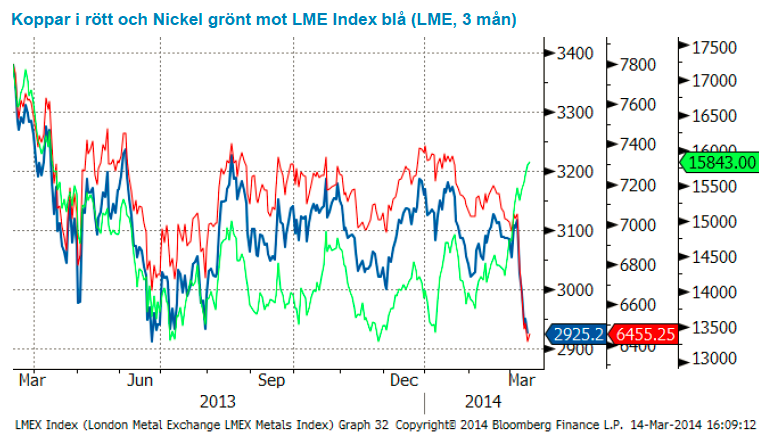
Låga prisnivåer, exportstopp av oförädlad nickelmalm från Indonesien och det faktum att 40 % av gruvorna går med förlust på dagens prisnivå. Vi tror på: LONG NICKEL H
Ädelmetaller: Ytterligare en bra vecka för guldet
Ännu en bra vecka läggs till handlingarna för guldet som stiger med närmare 2 procent, en solid uppgång trots ett minskat fokus på Ukraina. Guld kan därmed sägas vara tillbaks i en situation där det stiger på egna meriter.
Flödena fortsätter in i guld-ETF och en upptrappning av retoriken runt Ryssland och Ukraina skulle sannolikt öka farten i prisuppgången.
Vår positiva syn bygger fortfarande på att marknaden blev alltför negativ efter förra årets fall, och att man därmed inte ligger positionerad för en rekyl, och att guldet visar bra motståndskraft mot signaler om att Fed ska dra tillbaks sin extrema stimulans.
Guldet går bra fortfarande, och som man säger i marknaden ”The trend is your friend”.
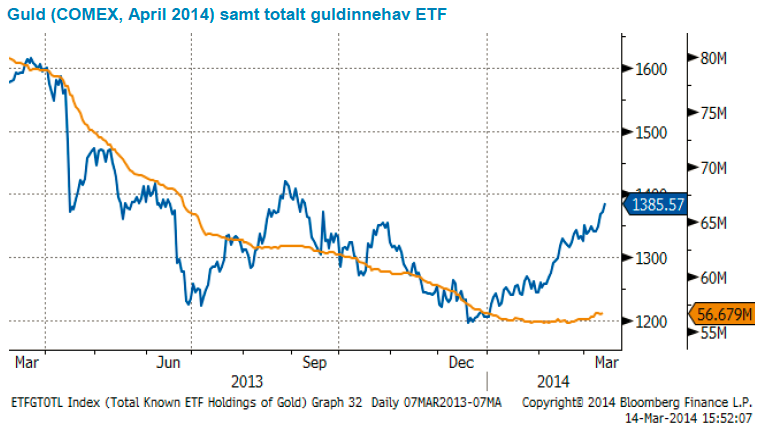
Efter en lång tid av negativ vy för guldet har vi bytt fot och tror på stigande pris. Vi tror på: LONG GULD H
Energi: Elpriset tyngs av det milda vädret
Oljan faller tillbaka till den lägsta nivån på över en månad efter att marknaden lyft blicken från Ukraina och fokuserar på Kina istället. Utöver de usla siffrorna på industriproduktion och export har kinesiska raffinaderier kört mycket mindre råolja den senaste tiden i takt med att efterfrågan varit lägre än väntat. IEA har reviderat upp sin förbrukningsprognos för 2014 till 92.7 miljoner fat per dag (+1.5%) med stöd från den kalla vintern i Nordöstra USA samt en mer robust tillväx även om de också flaggar en säsongsmässigt svagare efterfrågan under våren. Det innebär att OPEC över året måste producera ca 30 miljoner fat per dag, något som de faktiskt gjorde under februari då man nådde högsta nivån på över 5-månader efter att framför allt Irak överraskat (+530kb till 3.62 mb och där exporten förväntas nå högsta nivån på två år) och där även Saudi ökade sin produktion ytterligare till 9.85 mb. Vi förväntar oss fortsatt att oljan handlas i en range med potential uppemot 112 om man ser till den geopolitiska oron och där tidigare stöd om 105-106 flyttas ned något om man ser till säsongsmönstret och god fundamental balans där såväl Irak som Libyen kan komma att överraska något ytterligare.
Elmarknaden fortsätter ned på det våta och riktigt milda vädret. Det är med en relativt oförändrad situation på spot, utsläppsrätter, gas och energikol, även om den senare stärks något men mest som ett resultat av EURUSD rörelsen, som vädret fortsatt är i fokus. Vi får nog ta de mest nederbördsrika prognoserna mot slutet av veckan med en nypa salt då de är extrema, men vi kommer med största sannolikhet att se ett växande överskott i den nordiska energibalansen uppemot +2TWh mot normalt och håller därför kvar vår tro på kort position med ytterligare potential på nedsidan för sommarkvartalen.
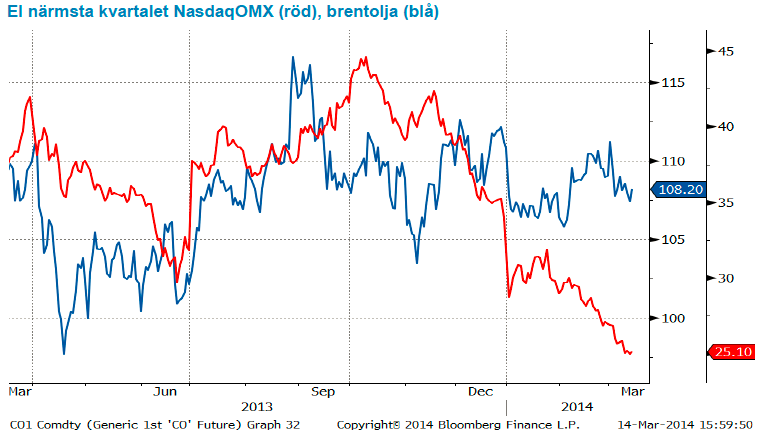
Vi tror att det kommer ges möjligheter till god avkastning i denna range-baserade handel där oljan är köpvärd var gång den kommer ned på lägre nivåer. Vi tror på: SHRT OLJA H
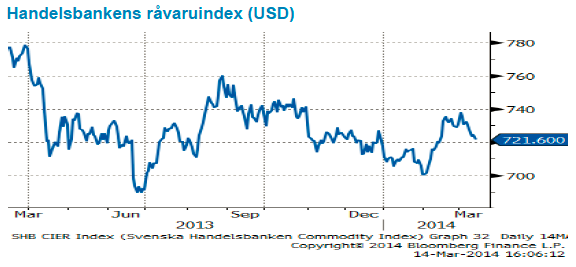
Handelsbankens råvaruindex
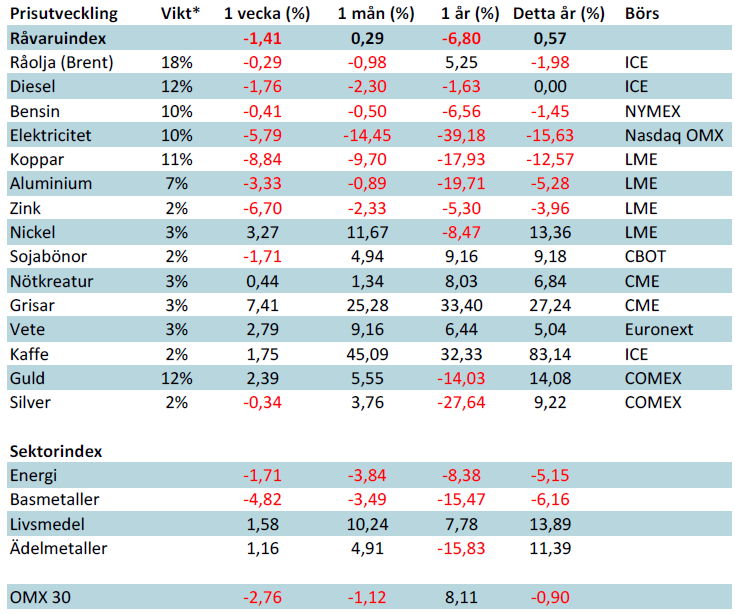
*Uppdaterade vikter från 29 november 2013
Handelsbankens råvaruindex består av de underliggande indexen för respektive råvara. Vikterna är bestämda till hälften från värdet av nordisk produktion (globala produktionen för sektorindex) och till hälften från likviditeten i terminskontrakten.
[box]SHB Råvarubrevet är producerat av Handelsbanken och publiceras i samarbete och med tillstånd på Råvarumarknaden.se[/box]
Ansvarsbegränsning
Detta material är producerat av Svenska Handelsbanken AB (publ) i fortsättningen kallad Handelsbanken. De som arbetar med innehållet är inte analytiker och materialet är inte oberoende investeringsanalys. Innehållet är uteslutande avsett för kunder i Sverige. Syftet är att ge en allmän information till Handelsbankens kunder och utgör inte ett personligt investeringsråd eller en personlig rekommendation. Informationen ska inte ensamt utgöra underlag för investeringsbeslut. Kunder bör inhämta råd från sina rådgivare och basera sina investeringsbeslut utifrån egen erfarenhet.
Informationen i materialet kan ändras och också avvika från de åsikter som uttrycks i oberoende investeringsanalyser från Handelsbanken. Informationen grundar sig på allmänt tillgänglig information och är hämtad från källor som bedöms som tillförlitliga, men riktigheten kan inte garanteras och informationen kan vara ofullständig eller nedkortad. Ingen del av förslaget får reproduceras eller distribueras till någon annan person utan att Handelsbanken dessförinnan lämnat sitt skriftliga medgivande. Handelsbanken ansvarar inte för att materialet används på ett sätt som strider mot förbudet mot vidarebefordran eller offentliggörs i strid med bankens regler.


Some rebound but not much. Brent crude rebounded 1.5% yesterday to $65.47/b. This morning it is inching 0.2% up to $65.6/b. The lowest close last week was on Thursday at $64.11/b.

The curve structure is almost as week as it was before the weekend. The rebound we now have gotten post the message from OPEC+ over the weekend is to a large degree a rebound along the curve rather than much strengthening at the front-end of the curve. That part of the curve structure is almost as weak as it was last Thursday.
We are still on a weakening path. The message from OPEC+ over the weekend was we are still on a weakening path with rising supply from the group. It is just not as rapidly weakening as was feared ahead of the weekend when a quota hike of 500 kb/d/mth for November was discussed.
The Brent curve is on its way to full contango with Brent dipping into the $50ies/b. Thus the ongoing weakening we have had in the crude curve since the start of the year, and especially since early June, will continue until the Brent crude oil forward curve is in full contango along with visibly rising US and OECD oil inventories. The front-month Brent contract will then flip down towards the $60/b-line and below into the $50ies/b.
At what point will OPEC+ turn to cuts? The big question then becomes: When will OPEC+ turn around to make some cuts? At what (price) point will they choose to stabilize the market? Because for sure they will. Higher oil inventories, some more shedding of drilling rigs in US shale and Brent into the 50ies somewhere is probably where the group will step in.
There is nothing we have seen from the group so far which indicates that they will close their eyes, let the world drown in oil and the oil price crash to $40/b or below.
The message from OPEC+ is also about balance and stability. The world won’t drown in oil in 2026. The message from the group as far as we manage to interpret it is twofold: 1) Taking back market share which requires a lower price for non-OPEC+ to back off a bit, and 2) Oil market stability and balance. It is not just about 1. Thus fretting about how we are all going to drown in oil in 2026 is totally off the mark by just focusing on point 1.
When to buy cal 2026? Before Christmas when Brent hits $55/b and before OPEC+ holds its last meeting of the year which is likely to be in early December.
Brent crude oil prices have rebounded a bit along the forward curve. Not much strengthening in the structure of the curve. The front-end backwardation is not much stronger today than on its weakest level so far this year which was on Thursday last week.

The front-end backwardation fell to its weakest level so far this year on Thursday last week. A slight pickup yesterday and today, but still very close to the weakest year to date. More oil from OPEC+ in the coming months and softer demand and rising inventories. We are heading for yet softer levels.

Down to the lowest since early May. Brent crude has fallen sharply the latest four days. It closed at USD 64.11/b yesterday which is the lowest since early May. It is staging a 1.3% rebound this morning along with gains in both equities and industrial metals with an added touch of support from a softer USD on top.
What stands out the most to us this week is the collapse in the Dubai one to three months time-spread.
Dubai is medium sour crude. OPEC+ is in general medium sour crude production. Asian refineries are predominantly designed to process medium sour crude. So Dubai is the real measure of the balance between OPEC+ holding back or not versus Asian oil demand for consumption and stock building.
A sharp weakening of the front-end of the Dubai curve. The front-end of the Dubai crude curve has been holding out very solidly throughout this summer while the front-end of the Brent and WTI curves have been steadily softening. But the strength in the Dubai curve in our view was carrying the crude oil market in general. A source of strength in the crude oil market. The core of the strength.
The now finally sharp decline of the front-end of the Dubai crude curve is thus a strong shift. Weakness in the Dubai crude marker is weakness in the core of the oil market. The core which has helped to hold the oil market elevated.
Facts supports the weakening. Add in facts of Iraq lifting production from Kurdistan through Turkey. Saudi Arabia lifting production to 10 mb/d in September (normal production level) and lifting exports as well as domestic demand for oil for power for air con is fading along with summer heat. Add also in counter seasonal rise in US crude and product stocks last week. US oil stocks usually decline by 1.3 mb/week this time of year. Last week they instead rose 6.4 mb/week (+7.2 mb if including SPR). Total US commercial oil stocks are now only 2.1 mb below the 2015-19 seasonal average. US oil stocks normally decline from now to Christmas. If they instead continue to rise, then it will be strongly counter seasonal rise and will create a very strong bearish pressure on oil prices.
Will OPEC+ lift its voluntary quotas by zero, 137 kb/d, 500 kb/d or 1.5 mb/d? On Sunday of course OPEC+ will decide on how much to unwind of the remaining 1.5 mb/d of voluntary quotas for November. Will it be 137 kb/d yet again as for October? Will it be 500 kb/d as was talked about earlier this week? Or will it be a full unwind in one go of 1.5 mb/d? We think most likely now it will be at least 500 kb/d and possibly a full unwind. We discussed this in a not earlier this week: ”500 kb/d of voluntary quotas in October. But a full unwind of 1.5 mb/d”
The strength in the front-end of the Dubai curve held out through summer while Brent and WTI curve structures weakened steadily. That core strength helped to keep flat crude oil prices elevated close to the 70-line. Now also the Dubai curve has given in.

Brent crude oil forward curves

Total US commercial stocks now close to normal. Counter seasonal rise last week. Rest of year?

Total US crude and product stocks on a steady trend higher.

Analys
OPEC+ will likely unwind 500 kb/d of voluntary quotas in October. But a full unwind of 1.5 mb/d in one go could be in the cards
Down to mid-60ies as Iraq lifts production while Saudi may be tired of voluntary cut frugality. The Brent December contract dropped 1.6% yesterday to USD 66.03/b. This morning it is down another 0.3% to USD 65.8/b. The drop in the price came on the back of the combined news that Iraq has resumed 190 kb/d of production in Kurdistan with exports through Turkey while OPEC+ delegates send signals that the group will unwind the remaining 1.65 mb/d (less the 137 kb/d in October) of voluntary cuts at a pace of 500 kb/d per month pace.
Signals of accelerated unwind and Iraqi increase may be connected. Russia, Kazakhstan and Iraq were main offenders versus the voluntary quotas they had agreed to follow. Russia had a production ’debt’ (cumulative overproduction versus quota) of close to 90 mb in March this year while Kazakhstan had a ’debt’ of about 60 mb and the same for Iraq. This apparently made Saudi Arabia angry this spring. Why should Saudi Arabia hold back if the other voluntary cutters were just freeriding? Thus the sudden rapid unwinding of voluntary cuts. That is at least one angle of explanations for the accelerated unwinding.
If the offenders with production debts then refrained from lifting production as the voluntary cuts were rapidly unwinded, then they could ’pay back’ their ’debts’ as they would under-produce versus the new and steadily higher quotas.
Forget about Kazakhstan. Its production was just too far above the quotas with no hope that the country would hold back production due to cross-ownership of oil assets by international oil companies. But Russia and Iraq should be able to do it.
Iraqi cumulative overproduction versus quotas could reach 85-90 mb in October. Iraq has however steadily continued to overproduce by 3-5 mb per month. In July its new and gradually higher quota came close to equal with a cumulative overproduction of only 0.6 mb that month. In August again however its production had an overshoot of 100 kb/d or 3.1 mb for the month. Its cumulative production debt had then risen to close to 80 mb. We don’t know for September yet. But looking at October we now know that its production will likely average close to 4.5 mb/d due to the revival of 190 kb/d of production in Kurdistan. Its quota however will only be 4.24 mb/d. Its overproduction in October will thus likely be around 250 kb/d above its quota with its production debt rising another 7-8 mb to a total of close to 90 mb.
Again, why should Saudi Arabia be frugal while Iraq is freeriding. Better to get rid of the voluntary quotas as quickly as possible and then start all over with clean sheets.
Unwinding the remaining 1.513 mb/d in one go in October? If OPEC+ unwinds the remaining 1.513 mb/d of voluntary cuts in one big go in October, then Iraq’s quota will be around 4.4 mb/d for October versus its likely production of close to 4.5 mb/d for the coming month..
OPEC+ should thus unwind the remaining 1.513 mb/d (1.65 – 0.137 mb/d) in one go for October in order for the quota of Iraq to be able to keep track with Iraq’s actual production increase.
October 5 will show how it plays out. But a quota unwind of at least 500 kb/d for Oct seems likely. An overall increase of at least 500 kb/d in the voluntary quota for October looks likely. But it could be the whole 1.513 mb/d in one go. If the increase in the quota is ’only’ 500 kb/d then Iraqi cumulative production will still rise by 5.7 mb to a total of 85 mb in October.
Iraqi production debt versus quotas will likely rise by 5.7 mb in October if OPEC+ only lifts the overall quota by 500 kb/d in October. Here assuming historical production debt did not rise in September. That Iraq lifts its production by 190 kb/d in October to 4.47 mb/d (August level + 190 kb/d) and that OPEC+ unwinds 500 kb/d of the remining quotas in October when they decide on this on 5 October.


Samtal om sällsynta jordartsmetaller, guld och silver

Brookfield köper bränsleceller för 5 miljarder USD av Bloom Energy för att driva AI-datacenter

Teck Resources kan förse Nordamerika och kanske hela G7 med all germanium som behövs

Leading Edge Materials är på rätt plats i rätt tid

Oljepriset faller efter ny handelskonflikt mellan USA och Kina

Kinas elproduktion slog nytt rekord i augusti, vilket även kolkraft gjorde

Tyskland har så höga elpriser att företag inte har råd att använda elektricitet

OPEC+ missar produktionsmål, stöder oljepriserna

Ett samtal om guld, olja, fjärrvärme och förnybar energi
Brent crude ticks higher on tension, but market structure stays soft
-
 Nyheter4 veckor sedan
Kinas elproduktion slog nytt rekord i augusti, vilket även kolkraft gjorde
-
Nyheter4 veckor sedan
Tyskland har så höga elpriser att företag inte har råd att använda elektricitet
-
 Nyheter3 veckor sedan
OPEC+ missar produktionsmål, stöder oljepriserna
-
 Nyheter3 veckor sedan
Ett samtal om guld, olja, fjärrvärme och förnybar energi
-
Analys4 veckor sedan
Brent crude ticks higher on tension, but market structure stays soft
-
Analys3 veckor sedan
Are Ukraine’s attacks on Russian energy infrastructure working?
-

 Nyheter2 veckor sedan
Guld nära 4000 USD och silver 50 USD, därför kan de fortsätta stiga
-

 Nyheter3 veckor sedan
Guldpriset uppe på nya höjder, nu 3750 USD