

Analys
SHB Råvarubrevet 10 januari 2014

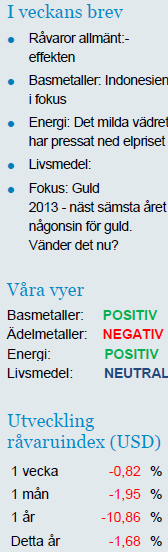
Råvaror allmänt: Starkt avslut – stark början
 Fjolåret slutade med buller och bång. Stigande priser på de flesta risktillgångar trots att Feds trollspö skulle sluta vina över marknaden. Feds protokoll kom under veckan och visade att QE3 taktfast kommer dras tillbaka. Marknaden tog dock det hela med ro.
Detta är i mångt och mycket ”old news” nu. Mer fokus har istället hamnat på den dollarrörelse som minskad stimulans kommer orsaka. En starkare USD betyder ju fallande priser för de flesta råvaror som är noterade i dollar. Även om mycket talar för en starkare dollar just nu så vill vi understryka att det brukar se ut så i början av varje år.
Globalt fortsätter uppgången i början av det nya året. En stark impuls kommer nu till realekonomin från den positiva avslutningen på finansmarknaden under slutet av 2013. De flesta centralbanker är fokuserade på att undanröja riskerna på nedsidan och framförallt deflationsrisker vilket också är positivt för risktillgångar som råvaror.
Vårt tema med starkare basmetaller efter en lagerrörelse i Kina håller på att spela ut. Ett basmetallrally i december tror vi kan gå lite längre före nedsidan öppnar sig igen. Lagernivåerna för koppar har fallit ordentligt nu.
Amerikanska sysselsättningssiffror i form av non-farm payrolls (antal nya jobb utanför jordbrukssektorn) överraskade under fredagseftermiddag på nedsidan och kom in på 74 000 mot förväntade 197 000 nya jobb. Detta fick visserligen oljan att falla initialt men återhämtade sig strax därefter. Även metallerna höll sig i princip oförändrade efter beskedet.
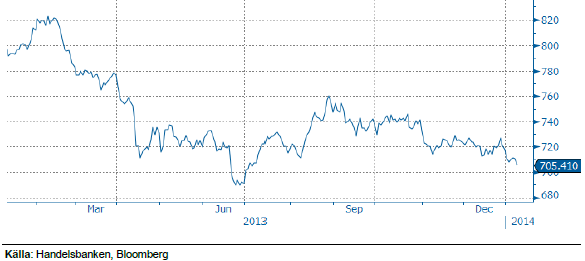
Handelsbankens råvaruindex (USD)
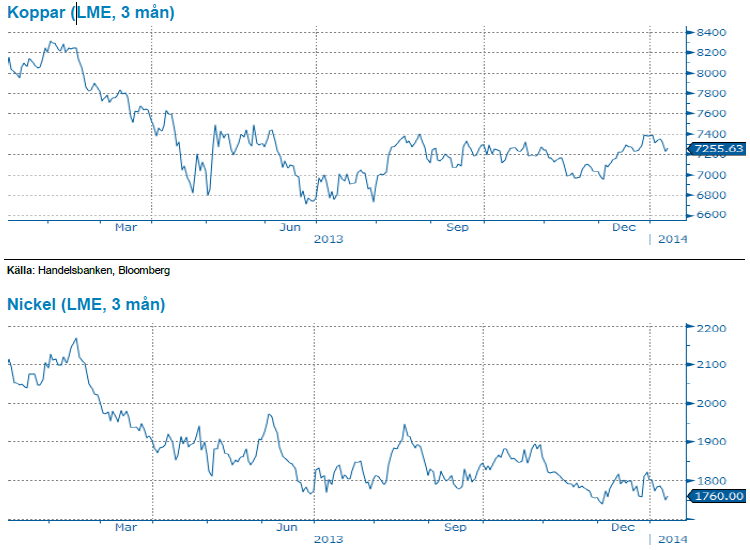
Basmetaller: Indonesien i fokus
Basmetallerna inledde veckan ned på kinesisk statistik som skapade en förnyad oro kring tillväxten, såväl CCP som exportsiffror (USD 25.64 miljarder handelsöverskott mot förväntat 32.15) kom in under förväntan. Mot helgen är det mest fokus på nickel som stiger och där Indonesiens exportförbud av malm nu träder i kraft på måndag, detta för att stötta den inhemska industrin och lokal anrikning av metall snarare än export av låghaltig malm.
Kinas kopparimport steg 29 procent under december jämfört med förra året vilket också drar med sig övriga metaller men i övrigt får dagens uppgång kanske snarare betecknas som short-covering inför amerikanska sysselsättningssiffror. Koppar är väl annars den metall som har den svagare balansen, framför allt raffinerad koppar som kan bli riktigt tight under året, och kanske till viss del även zink. Annars är det svårt att motivera någon kraftig uppgång på metaller om man ser till det överskott vi har och kommer får leva med under året och en bit in på 2015, framför allt för aluminium och nickel. Den som går i tankar att köpa basmetaller på dessa nivåer, som ändå får betecknas som låga, bör därför ha en något längre vy. Vi noterar även att kinesisk bilförsäljning steg med 14 procent under 2014 då hela 21.98 miljoner bilar såldes i landet!
Vi ser basmetallerna som köpvärda på dessa nivåer, trots att uppsidan ser begränsad ut i dagsläget tror vi på stigande priser på längre sikt. Vi tror på: LONG BASMETALLER H
Energi: Det milda vädret har pressat ned elpriset
Elpriset befinner sig i en fallande trend sedan oktober och det milda och blöta vädret torde väl inte passerat någon obemärkt. Även på kontinenten har priserna fallit samtidigt som utsläppsrätter och kol handlas oförändrat under perioden. Den nordiska energibalansen har förbättrats rejält och spotpriset för ”vintermånaden” december blev 5.4 öre lägre än årssnittet om 38.10 öre/kWh.
På dessa låga elprisnivåer får vi räkna med kraftiga prisrörelser så fort vädret slår om vilket också visat sig under årets inledande handel där närmsta kvartalet steg med över 7 procent på prognoser som visade temperaturomslag från 5 grader över normalt till 5 grader under normalt för de kommande 10 dagarna. Senaste prognoserna visar dock att vi efter denna köldknäpp går tillbaka mot ett mer normalbetonat väder så vi håller nu en neutral vy tills sannolikheten för en högtrycksblockering ökar.
Oljan tappar 3.5 procent under årets inledande handel efter att Libyen nu återupptagit verksamheten vid ett flertal pumpar och ser ut att öka produktionen för första gången på tio månader (nu ca 500,00 fat per dag). Samtidigt har den fundamentala balansen förbättrats ytterligare efter att USA nått sin högsta produktion på över 20 år, 8.5 miljoner fat per dag, samtidigt som den inhemska efterfrågan vikit något. Det återspeglas även i veckans lagersiffror från EIA som visar att råoljeproduktionen ökar och raffinaderierna processar denna till bränslen som nu lagras. Även om detta är negativt för prisbilden påverkar det WTI-Brent spreaden ännu mer, 15.38 dollar var den som mest under veckan när rebeller sprängde en oljeledning i norra Irak. Vi tror fortsatt att det kommer ges möjligheter till god avkastning i denna range-baserade handel där oljan är köpvärd var gång den kommer ned på dessa lite lägre nivåer, lägg därtill den positiva effekten genom terminsavdraget på olja (rabatt på termin i förhållande till spot vilken ger en positiv rullningsavkastning) som ser ut att bestå.
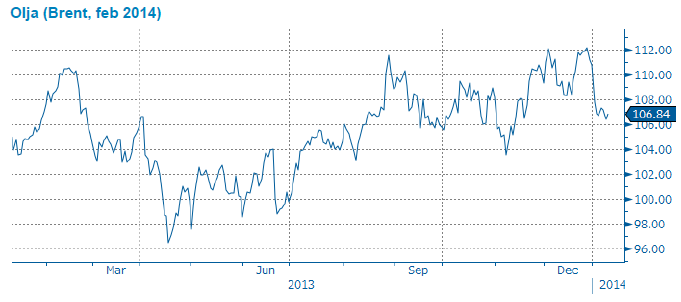 Vi tror att det kommer ges möjligheter till god avkastning i denna range-baserade handel där oljan är köpvärd var gång den kommer ned på dessa lite lägre nivåer Vi tror på: LONG OLJA H
Livsmedel: Vetet faller och bör fortsätta nedåt
Terminspriserna på vete har under veckan backat. Den kyla som skapat viss oro i delar av USA tycks nu vara över och snart väntas återigen temperaturer över det normala. I EU är det varmt och regnigt och grödorna är fina. För tillfället ingen oro men detta kan snabbt ändras om temperaturen faller då det skyddande snötäcke är begränsat. Även i Ukraina och Ryssland finns det lite snö, även där är dock vädret väldigt milt. Det finns gott om vete att tillgå i världen och för tillfället inga större problem att tala om. Utan att temperaturen i viktiga regioner snabbt vänder nedåt med ökad risk för utvintring är det svårt att se varför trenden med fallande priser inte fortsätter.
Terminspriserna på samtliga mjuka råvaror steg under årets sista månader med undantag för socker, där vi för tillfället har ett överskott på marknaden. Kakao tillhör årets vinnare kaffe årets förlorare. Terminspriserna på kaffe har haft en fantastisk utveckling sedan i mitten av december. Vändningen kom efter flera år av fallande priser där produktionen överstigit konsumtionen. Trots ett off-år förra året har kaffeåret 2012/2013 bjudit på goda skördar. Många kaffeodlare går idag med förlust och oron kring utbudsstörningar på sikt ökar. Kommer kaffeproducenterna att bli tvungna att överge sin råvara? Andra faktorer som gett stöd till den senaste tidens terminspriser är de ökade produktionskostnaderna samt sämre kvalité på förra årets skörd som följd av sämre väderförhållanden.
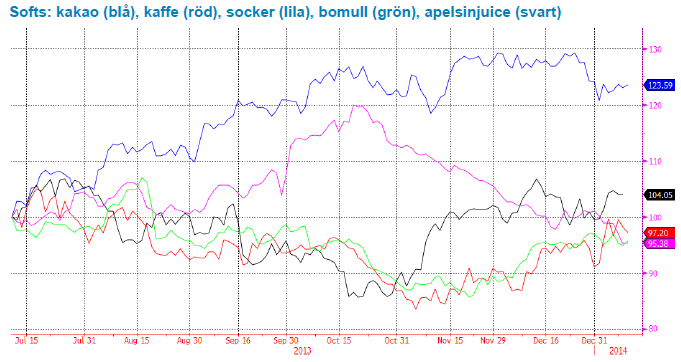
Stor skörd på ingång i Brasilien för sojabönor. Vi tror på: BEAR SOJA H
Fokus: Guld
2013 – näst sämsta året någonsin för guld. Vänder det nu?
Som våra läsare vet har vi varit negativa på guld en längre tid – något som visat sig bli väldigt korrekt. Guldpriset föll under 2013 med hela 28 %, och utflödet ur börshandlade guldfonder (ETF) har varit obönhörligt, investeringar i guld-ETF:er har minskat med 33 %. Vår egen valutareserv i Riksbanken har tappat nästan 14 miljarder kronor i värde under året, och en lång rad guldgruvor och prospekteringsprojekt har fått stängas ner. Endast 1981 har varit ett sämre år i guldets historia, då med ett fall på nästan 33 %. Frågan vi alla ställer nu är naturligtvis ”kan det bli värre – eller vänder det nu?”
Vårt resonemang bakom guldet är som bekant att priset på guld bestäms av marknadsaktörernas vilja att tjäna (eller rädsla att förlora) pengar. Övriga råvaror förbrukas, och prissätts därför av efterfrågan och utbud, och därtill kopplade förväntningar och betalningsvilja. Guldet köper man helt enkelt för att någon gång i framtiden sälja dyrare till någon annan, som i sin tur vill göra om samma trick. En väldigt liten del av jordens guldreserver ”förbrukas” i form av industriell användning, och denna del återvinns.
Just dynamiken i att köpa för att sälja dyrare fungerar utmärkt så länge tillflödet av nya vinsthungriga aktörer hela tiden växer, något som eldas på av rubriker om nya prisrekord och resonemang om att ”det är annorlunda denna gången”. När trenden vänder blir man sittande, och man får hoppas att priset kommer tillbaks så man kan sälja utan att förlora pengar.
Förra gången det begav sig – 1981 – hade prisutvecklingen fram till dess att det ”toppade” påmint om den vi såg fram till slutet av 2011, dvs en väldigt kraftig uppgång, nästan utan rekyler, och orsaken var också jämförbar (allmänheten fick börja placera i guld ett par år tidigare – nu har vi kunnat placera i ETF i snart tio år). Detta gör att det känns nära till hands att jämföra nu och då, det skadar aldrig med lite historiskt perspektiv, och historien tenderar ju att upprepa sig, även om det mycket väl kan var ”annorlunda denna gång”. Då vi såg ganska många som köpte guld nära topparna under 2011 så utgår vi därifrån och jämför med de som köpte nära topparna 1980, och gör ett antal observationer.
De som köpte 1980 såg sin placering tappa med 57 % innan det vände, vilket idag skulle motsvara ett fortsatt fall ner till drygt 800 dollar per uns. De kom dock tillbaks till samma nivåer och kunde sälja av sina innehav runt 2006, drygt 25 år senare, vilket idag skulle ta oss fram till år 2036. Och detta är i absoluta tal, tar vi hänsyn till inflationen så räckte inte ens topparna 2011 till, trist nog. Vill man göra en positiv jämförelse så är det värt att nämna att året efter det värsta, dvs 1982, så steg priset med ca 15 %, innan fallet fortsatte. Så för den som inte blivit bränd redan så kan historien ge stöd för ett opportunistiskt köp.
Vi tror dock att det är att leka med elden att köpa nu, långa positioner i guld ska vara korta i tid, snabbt in och snabbt ut, inget annat. För, som Rogoff och Reinhart konstaterat i ”This time is different”, det är ju sällan ”annorlunda denna gång”.
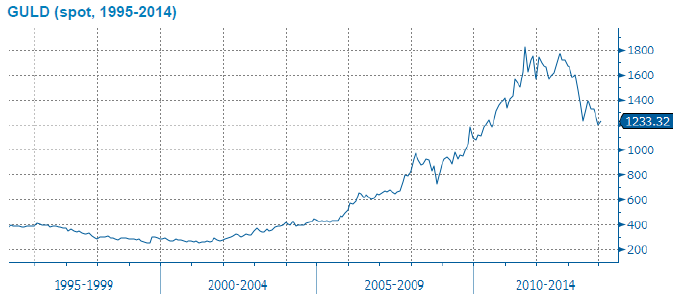
Handelsbankens råvaruindex
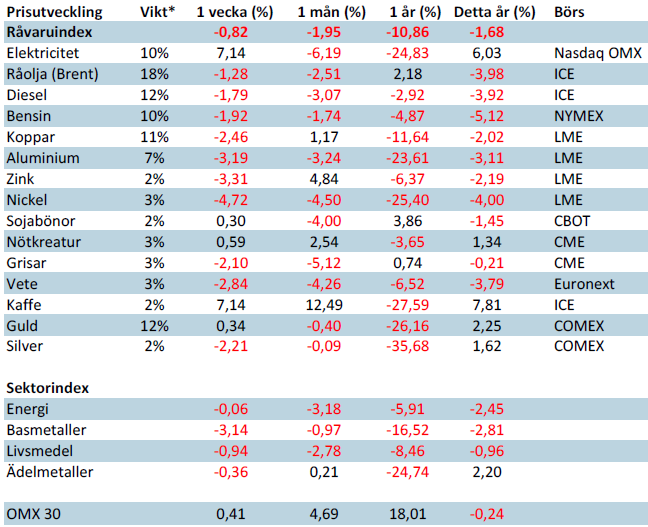
*Uppdaterade vikter från 29 november 2013. Handelsbankens råvaruindex består av de underliggande indexen för respektive råvara. Vikterna är bestämda till hälften från värdet av nordisk produktion (globala produktionen för sektorindex) och till hälften från likviditeten i terminskontrakten.
[box]SHB Råvarubrevet är producerat av Handelsbanken och publiceras i samarbete och med tillstånd på Råvarumarknaden.se[/box]
Ansvarsbegränsning
Detta material är producerat av Svenska Handelsbanken AB (publ) i fortsättningen kallad Handelsbanken. De som arbetar med innehållet är inte analytiker och materialet är inte oberoende investeringsanalys. Innehållet är uteslutande avsett för kunder i Sverige. Syftet är att ge en allmän information till Handelsbankens kunder och utgör inte ett personligt investeringsråd eller en personlig rekommendation. Informationen ska inte ensamt utgöra underlag för investeringsbeslut. Kunder bör inhämta råd från sina rådgivare och basera sina investeringsbeslut utifrån egen erfarenhet.
Informationen i materialet kan ändras och också avvika från de åsikter som uttrycks i oberoende investeringsanalyser från Handelsbanken. Informationen grundar sig på allmänt tillgänglig information och är hämtad från källor som bedöms som tillförlitliga, men riktigheten kan inte garanteras och informationen kan vara ofullständig eller nedkortad. Ingen del av förslaget får reproduceras eller distribueras till någon annan person utan att Handelsbanken dessförinnan lämnat sitt skriftliga medgivande. Handelsbanken ansvarar inte för att materialet används på ett sätt som strider mot förbudet mot vidarebefordran eller offentliggörs i strid med bankens regler.

Market is starting to take US/Iran headlines with a pinch of salt. Brent crude rose $2.8/b yesterday to an official close of $112.1/b. But after that it traded as low as $108.05/b before ending late night at around $109.7/b. Through the day it traded in a range of $106.87 – 112.72/b amid a flurry of news or rumors from Iran and the US. ”US temporary sanctions during negotiations” (falls alarm). ”We will bomb Iran” (not anyhow),… etc. While the market is still fluctuating to this kind of news flow, it is starting to take such headlines with a pinch of salt.

We’ll see. Maybe, maybe not. The Brent M1 contract is trading at $110.2/b this morning which very close to the average ticks through yesterday of $110.4/b.
Trump with bearish, verbal intervention whenever Brent trades above $110/b it seems. What seems to be a pattern is that Trump states something like ”very good negotiations going on with Iran”, ”New leaders in Iran are great,..”, ”Great progress in negotiations,…”, ”Deal in sight,..” etc whenever the Brent M1 contract trades above $110/b. An effort to cool the market. These hot air verbal interventions from Trump used to have a heavy bearish impact on prices, but they now seems to have less and less effect unless they are backed by reality.
As far as we can see there has been no real progress in the negotiations between the US and Iran with both sides still standing by their previous demands.
Iran is getting stronger while the cease fire lasts making a return to war for Trump yet harder. Iran is naturally in constant preparation for a return to war given Trump’s steady threats of bombing Iran again. Iran is naturally doing what ever is possible to prepare for a return to war. And every day the cease fire lasts it is better prepared. This naturally makes it more and more difficult and dangerous for the US to return to warring activity versus Iran as the consequences for energy infrastructure in the Persian Gulf will be more and more severe the longer the cease fire lasts. Israel seems to see it this way as well. That the war is not won and that current frozen state of a cease fire gives Iran opportunity to rebuild military and politically.
Global inventories are drawing down day by day. How much? In the meantime the Strait of Hormuz stays closed. There is varying measures and estimates of how much global inventories are drawing down. Our rough estimate, back of the envelope, is that global inventories are drawing down by at least some 10 mb/d or about 300 mb/d in a balance between loss of supply versus demand destruction. Other estimates we see are a monthly draw of 250-270 mb/d. The IEA only ’measured’ a draw in global observable stocks of 117 mb in April with oil on water rising 53 mb while on shore stocks fell 170 mb. But global stocks are hard to measure with large invisible, unmeasured stocks. As such a back of the envelope approach may be better.
Oil products is what the world is consuming. Oil product prices likely to rise while product stocks fall. Strategic Petroleum Reserves (SPR) are predominantly crude oil. Discharging oil from OECD SPR stocks, a sharp reduction in Chinese crude imports and a reduction in global refinery throughput of 6-7 mb/d has helped to keep crude oil markets satisfactorily supplied. But global inventories are drawing down none the less. And oil products is really what the world is consuming. So if global refinery throughput stays subdued, then demand will eventually have to match the supply of oil products. The likely path forward this summer is a steady draw down in jet fuel, diesel and gasoline. Higher prices for these. Then, if possible, higher refinery throughput and higher usage of crude in response to very profitable refinery margins. And lastly sharper draw in crude stocks and higher prices for these. But some 6 mb/d of oil products used to be exported through the Strait of Hormuz. And it may not be so easy to ramp up refinery activity across the world to compensate. Especially as Ukraine continues to damage Russian refineries as well as Russian crude production and export facilities.
Watch oil product stocks and prices as well as Brent calendar 2027. What to watch for this summer is thus oil product inventories falling and oil product premiums to crude rising. Another measure to watch is the Brent crude 2027 contract as it rises steadily day by day as the Strait of Hormuz stays closed and global oil inventories decline. The latter is close to the highest level since the start of the war and keeps rising.
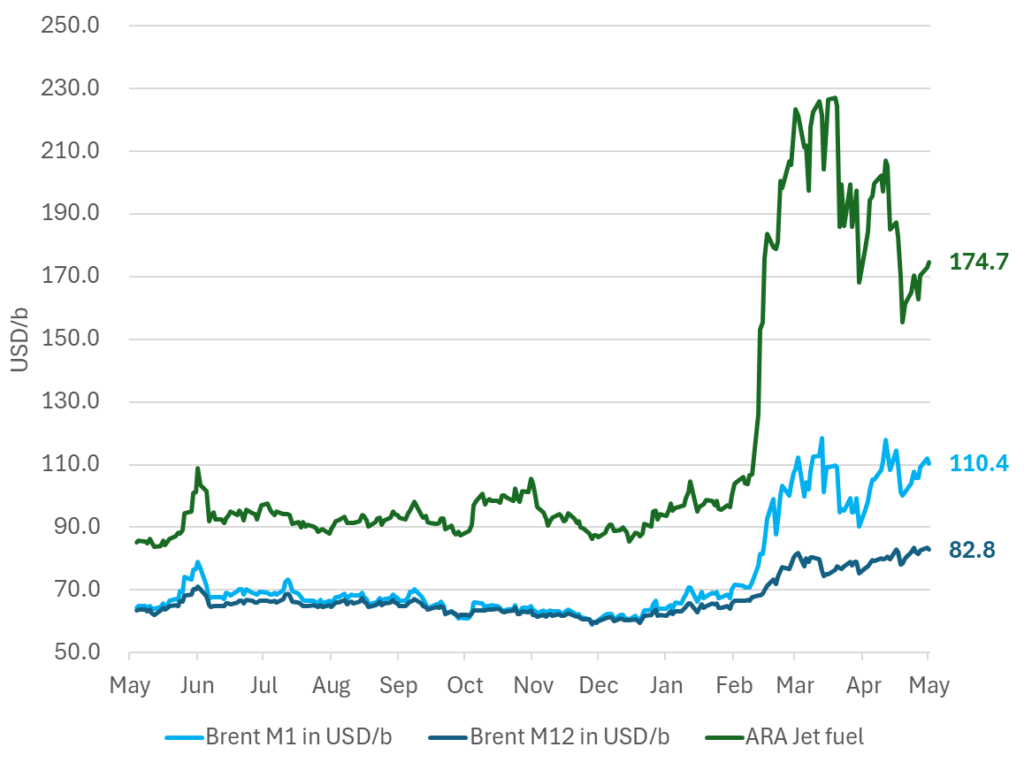
The Brent M1 contract and the Brent 2027 prices and current price of jet fuel in Europe (ARA). All in USD/b
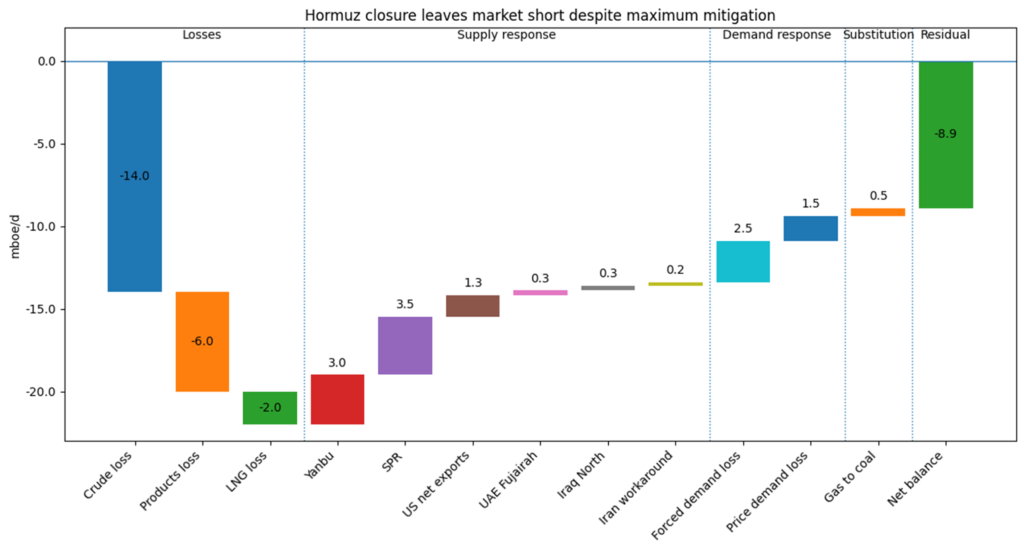
Our back of the envelope calculation of the global shortage created by the closure of the Strait of Hormuz. Note that 3.5 mb/d of discharge from SPR is also a draw. Note also that ’Forced demand loss’ of 2.5 mb/d is probably temporary and will fall back towards zero as logistics are sorted out leaving ’Price demand loss’ to do the job of balancing the market. Thus a shortfall of at least 9 mb/d created by the closure. More if SPR discharge is included and more if Forced demand loss recedes.
Brent is climbing higher. Front-month is at USD 106.3/bl this morning, close to a weekly high and a USD 9/bl jump from Mondays open. This is the move we flagged as a risk earlier in the week: the market shifting from ”a deal is around the corner” to ”this is going to take longer than we thought”.

Analyst Commodities, SEB
During April, rest-of-year Brent remained remarkably stable around USD 90/bl. A stability which rested on one single assumption: the SoH reopens around 1 May. That assumption is now slowly falling apart.
As we highlighted yesterday: every week of delay beyond 1 May adds (theoretically) ish USD 5/bl to the rest-of-year average, as global inventories draw 100 million barrels per week. i.e., a mid-May reopening implies rest-of-year Brent closer to USD 100/bl, and anything pushing into June or July takes us meaningfully higher.
What’s changed in the last 48 hours:
#1: The US military has formally warned that clearing suspected sea mines from SoH could take up to six months. That is a completely different timescale from what the financial market is pricing. Even a political deal tomorrow does not immediately reopen the strait.
#2: Trump has shifted his tone from urgency to ”strategic patience”. In yesterday’s press conference: ”Don’t rush me… I want a great deal.” The market is reading this as a president no longer feeling pressured by timelines, with the naval blockade running in the background.
#3: So far, the military activity is escalating, not de-escalating. Axios reports Iran is laying more mines in SoH. The US 3rd carrier strike group (USS George H.W. Bush) is arriving with two countermine vessels. Trump yesterday ordered the US Navy to destroy any Iranian boats caught laying mines. While CNN reports that the Pentagon is actively drawing up plans to strike Iranian SoH capabilities and individual Iranian military leaders if the ceasefire collapses. i.e., NOT a attitude consistent with an imminent deal!
Spot crude and product prices eased off the early-April highs on a combination of system rerouting and deal optimism. Both now weakening. Goldman estimates April Gulf output is reduced by 14.5 mbl/d, or 57% of pre-war supply, a number that keeps getting worse the longer this drags on.
Demand-side adaptation is ongoing: S. Korea has cut its Middle East crude dependence from 69% to 56% by pulling more from the Americas and Africa, and Japan is kicking off a second round of SPR releases from 1 May. But SPRs are finite.
Ref. to the negotiations, we should not bet on speed. The current Iranian leadership is dominated by genuine hardliners willing to absorb economic pain and run the clock to extract concessions. That is not a setup for a rapid resolution. US/Israeli media briefings keep framing the delay as ”internal Iranian divisions”, the reality is more complicated and points toward weeks and months, not days.
Our point is that the complexity is large, and higher prices have only just started (given a scenario where the negotiations drag out in time). The market spent April leaning on the USD 90/bl rest-of-year assumption; that case is diminishing by the hour. If ”early May reopening” is replaced by ”June, July or later” over the next week or two, both crude and products have meaningful room to reprice higher from here. There is a high risk being short energy and betting on any immediate political resolution(!).
Down on Friday. Up on Monday. The Brent June crude oil contract traded down 5.1% last week to a close of $90.38/b. It reached a high of $103.87/b last Monday and a low of $86.09/b on Friday as Iran announced that the Strait of Hormuz was fully open for transit. That quickly changed over the weekend as the US upheld its blockade of Iranian oil exports while Iran naturally responded by closing the SoH again. The US blew a hole in the engine room of the Iranian ship TOUSKA and took custody of the ship on Sunday. Brent crude is up 5.6% this morning to $95.4/b.
The cease-fire is expiring tomorrow. The US has said it will send a delegation for a second round of negotiations in Islamabad in Pakistan. But Iran has for now rejected a second round of talks as it views US demands as unrealistic and excessive while the US is also blocking the Strait of Hormuz.
While Brent is up 5% this morning, the financial market is still very optimistic that progress will be made. That talks will continue and that the SoH will fully open by the start of May which is consistent with a rest-of-year average Brent crude oil price of around $90/b with the market now trading that balance at around $88/b.
Financial optimism vs. physical deterioration. We have a divergence where the financial market is trading negotiations, improvements and resolution while at the same time the physical market is deteriorating day by day. Physical oil flows remain constrained by disrupted flows, longer voyage times and elevated freight and insurance costs.
Financial markets are betting that a US/Iranian resolution will save us in time from violent shortages down the road. But every day that the SoH remains closed is bringing us closer to a potentially very painful point of shortages and much higher prices.
The US blockade is also a weapon of leverage against its European and Asian allies. When Iran closed the SoH it held the world economy as a hostage against the US. The US blockade of the SoH is of course blocking Iranian oil exports. But it is also an action of disruption directed towards Europe and Asia. The US has called for the rest of the world to engaged in the war with Iran: ”If you want oil from the Persian Gulf, then go and get it”. A risk is that the US plays brinkmanship with the global oil market directed towards its European and Asian allies and maybe even towards China to force them to engage and take part. Maybe unthinkable. But unthinkable has become the norm with Trump in the White House.




Sommarväder skapar prisrally på elbörsen
Oil product price pain is set to rise as the Strait of Hormuz stays closed into summer

Solkraften pressar elpriserna dagtid

Michel Gubel ger sin syn på oljemarknaden