

Analys
SHB Råvarubrevet 1 mars 2013

 Råvaror allmänt
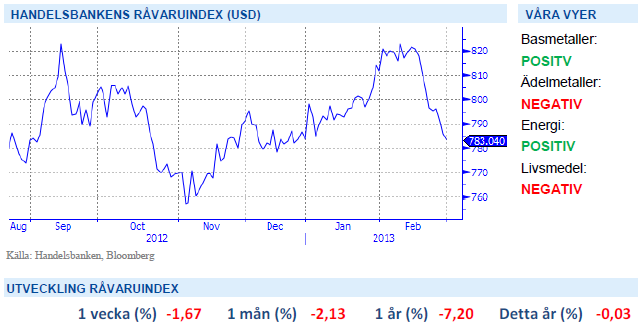
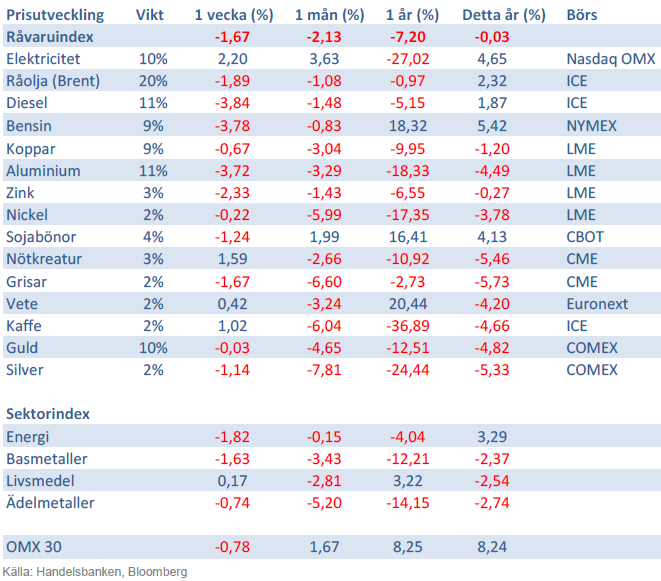
Ytterligare svag vecka för råvarorna
Dödläget efter italienska valet tillsammans oron över kommande finanspolitiska åtstramningar i USA utöver en svagare aktiemarknad har lett råvarorna nedåt under ytterligare en svag vecka. Värst drabbad var åter nickel som nu tappat 11 % från sin högsta notering under februari. Även om vissa datautfall som inköpschefsindex för EMU-området och Kina varit något sämre än väntat har dataskörden överlag varit fortsatt god. För Kina sjönk PMI för februari till 50,1 från januari 50,4 (väntat var 50,5).
Som vanligt är data från Kina svårtolkad under första kvartalet då effekterna av ledigheten efter det kinesiska nyåret ibland infaller i januari och ibland i februari. Årets börsrally har fortsatt att sätta positivt avtryck i företagens och hushållens stämningsläge, skattehöjningar och nedskärningar till trots. Den bild vi har av makroutvecklingen ger stöd för uppgång för konjunkturhandlade råvaror. I USA handlar det om att hushållen svarar mot den förbättring som äger rum på bostadsmarknaden. Skattehöjningar, nedskärningar och kanske även en minskning av federala utgifter i slutet av april utgör motvindar. Detta har dock hittills motverkats av positiva förmögenhets- och sentimentseffekter.
Vi återgår även till negativ vy för livsmedel, trots risk för fortsatt torka i USA tror vi att dagens nivåer på spannmål är alltjämnt för höga.
Basmetaller
Metallernas fall fortsätter
Basmetallerna lägger ytterligare en vecka bakom sig med fallande priser. Ett sämre PMI än väntat från Kina ger metallerna fortsatt skjuts nedåt under fredagen. Nickel föll under veckan med 3 % och koppar med 2,2 %. Stigande lager på både koppar (+7 % under veckan) och nickel (+2,8 % under veckan) ger också stöd åt bilden.
Basmetallerna har svajat omkring bland sina tekniska handelsintervall styrda av de olika glidande medelvärdena. Vi tycker att nedgången i basmetaller är driven av kortsiktig besvikelse och har väldigt lite med realekonomin att göra. Därför ser vi de svaga basmetallerna som köpvärda. Vi fortsätter hålla nickel och koppar som de bästa alternativen för att kapitalisera på ett starkare Kina.
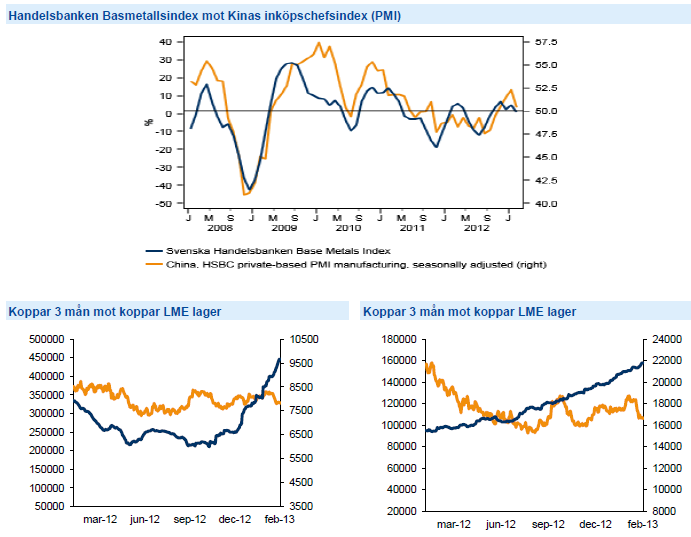
Trots nedgången senaste veckorna tror vi på högre priser på basmetaller och ser istället möjlighet till ”buy on dip”. Vi tror på: BASMET H
Ädelmetaller
Dödskors för guld
Under förra veckan inträffade vad som bland tekniska analytiker brukar kallas ett dödskors. Det korta glidande medelvärdet på 50 dagar skär då ner igenom det långa glidande medelvärdet på 200 dagar. Det brukar ofta signalera ett trendskifte nedåt för en marknad. Det omvända kallas guldkors och signalerar ett köpläge för en marknad som bryter uppåt. För guld var detta dödskors det fjärde på sex år och nu väntar investerare med andan i halsen på utvecklingen denna gång. Även om guldraset summerar till över 5 % i februari tror vi att resan nedåt bara har börjat.
Guldet handlas svagt ned under veckan trots en stark början med en uppgång på 2,3 % som en respons på oron efter italienska valet och Bernankes tal i tisdags kväll som minskade oron för att QE3 kommer tas bort tidigare än väntat. Starkare dollar och högre räntor blir utmanande för guldet samtidigt som inflationen väntas vara låg under året. Vi behåller vår negativa vy för ädelmetallerna.
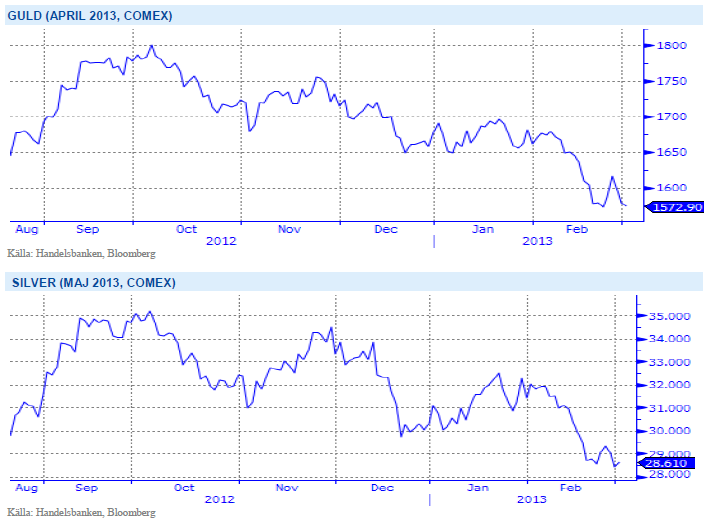
Starkare dollar och högre räntor blir utmanande för guldet samtidigt som inflationen väntas vara låg under året. Vi tror på: GULD S H
Energi
Iran i samtal om atomprogram
Oljan har också haft en tuff vecka där vi har fått se brent-oljan tillbaka på 110- nivån efter att legat om-kring 118 dollar under de två tidigare veckorna. Vi tycker att det är köpläge i råolja men såklart finns en hög risk på grund av senaste tidens oro på marknaderna. P5+1 (USA, U.K., Frankrike, Tyskland, Kina och Ryssland) träffade under veckan Iran i Almaty, Kazakhstan för att diskutera Irans atomprogram. Inga detaljer har släppts efter mötet där maktnationerna vill begränsa Irans atomprogram i utbyte mot att ta bort sanktionerna mot Irans oljeexport. Israel har hotat att bomba Irans atomenheter ifall samtalen inte leder till resultat. Nya möten ska upptas i mars.
En stilla elmarknad där kvartalskontraktet handlas upp någon procent till månadshögsta 37 euro som ett resultat av en något torrare väderutveckling. Energi-balansen oförändrad på ca -10 TWh och brytpriset på kol kvar strax under 36 euro för Q2 2013 efter att både kol och CO2 återhämtat sig något. Utsläppsrätterna föll 17 procent efter nytt besked om att flytta fram beslutet kring en förskjuten tilldelning. Samtidigt signalerar Tyskland att man står bakom en reform av EU ETS och eventuell backloading vilket bidrog till en återhämtning eftersom Tyskland med sin tyngd sannolikt kan komma att påverka att förslagen går igenom. Vi förväntar oss att rätterna handlas kvar på nuvarande nivå kring 5 euro.
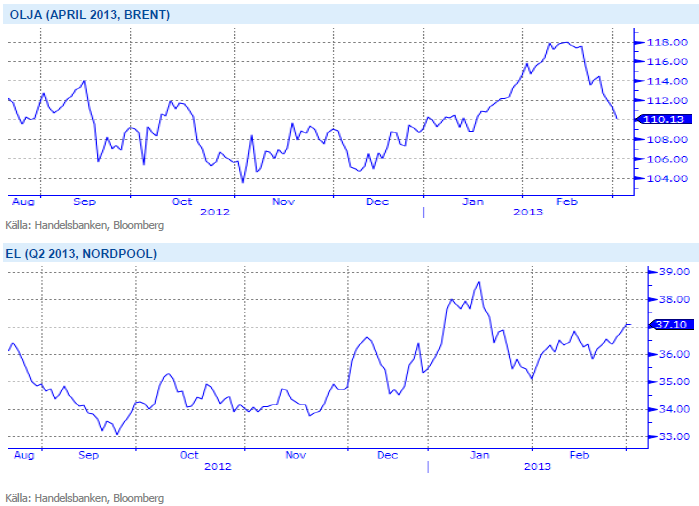
Den råvarugrupp som är mest beroende av den globala konjunkturen är Energi och med en starkare konjunktur ser vi positivt på utvecklingen för denna sektor. Vi tror på: ENERGI H
Livsmedel
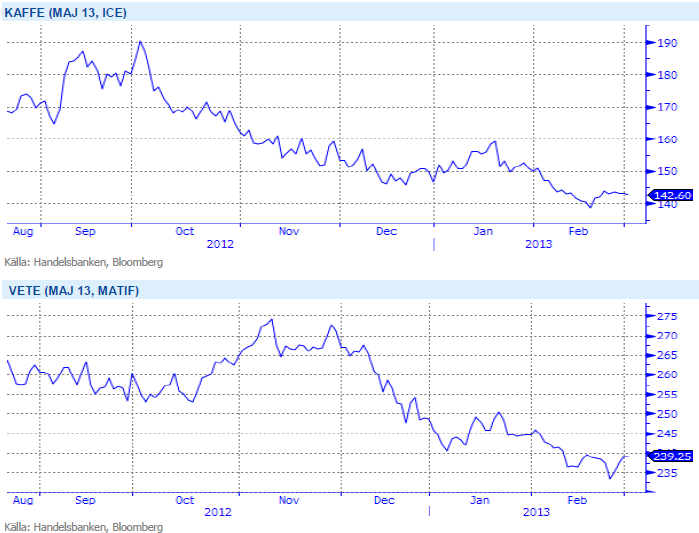
Kaffepriset får stöd
Under senare delen av februari har vi sett starka kaffepriser. De colombianska kaffeodlarna har pressat upp priserna efter ovilja att sälja på den senaste tidens låga nivåer. Även uteblivet regn i centrala Vietnam har gett stöd i veckan. De låga vattennivåerna ökar risken för minskad skörd nästa säsong. Skörden i Centralamerika är så gott som färdig med 20 procent av årets skörd beräknas vara skadat. Export från Indonesien, som världens tredje största Robusta producent, beräknas minska i takt med ökad inhemsk konsumtion, trots rekordskördar i området. Vi tror att marknaden prisat in dessa nyheter redan och anser att fortsatt uppsida är begränsad.
Under senaste veckan har vi kunnat notera stigande vetepriser som en följd av fortsatt torka i de amerikanska vetefälten men även i EU-området väntas regnet utebli. Med förväntat höga amerikanska majs-skördar, dagens historiskt höga vetepriser och än så länge inga dramatiska väderförändringar så ändrar vi vår vy från neutral till negativ på livsmedel och tror på fallande vetepriser.
Vi återgår till negative syn för soja, majs och vete, trots riskerna för torrt väder i USA. Normal väderlek bör ge press på spannmålspriserna. Vi tror på: LIVSMEDEL S H
Handelsbankens Råvaruindex
Handelsbankens råvaruindex består av de underliggande indexen för respektive råvara. Vikterna är bestämda till hälften från värdet av nordisk produktion (globala produktionen för sektorindex) och till hälften från likviditeten i terminskontrakten.
[box]SHB Råvarubrevet är producerat av Handelsbanken och publiceras i samarbete och med tillstånd på Råvarumarknaden.se[/box]
Ansvarsbegränsning
Detta material är producerat av Svenska Handelsbanken AB (publ) i fortsättningen kallad Handelsbanken. De som arbetar med innehållet är inte analytiker och materialet är inte oberoende investeringsanalys. Innehållet är uteslutande avsett för kunder i Sverige. Syftet är att ge en allmän information till Handelsbankens kunder och utgör inte ett personligt investeringsråd eller en personlig rekommendation. Informationen ska inte ensamt utgöra underlag för investeringsbeslut. Kunder bör inhämta råd från sina rådgivare och basera sina investeringsbeslut utifrån egen erfarenhet.
Informationen i materialet kan ändras och också avvika från de åsikter som uttrycks i oberoende investeringsanalyser från Handelsbanken. Informationen grundar sig på allmänt tillgänglig information och är hämtad från källor som bedöms som tillförlitliga, men riktigheten kan inte garanteras och informationen kan vara ofullständig eller nedkortad. Ingen del av förslaget får reproduceras eller distribueras till någon annan person utan att Handelsbanken dessförinnan lämnat sitt skriftliga medgivande. Handelsbanken ansvarar inte för att materialet används på ett sätt som strider mot förbudet mot vidarebefordran eller offentliggörs i strid med bankens regler.


Market is starting to take US/Iran headlines with a pinch of salt. Brent crude rose $2.8/b yesterday to an official close of $112.1/b. But after that it traded as low as $108.05/b before ending late night at around $109.7/b. Through the day it traded in a range of $106.87 – 112.72/b amid a flurry of news or rumors from Iran and the US. ”US temporary sanctions during negotiations” (falls alarm). ”We will bomb Iran” (not anyhow),… etc. While the market is still fluctuating to this kind of news flow, it is starting to take such headlines with a pinch of salt.

We’ll see. Maybe, maybe not. The Brent M1 contract is trading at $110.2/b this morning which very close to the average ticks through yesterday of $110.4/b.
Trump with bearish, verbal intervention whenever Brent trades above $110/b it seems. What seems to be a pattern is that Trump states something like ”very good negotiations going on with Iran”, ”New leaders in Iran are great,..”, ”Great progress in negotiations,…”, ”Deal in sight,..” etc whenever the Brent M1 contract trades above $110/b. An effort to cool the market. These hot air verbal interventions from Trump used to have a heavy bearish impact on prices, but they now seems to have less and less effect unless they are backed by reality.
As far as we can see there has been no real progress in the negotiations between the US and Iran with both sides still standing by their previous demands.
Iran is getting stronger while the cease fire lasts making a return to war for Trump yet harder. Iran is naturally in constant preparation for a return to war given Trump’s steady threats of bombing Iran again. Iran is naturally doing what ever is possible to prepare for a return to war. And every day the cease fire lasts it is better prepared. This naturally makes it more and more difficult and dangerous for the US to return to warring activity versus Iran as the consequences for energy infrastructure in the Persian Gulf will be more and more severe the longer the cease fire lasts. Israel seems to see it this way as well. That the war is not won and that current frozen state of a cease fire gives Iran opportunity to rebuild military and politically.
Global inventories are drawing down day by day. How much? In the meantime the Strait of Hormuz stays closed. There is varying measures and estimates of how much global inventories are drawing down. Our rough estimate, back of the envelope, is that global inventories are drawing down by at least some 10 mb/d or about 300 mb/d in a balance between loss of supply versus demand destruction. Other estimates we see are a monthly draw of 250-270 mb/d. The IEA only ’measured’ a draw in global observable stocks of 117 mb in April with oil on water rising 53 mb while on shore stocks fell 170 mb. But global stocks are hard to measure with large invisible, unmeasured stocks. As such a back of the envelope approach may be better.
Oil products is what the world is consuming. Oil product prices likely to rise while product stocks fall. Strategic Petroleum Reserves (SPR) are predominantly crude oil. Discharging oil from OECD SPR stocks, a sharp reduction in Chinese crude imports and a reduction in global refinery throughput of 6-7 mb/d has helped to keep crude oil markets satisfactorily supplied. But global inventories are drawing down none the less. And oil products is really what the world is consuming. So if global refinery throughput stays subdued, then demand will eventually have to match the supply of oil products. The likely path forward this summer is a steady draw down in jet fuel, diesel and gasoline. Higher prices for these. Then, if possible, higher refinery throughput and higher usage of crude in response to very profitable refinery margins. And lastly sharper draw in crude stocks and higher prices for these. But some 6 mb/d of oil products used to be exported through the Strait of Hormuz. And it may not be so easy to ramp up refinery activity across the world to compensate. Especially as Ukraine continues to damage Russian refineries as well as Russian crude production and export facilities.
Watch oil product stocks and prices as well as Brent calendar 2027. What to watch for this summer is thus oil product inventories falling and oil product premiums to crude rising. Another measure to watch is the Brent crude 2027 contract as it rises steadily day by day as the Strait of Hormuz stays closed and global oil inventories decline. The latter is close to the highest level since the start of the war and keeps rising.
The Brent M1 contract and the Brent 2027 prices and current price of jet fuel in Europe (ARA). All in USD/b

Our back of the envelope calculation of the global shortage created by the closure of the Strait of Hormuz. Note that 3.5 mb/d of discharge from SPR is also a draw. Note also that ’Forced demand loss’ of 2.5 mb/d is probably temporary and will fall back towards zero as logistics are sorted out leaving ’Price demand loss’ to do the job of balancing the market. Thus a shortfall of at least 9 mb/d created by the closure. More if SPR discharge is included and more if Forced demand loss recedes.

Brent is climbing higher. Front-month is at USD 106.3/bl this morning, close to a weekly high and a USD 9/bl jump from Mondays open. This is the move we flagged as a risk earlier in the week: the market shifting from ”a deal is around the corner” to ”this is going to take longer than we thought”.

Analyst Commodities, SEB
During April, rest-of-year Brent remained remarkably stable around USD 90/bl. A stability which rested on one single assumption: the SoH reopens around 1 May. That assumption is now slowly falling apart.
As we highlighted yesterday: every week of delay beyond 1 May adds (theoretically) ish USD 5/bl to the rest-of-year average, as global inventories draw 100 million barrels per week. i.e., a mid-May reopening implies rest-of-year Brent closer to USD 100/bl, and anything pushing into June or July takes us meaningfully higher.
What’s changed in the last 48 hours:
#1: The US military has formally warned that clearing suspected sea mines from SoH could take up to six months. That is a completely different timescale from what the financial market is pricing. Even a political deal tomorrow does not immediately reopen the strait.
#2: Trump has shifted his tone from urgency to ”strategic patience”. In yesterday’s press conference: ”Don’t rush me… I want a great deal.” The market is reading this as a president no longer feeling pressured by timelines, with the naval blockade running in the background.
#3: So far, the military activity is escalating, not de-escalating. Axios reports Iran is laying more mines in SoH. The US 3rd carrier strike group (USS George H.W. Bush) is arriving with two countermine vessels. Trump yesterday ordered the US Navy to destroy any Iranian boats caught laying mines. While CNN reports that the Pentagon is actively drawing up plans to strike Iranian SoH capabilities and individual Iranian military leaders if the ceasefire collapses. i.e., NOT a attitude consistent with an imminent deal!
Spot crude and product prices eased off the early-April highs on a combination of system rerouting and deal optimism. Both now weakening. Goldman estimates April Gulf output is reduced by 14.5 mbl/d, or 57% of pre-war supply, a number that keeps getting worse the longer this drags on.
Demand-side adaptation is ongoing: S. Korea has cut its Middle East crude dependence from 69% to 56% by pulling more from the Americas and Africa, and Japan is kicking off a second round of SPR releases from 1 May. But SPRs are finite.
Ref. to the negotiations, we should not bet on speed. The current Iranian leadership is dominated by genuine hardliners willing to absorb economic pain and run the clock to extract concessions. That is not a setup for a rapid resolution. US/Israeli media briefings keep framing the delay as ”internal Iranian divisions”, the reality is more complicated and points toward weeks and months, not days.
Our point is that the complexity is large, and higher prices have only just started (given a scenario where the negotiations drag out in time). The market spent April leaning on the USD 90/bl rest-of-year assumption; that case is diminishing by the hour. If ”early May reopening” is replaced by ”June, July or later” over the next week or two, both crude and products have meaningful room to reprice higher from here. There is a high risk being short energy and betting on any immediate political resolution(!).
Down on Friday. Up on Monday. The Brent June crude oil contract traded down 5.1% last week to a close of $90.38/b. It reached a high of $103.87/b last Monday and a low of $86.09/b on Friday as Iran announced that the Strait of Hormuz was fully open for transit. That quickly changed over the weekend as the US upheld its blockade of Iranian oil exports while Iran naturally responded by closing the SoH again. The US blew a hole in the engine room of the Iranian ship TOUSKA and took custody of the ship on Sunday. Brent crude is up 5.6% this morning to $95.4/b.
The cease-fire is expiring tomorrow. The US has said it will send a delegation for a second round of negotiations in Islamabad in Pakistan. But Iran has for now rejected a second round of talks as it views US demands as unrealistic and excessive while the US is also blocking the Strait of Hormuz.
While Brent is up 5% this morning, the financial market is still very optimistic that progress will be made. That talks will continue and that the SoH will fully open by the start of May which is consistent with a rest-of-year average Brent crude oil price of around $90/b with the market now trading that balance at around $88/b.
Financial optimism vs. physical deterioration. We have a divergence where the financial market is trading negotiations, improvements and resolution while at the same time the physical market is deteriorating day by day. Physical oil flows remain constrained by disrupted flows, longer voyage times and elevated freight and insurance costs.
Financial markets are betting that a US/Iranian resolution will save us in time from violent shortages down the road. But every day that the SoH remains closed is bringing us closer to a potentially very painful point of shortages and much higher prices.
The US blockade is also a weapon of leverage against its European and Asian allies. When Iran closed the SoH it held the world economy as a hostage against the US. The US blockade of the SoH is of course blocking Iranian oil exports. But it is also an action of disruption directed towards Europe and Asia. The US has called for the rest of the world to engaged in the war with Iran: ”If you want oil from the Persian Gulf, then go and get it”. A risk is that the US plays brinkmanship with the global oil market directed towards its European and Asian allies and maybe even towards China to force them to engage and take part. Maybe unthinkable. But unthinkable has become the norm with Trump in the White House.


Sommarväder skapar prisrally på elbörsen
Oil product price pain is set to rise as the Strait of Hormuz stays closed into summer

Solkraften pressar elpriserna dagtid

Michel Gubel ger sin syn på oljemarknaden