

Analys
SEB Jordbruksprodukter, 14 april 2014


 Priserna på spannmål och oljeväxter har generellt sett utvecklats positivt, drivna av torka i USA för vete, lägre areal än förväntat i USA för majs, oron för lägre odlad areal och sämre avkastning i Ukraina och av torkan i januari/februari i Brasilien. Nu har crop ratings kommit för USA:s vete och det är dåligt, men bara 1% sämre än förra årets första estimat. Brasiliens CONAB justerar upp produktionen för flera torkdrabbade jordbruksprodukter och aktiemarknaden har varit väldigt svag de senaste dagarna. En fallande aktiemarknad kan få konsumenterna att hålla igen. Det ser alltså återigen lite svagare ut på marknaderna för jordbruksprodukter.
Odlingsväder
Indien har varit absolut torrt den senaste veckan, liksom i Kina söder om Peking. USA har fått regn, som dock missat de delstater som odlar vete, som vi ser på kartbilden nedan:
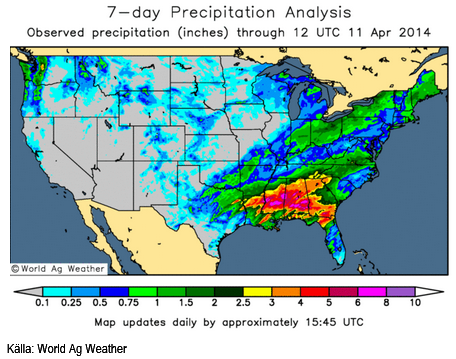
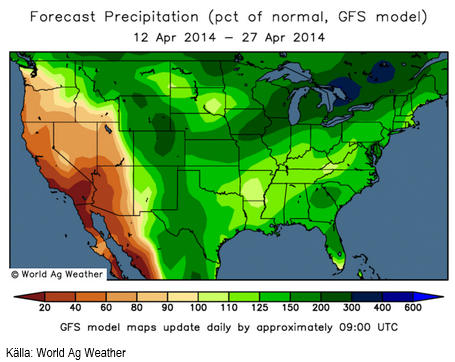
Nederbördsprognosen enligt GFS-modellen innehåller dock nederbörd över det normala även för Kansas, Oklahoma och Texas.
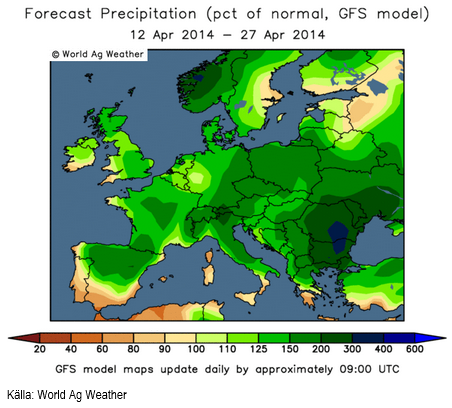
Europa har varit relativt torrt den senaste veckan, särskilt i sydvästra Tyskland och nordvästra Frankrike. Prognosen visar att Benelux-området fortsätter att få något mindre nederbörd än normalt.
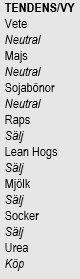
Vete
Den senaste veckan har terminerna i Chicago gått ner, medan de har gått upp i Paris.
Egypten köpte vete från Ukraina i den senaste tendern. Det var länge sedan sist och det tyder på att Egypten känner sig trygga med att ta den risken. Ryssland har fattat ett beslut om att betrakta Krim-halvön som en del av Ryssland. Ryssland fortsätter att mobilisera mot Ukraina på samma sätt som man gjorde när man ockuperade Krim.
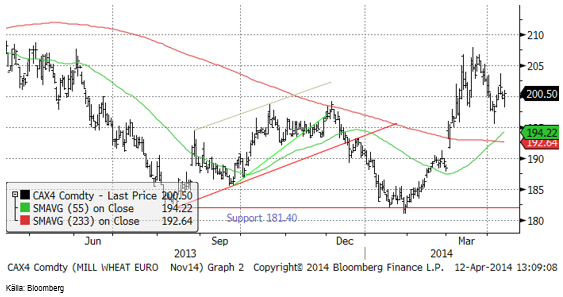
Tekniskt är novemberkontraktet på Matif i neutralt läge, varifrån priset lika gärna kan gå upp som ner.
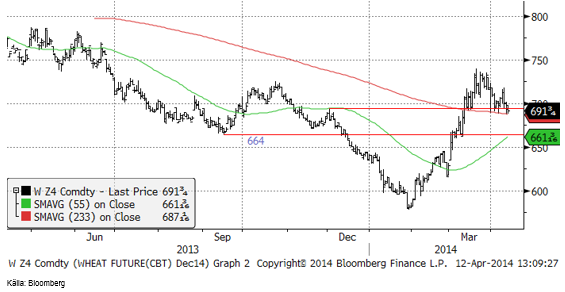
Chicagovetet (december) stängde ett par cent lägre än för en vecka sedan.
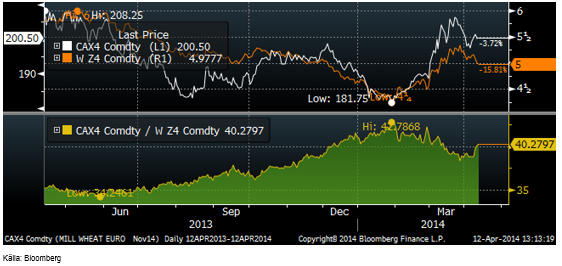
Som jag nämnde inledningsvis, har Matifs novemberkontrakt återhämtat sig i förhållande till Chicagovetet. Kvoten mellan priset på Matifs novemberkontrakt och Chicagos decemberkontrakt omräknat till euro per bushel steg under förra året från en kvot på 35 till 42.8 i januari i år. Sedan föll kvoten till 38 och de senaste dagarna har den alltså hämtat sig till 40.3. Ett ton Chicagovete med leverans i december kostar 183 euro medan det kostar 200 euro på Matif. Den senaste veckans uppgång gör det mer förmånligt att sälja Matifterminer, allt annat lika.
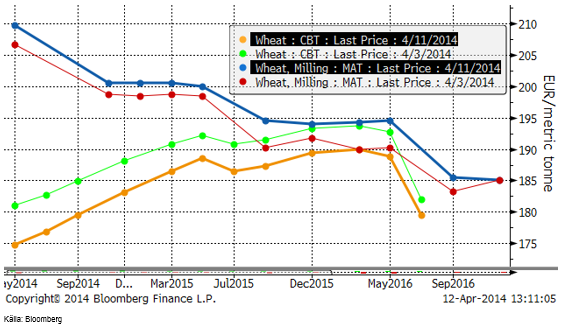
Nedan ser vi terminskurvorna för Chicagovete och Matif i fredags och veckan innan. Notera att jämfört med den 3 april, ligger Matif nu högre och Chicago lägre!
I tisdags kom årets första Crop Condition för vete och den visade, som väntat, att vetet är i dåligt skick i USA med endast 35 % i ”good” eller ”excellent” skick. I diagrammet nedan ser vi hur förra veckans siffra på 35% (märkt med en liten cirkel) förhåller sig till tidigare år. Om man vill vara optimistisk, kan man dock notera att årets första crop condition bara är lite lägre än var det började både förra året 2013 och år 2011. Förra året blev avkastningen rekordhög, så det kan faktiskt bli ett bra år än.
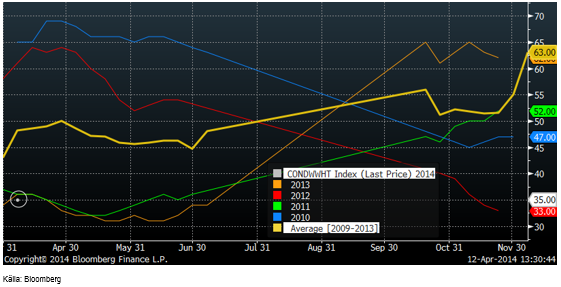
Nästa crop condition-rapport kommer på måndag kväll klockan 22:00 CET.
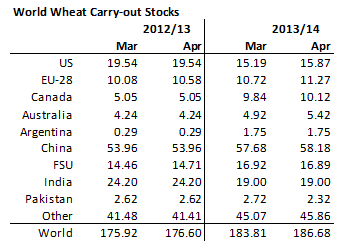
Det kom också en WASDE-rapport i veckan från det amerikanska jordbruksdepartementet. För vete gjordes inga betydande justeringar av produktionsestimaten för 2013/14.
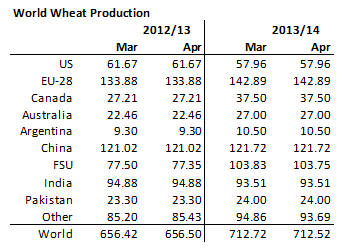
Konsumtionen justerades dock ner, vilket medrörde att utgående lager justerades upp med 3 mt på global basis.
Priset har backat den senaste veckan på regn i USA, så vi väljer att gå över till neutral vy, men fundamenta ser övervägande negativt ut och det skulle inte förvåna om priset på vete går ner lite till.
Maltkorn
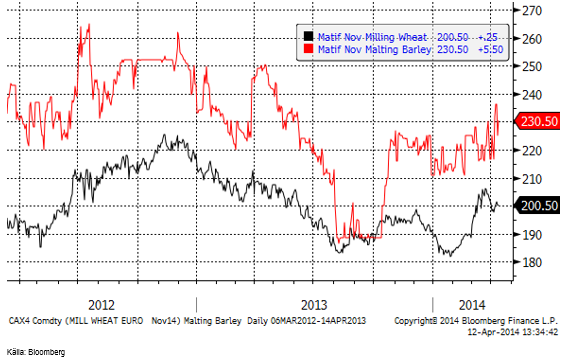
Maltkornsterminerna steg med 10 euro till 230.50 – och ligger nu alltså 30 euro över Matifs veteterminer.
Majs
Decemberkontraktet på majs steg i veckan till en ny årshögsta på 517 cent, men föll sedan tillbaka och stängde under 500, ungefär 2 cent lägre än förra veckan. Tekniskt stöd finns på 494 cent, som kan vara en bra nivå att köpa vid.
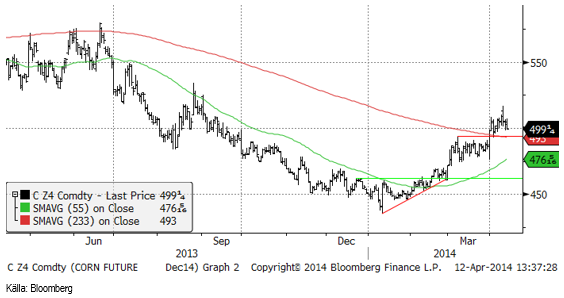
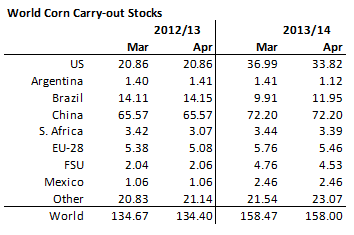
I WASDE-rapporten justerade USDA upp produktionen i Brasilien med 2 mt, och Sydafrika och FSU med vardera 1 mt. Produktionen i ”övriga länder” höjdes också med 2 mt. Totalt sett höjde USDA produktionen 2013/14 med nästan 6.5 mt.
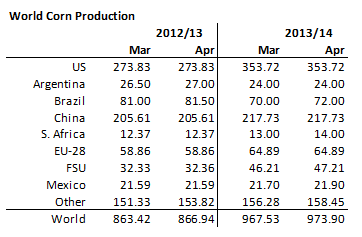
Dessa produktionsökningar slog dock nästan inte alls igenom i högre utgående lager. De är troligtvis ett sätt för USDA att få ihop den högre konsumtionen och exporten med vad som rapporteras finnas i lager. Som du kunde läsa förra veckan, är t ex USA:s export av majs redan uppe i 100% av vad den skulle vara för hela säsongen 2013/14. Givet de lager som finns, måste alltså produktionen ha varit högre i USA än vad USDA har räknat med tidigare. Det är en slags baklängeskalkyl. Det blev dock en höjning av utgående lager med 0.5 mt och det får väl tolkas som negativt för priset. Tillsammans med uppjusteringen av utgående lager för vete är detta alltså negativt för spannmål rent generellt.
På måndag klockan 22:00 CET publicerar USDA årets första planting progress-data.
Vi går över till neutral rekommendation för majs.
Sojabönor
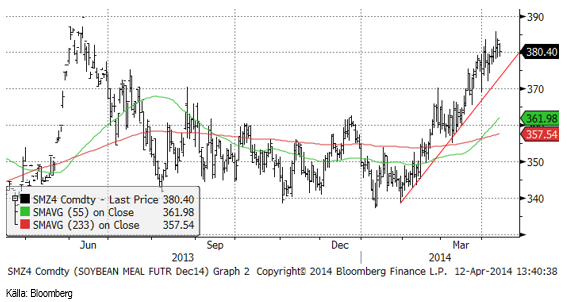
Novemberkontraktet på sojabönor i Chicago gick i veckan upp och nuddade vid motståndet på 1236 cent. Nu väntar sannolikt en rekyl nedåt. Tekniskt stöd finns vid 1200 cent.
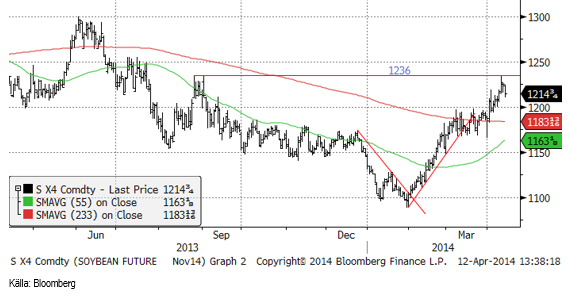
Sojamjölet fortsatte upp ett par dollar i veckan, men ”borde” ur ett tekniskt perspektiv ha stigit färdigt.
Sojaoljan steg initialt, men backade sedan tillbaka.
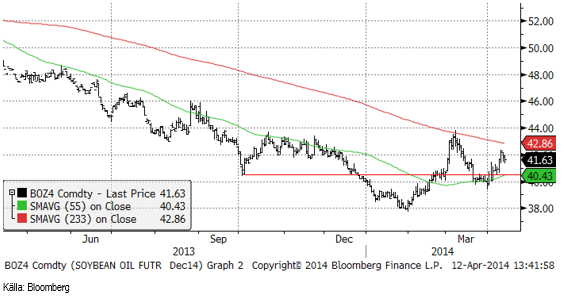
Palmoljeterminerna i Malaysia har fallit ner till ett område med tekniskt stöd. I veckan som gick sjönk priset från 2705 MYR / ton till 2660. De senaste dagarna har en liten rekyl uppåt noterats.
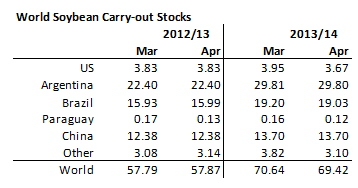
I WASDE-rapporten sänkte USDA global produktion med nästan 1.5 mt. Brasilien justerades ner med 1 mt. CONAB, som publicerade sin skörderapport i veckan, angav skörden till 86.1 mt. Det var faktiskt en höjning från 85.5 mt, som de varnat för tidigare. Skörden i Brasilien är klar till 85%.
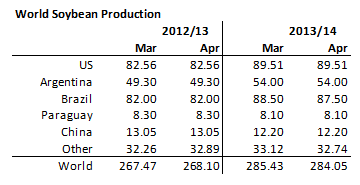
Sänkningen av global produktion slår i fallet med sojabönor direkt igenom till 1 mt lägre utgående lager.
Tekniskt ser det ut som om styrkan i sojamarknaden kommer att mattas men vi behåller neutral som rekommendation för soja.
Raps
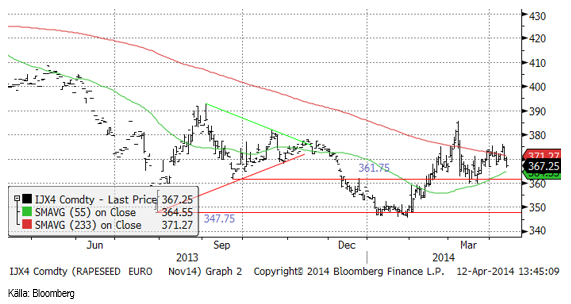
Rapspriset hämtade sig under veckan, men vände sedan tillbaka ner. Den huvudsakligan nedgången i veckan noterades i fredags. För veckan noterades en nedgång i priset med 50 eurocent till 367.25.
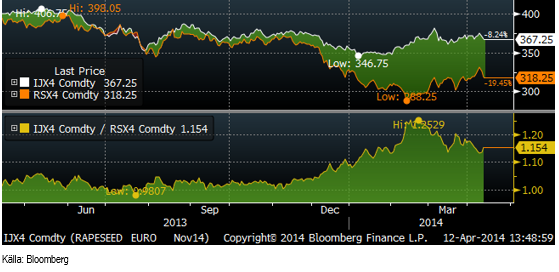
Skillnaden mellan kanadensisk canola i eurotermer och Matifs rapskontrakt (båda för novemberleverans) som i fredags för en vecka sedan var 14.9%, har nu ökat till 15.4%, främst pga att canolan i Winnipeg har fallit mer än Matifkontraktet. Matif är ca 12% för dyr i förhållande till ICE Canada.
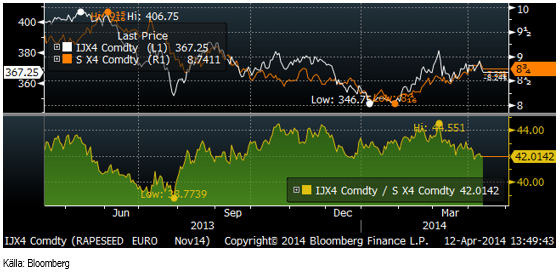
Nedanför ser vi kvoten mellan rapsfrö (november) och sojabönor (november, omräknat till euro). Enligt den jämförelsen är det sojabönorna som är dyra och rapsen som är billig.
Vi fortsätter med säljrekommendation på raps.
Potatis
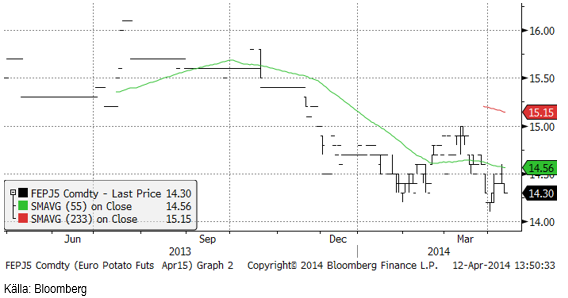
Potatis för leverans i april nästa år sjönk till 14.30 euro per 100 Kg från 14.50 förra veckan.
Gris
Det snabba prisfall jag förutspådde förra veckan i Lean Hogs, slog verkligen in. Priset föll i mitten av veckan till 115 cent, men där fanns uppenbarligen köpare som lyfte priset till 120 cent, där priset höll sig till slutet av veckan. Konsumenterna i USA är enligt fredagens ”consumer conficende” statistik oväntat positiva inför framtiden, vilket kan återspegla sig i konsumtionen av kött framöver. Fredagens Hog Slaughter-statistik kom in på 370,000. Förra veckan var det 407,000. Även detta är sådant som ger stöd för priset.
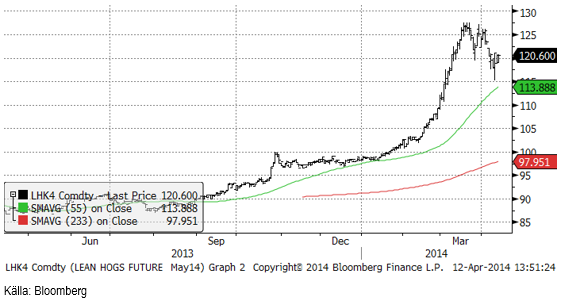
Spotkontraktet på EUREX Hogs stängde veckan på oförändrad nivå, 1.57 euro per Kg.
Mjölk
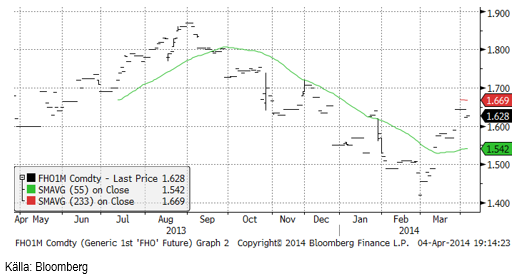
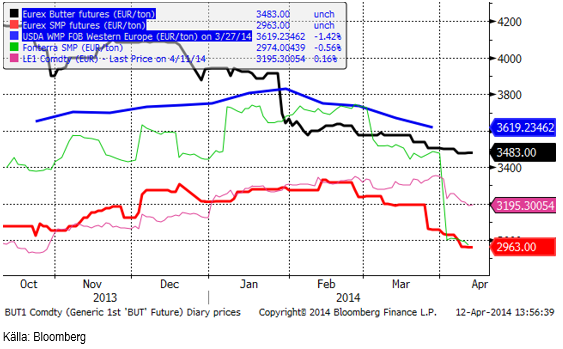
Smörterminerna på Eurex har fortsatt sjunka i veckan och även SMP-terminerna sjönk något lite. Den möjlighet till rekyl, som jag spekulerade om förra veckan uteblev alltså. Trenden mot lägre priser ser ut att fortsätta. Vi lämnar därför förra veckans rekommendation att avvakta med försäljning, till att återgå till säljrekommendation vad gäller terminspriserna.
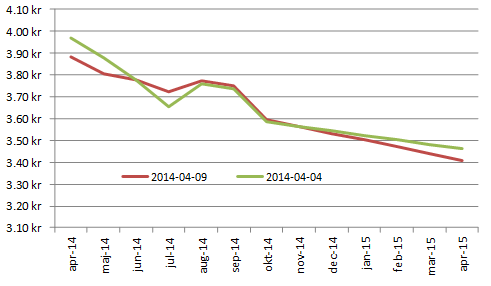
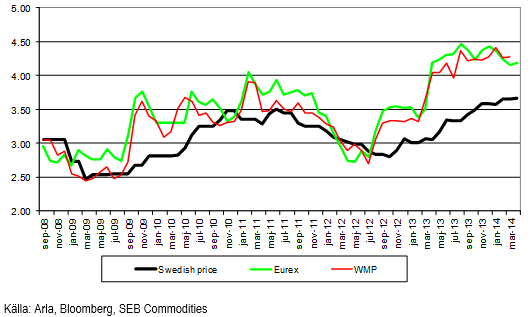
Nedan ser vi terminspriserna man får i svenska kronor från terminspriserna på SMP och smör på Eurex, omräknat till kronor per kilo mjölkråvara. Notera att hela den här prisnivån alltid ska ligga över avräkningspriset på mjölkråvara med ca 50 öre, som är en uppskattning av kostnaden för att förädla mjölkråvara till SMP och smör. Fram till och med oktober finns nu regelmässigt priser på Eurex. Nu fanns det även en köpkurs i januari-kontraktet på smör, som stämde väl överens med vår uppfattning om var priset ska ligga.
Som vi kan se är det framförallt på terminskontrakten april och maj som ligger lite lägre jämfört med förra veckan. Juli och augusti ligger något högre och därefter är det ungefär oförändrat.
ARLA:s avräkningspris för april är i princip oförändrat från månaderna innan (en höjning med 0.1 öre per Kg på Aktuellt Pris och en sänkning med 0.4 öre på Arlanoteringen). Nedan ser vi priser i SEK / Kg för värdet på råmjölk. Dels är det ARLA:s Aktuellt Pris, dels ett pris baserat på USDA:s helmjölkspulvernotering och slutligen EUREX baserat på spotprisindexen för SMP och smör.
Socker
CONAB höjde årets skörd 2014/15 med 4.2% till 39.5 mt. Skörden av sockerrör, själva råvaran väntas öka med 2% till rekordhöga 671.7 mt. Det här är CONABS första estimat på den kommande skörden och den publicerades i torsdags. Detta sjönk uppenbarligen inte in hos marknadens aktörer förrän dagen efter. Möjligen kan det bero på att CONAB:s rapporter enbart publiceras på portugisiska. I fredags föll priset ganska kraftigt och stängde på 17.46 cent. Priset kan nog fortsätta att falla, eftersom hela ”caset” med lägre produktion pga torkan i Brasilien inte existerar längre för socker. Enligt oss har torkan i Brasilien aldrig varit ett ”case” för socker, eftersom Sao Paulo-delstaten visserligen varit åt det torrare hållet, men inte såsom Minas Gerais för kaffe.
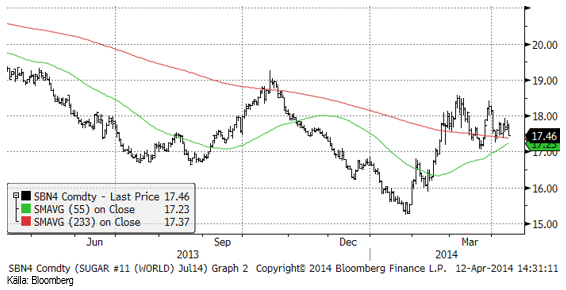
Vi går över från neutral på socker till sälj och rekommenderar köp av BEAR SOCKER X4 S.
Gödsel
Urea-priset, FOB Yuzny ligger kvar på samma nivå som förra veckan.
[box]SEB Veckobrev Jordbruksprodukter är producerat av SEB Commodities Sales desk och publiceras i samarbete och med tillstånd på Råvarumarknaden.se[/box]
Detta marknadsföringsmaterial, framtaget av SEB’s Commodities Sales desk, har upprättats enbart i informationssyfte.
Även om innehållet är baserat på källor som SEB bedömt som tillförlitliga ansvarar SEB inte för fel eller brister i informationen. Den utgör inte oberoende, objektiv investeringsanalys och skyddas därför inte av de bestämmelser som SEB har infört för att förebygga potentiella intressekonflikter. Yttranden från SEB’s Commodities Sales desk kan vara oförenliga med tidigare publicerat material från SEB, då den senare hänvisas uppmanas du att läsa den fullständiga rapporten innan någon åtgärd vidtas.
Dokumentationen utgör inte någon investeringsrådgivning och tillhandahålls till dig utan hänsyn till dina investeringsmål. Du uppmanas att självständigt bedöma och komplettera uppgifterna i denna dokumentation och att basera dina investeringsbeslut på material som bedöms erforderligt. Alla framåtblickande uttalanden, åsikter och förväntningar är föremål för risker, osäkerheter och andra faktorer och kan orsaka att det faktiska resultatet avviker väsentligt från det förväntade. Historisk avkastning är ingen garanti för framtida resultat. Detta dokument utgör inte ett erbjudande att teckna några värdepapper eller andra finansiella instrument. SEB svarar inte för förlust eller skada – direkt eller indirekt, eller av vad slag det vara må – som kan uppkomma till följd av användandet av detta material eller dess innehåll.
Observera att det kan förekomma att SEB, dess ledamöter, dess anställda eller dess moder- och/eller dotterbolag vid olika tillfällen innehar, har innehaft eller kommer att inneha aktier, positioner, rådgivningsuppdrag i samband med corporate finance-transaktioner, investment- eller merchantbankinguppdrag och/eller lån i de bolag/finansiella instrument som nämns i materialet.
Materialet är avsett för mottagaren, all spridning, distribuering mångfaldigande eller annan användning av detta meddelande får inte ske utan SEB:s medgivande. Oaktat detta får SEB tillåta omfördelning av materialet till utvald tredje part i enlighet med gällande avtal. Materialet får inte spridas till fysiska eller juridiska personer som är medborgare eller har hemvist i ett land där sådan spridning är otillåten enligt tillämplig lag eller annan bestämmelse.
Skandinaviska Enskilda Banken AB (publ) är ett [publikt] aktiebolag och står under tillsyn av Finansinspektionen samt de lokala finansiella tillsynsmyndigheter i varje jurisdiktionen där SEB har filial eller dotterbolag.

Market is starting to take US/Iran headlines with a pinch of salt. Brent crude rose $2.8/b yesterday to an official close of $112.1/b. But after that it traded as low as $108.05/b before ending late night at around $109.7/b. Through the day it traded in a range of $106.87 – 112.72/b amid a flurry of news or rumors from Iran and the US. ”US temporary sanctions during negotiations” (falls alarm). ”We will bomb Iran” (not anyhow),… etc. While the market is still fluctuating to this kind of news flow, it is starting to take such headlines with a pinch of salt.

We’ll see. Maybe, maybe not. The Brent M1 contract is trading at $110.2/b this morning which very close to the average ticks through yesterday of $110.4/b.
Trump with bearish, verbal intervention whenever Brent trades above $110/b it seems. What seems to be a pattern is that Trump states something like ”very good negotiations going on with Iran”, ”New leaders in Iran are great,..”, ”Great progress in negotiations,…”, ”Deal in sight,..” etc whenever the Brent M1 contract trades above $110/b. An effort to cool the market. These hot air verbal interventions from Trump used to have a heavy bearish impact on prices, but they now seems to have less and less effect unless they are backed by reality.
As far as we can see there has been no real progress in the negotiations between the US and Iran with both sides still standing by their previous demands.
Iran is getting stronger while the cease fire lasts making a return to war for Trump yet harder. Iran is naturally in constant preparation for a return to war given Trump’s steady threats of bombing Iran again. Iran is naturally doing what ever is possible to prepare for a return to war. And every day the cease fire lasts it is better prepared. This naturally makes it more and more difficult and dangerous for the US to return to warring activity versus Iran as the consequences for energy infrastructure in the Persian Gulf will be more and more severe the longer the cease fire lasts. Israel seems to see it this way as well. That the war is not won and that current frozen state of a cease fire gives Iran opportunity to rebuild military and politically.
Global inventories are drawing down day by day. How much? In the meantime the Strait of Hormuz stays closed. There is varying measures and estimates of how much global inventories are drawing down. Our rough estimate, back of the envelope, is that global inventories are drawing down by at least some 10 mb/d or about 300 mb/d in a balance between loss of supply versus demand destruction. Other estimates we see are a monthly draw of 250-270 mb/d. The IEA only ’measured’ a draw in global observable stocks of 117 mb in April with oil on water rising 53 mb while on shore stocks fell 170 mb. But global stocks are hard to measure with large invisible, unmeasured stocks. As such a back of the envelope approach may be better.
Oil products is what the world is consuming. Oil product prices likely to rise while product stocks fall. Strategic Petroleum Reserves (SPR) are predominantly crude oil. Discharging oil from OECD SPR stocks, a sharp reduction in Chinese crude imports and a reduction in global refinery throughput of 6-7 mb/d has helped to keep crude oil markets satisfactorily supplied. But global inventories are drawing down none the less. And oil products is really what the world is consuming. So if global refinery throughput stays subdued, then demand will eventually have to match the supply of oil products. The likely path forward this summer is a steady draw down in jet fuel, diesel and gasoline. Higher prices for these. Then, if possible, higher refinery throughput and higher usage of crude in response to very profitable refinery margins. And lastly sharper draw in crude stocks and higher prices for these. But some 6 mb/d of oil products used to be exported through the Strait of Hormuz. And it may not be so easy to ramp up refinery activity across the world to compensate. Especially as Ukraine continues to damage Russian refineries as well as Russian crude production and export facilities.
Watch oil product stocks and prices as well as Brent calendar 2027. What to watch for this summer is thus oil product inventories falling and oil product premiums to crude rising. Another measure to watch is the Brent crude 2027 contract as it rises steadily day by day as the Strait of Hormuz stays closed and global oil inventories decline. The latter is close to the highest level since the start of the war and keeps rising.
The Brent M1 contract and the Brent 2027 prices and current price of jet fuel in Europe (ARA). All in USD/b

Our back of the envelope calculation of the global shortage created by the closure of the Strait of Hormuz. Note that 3.5 mb/d of discharge from SPR is also a draw. Note also that ’Forced demand loss’ of 2.5 mb/d is probably temporary and will fall back towards zero as logistics are sorted out leaving ’Price demand loss’ to do the job of balancing the market. Thus a shortfall of at least 9 mb/d created by the closure. More if SPR discharge is included and more if Forced demand loss recedes.

Brent is climbing higher. Front-month is at USD 106.3/bl this morning, close to a weekly high and a USD 9/bl jump from Mondays open. This is the move we flagged as a risk earlier in the week: the market shifting from ”a deal is around the corner” to ”this is going to take longer than we thought”.

Analyst Commodities, SEB
During April, rest-of-year Brent remained remarkably stable around USD 90/bl. A stability which rested on one single assumption: the SoH reopens around 1 May. That assumption is now slowly falling apart.
As we highlighted yesterday: every week of delay beyond 1 May adds (theoretically) ish USD 5/bl to the rest-of-year average, as global inventories draw 100 million barrels per week. i.e., a mid-May reopening implies rest-of-year Brent closer to USD 100/bl, and anything pushing into June or July takes us meaningfully higher.
What’s changed in the last 48 hours:
#1: The US military has formally warned that clearing suspected sea mines from SoH could take up to six months. That is a completely different timescale from what the financial market is pricing. Even a political deal tomorrow does not immediately reopen the strait.
#2: Trump has shifted his tone from urgency to ”strategic patience”. In yesterday’s press conference: ”Don’t rush me… I want a great deal.” The market is reading this as a president no longer feeling pressured by timelines, with the naval blockade running in the background.
#3: So far, the military activity is escalating, not de-escalating. Axios reports Iran is laying more mines in SoH. The US 3rd carrier strike group (USS George H.W. Bush) is arriving with two countermine vessels. Trump yesterday ordered the US Navy to destroy any Iranian boats caught laying mines. While CNN reports that the Pentagon is actively drawing up plans to strike Iranian SoH capabilities and individual Iranian military leaders if the ceasefire collapses. i.e., NOT a attitude consistent with an imminent deal!
Spot crude and product prices eased off the early-April highs on a combination of system rerouting and deal optimism. Both now weakening. Goldman estimates April Gulf output is reduced by 14.5 mbl/d, or 57% of pre-war supply, a number that keeps getting worse the longer this drags on.
Demand-side adaptation is ongoing: S. Korea has cut its Middle East crude dependence from 69% to 56% by pulling more from the Americas and Africa, and Japan is kicking off a second round of SPR releases from 1 May. But SPRs are finite.
Ref. to the negotiations, we should not bet on speed. The current Iranian leadership is dominated by genuine hardliners willing to absorb economic pain and run the clock to extract concessions. That is not a setup for a rapid resolution. US/Israeli media briefings keep framing the delay as ”internal Iranian divisions”, the reality is more complicated and points toward weeks and months, not days.
Our point is that the complexity is large, and higher prices have only just started (given a scenario where the negotiations drag out in time). The market spent April leaning on the USD 90/bl rest-of-year assumption; that case is diminishing by the hour. If ”early May reopening” is replaced by ”June, July or later” over the next week or two, both crude and products have meaningful room to reprice higher from here. There is a high risk being short energy and betting on any immediate political resolution(!).
Down on Friday. Up on Monday. The Brent June crude oil contract traded down 5.1% last week to a close of $90.38/b. It reached a high of $103.87/b last Monday and a low of $86.09/b on Friday as Iran announced that the Strait of Hormuz was fully open for transit. That quickly changed over the weekend as the US upheld its blockade of Iranian oil exports while Iran naturally responded by closing the SoH again. The US blew a hole in the engine room of the Iranian ship TOUSKA and took custody of the ship on Sunday. Brent crude is up 5.6% this morning to $95.4/b.
The cease-fire is expiring tomorrow. The US has said it will send a delegation for a second round of negotiations in Islamabad in Pakistan. But Iran has for now rejected a second round of talks as it views US demands as unrealistic and excessive while the US is also blocking the Strait of Hormuz.
While Brent is up 5% this morning, the financial market is still very optimistic that progress will be made. That talks will continue and that the SoH will fully open by the start of May which is consistent with a rest-of-year average Brent crude oil price of around $90/b with the market now trading that balance at around $88/b.
Financial optimism vs. physical deterioration. We have a divergence where the financial market is trading negotiations, improvements and resolution while at the same time the physical market is deteriorating day by day. Physical oil flows remain constrained by disrupted flows, longer voyage times and elevated freight and insurance costs.
Financial markets are betting that a US/Iranian resolution will save us in time from violent shortages down the road. But every day that the SoH remains closed is bringing us closer to a potentially very painful point of shortages and much higher prices.
The US blockade is also a weapon of leverage against its European and Asian allies. When Iran closed the SoH it held the world economy as a hostage against the US. The US blockade of the SoH is of course blocking Iranian oil exports. But it is also an action of disruption directed towards Europe and Asia. The US has called for the rest of the world to engaged in the war with Iran: ”If you want oil from the Persian Gulf, then go and get it”. A risk is that the US plays brinkmanship with the global oil market directed towards its European and Asian allies and maybe even towards China to force them to engage and take part. Maybe unthinkable. But unthinkable has become the norm with Trump in the White House.


Sommarväder skapar prisrally på elbörsen
Oil product price pain is set to rise as the Strait of Hormuz stays closed into summer

Solkraften pressar elpriserna dagtid

Michel Gubel ger sin syn på oljemarknaden