

Analys
SEB – Råvarukommentarer, 14 april 2014

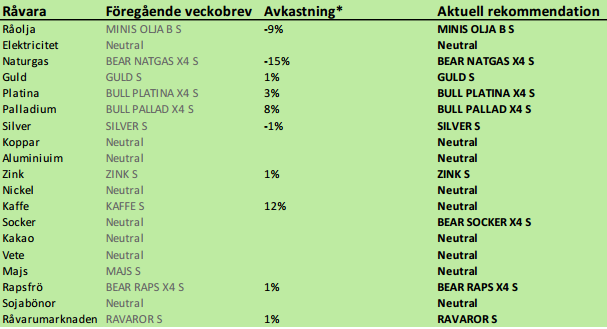
Rekommendationer
Kort sammanfattning
Ädelmetaller, och palladium främst bland dem, fortsätter att vara våra favoriter.
Priserna på spannmål och oljeväxter har generellt sett utvecklats positivt, drivna av torka i USA för vete, lägre areal än förväntat i USA för majs, oron för lägre odlad areal och sämre avkastning i Ukraina och av torkan i januari/februari i Brasilien. Nu har crop ratings kommit för USA:s vete och det är dåligt, men bara 1% sämre än förra årets första estimat. Brasiliens CONAB justerar upp produktionen för flera torkdrabbade jordbruksprodukter och aktiemarknaden har varit väldigt svag de senaste dagarna. En fallande aktiemarknad kan få konsumenterna att hålla igen. Det ser alltså återigen lite svagare ut på marknaderna för jordbruksprodukter.
Råolja – Brent
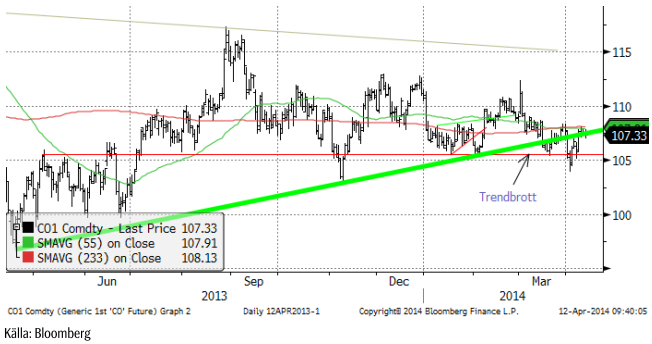
Oljepriset steg i veckan från 104 dollar till 107.33 i fredags. I veckan kom rebellerna och centralregeringen i Libyen överens om att återuppta produktion och export av olja och dela på intäkterna. Libyen exporterade då mindre än 200,000 fat om dagen. Den första oljehamnen av fyra har redan börjat öppnas. Ytterligare en ska snart öppna och de återstående två ska komma igång lite senare. Es Sider är en av de senare. Global produktion ökar då alltså från under 200,000 fat till 1.5 miljoner fat om dagen.
Samtidigt rapporteras att OPEC har dragit ner sin produktion. OPEC försöker alltså hålla priset uppe, vilket de uppenbarligen lyckats med, på kort sikt.
Många marknadskommentatorer har förutspått lägre oljepris under det andra kvartalet, med förväntningarna inställda på ett lågt pris i april. Vi har dock märkt av att det finns köpare som är redo att köpa när priset söker sig nedåt.
Tekniskt är priset uppe vid 108 dollar, som är ett motstånd. Marknaden orkade inte över den nivån, trots statistik i fredags om att konsumenterna i USA ser ljusare på framtiden än tidigare och marknadskommentatorer drog slutsatsen att detta skulle leda till större bensinefterfrågan, vilket vi inte riktigt tror på eftersom USA är ett rikt land där man kör bil oavsett konjunkturläge. Oljepriset vände ner i fredags och stängde alltså på 107.33 dollar. Vi tror att detta är ett säljtillfälle.
Råoljelagren steg med drygt 4 miljoner fat i DOE:s statistik i onsdags förra veckan. Marknaden hade väntat sig en ökning på under 1 miljon fat, så detta var en besvikelse för de är köpta oljepriset.
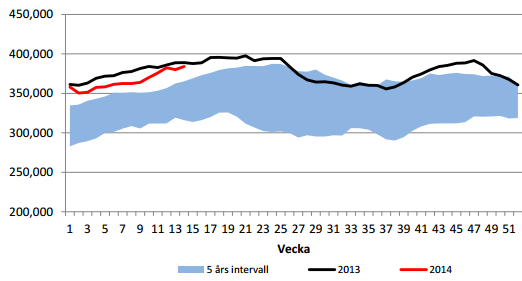
En av anledningarna till de högre lagren var en återhämtning i importen, som var en halv miljon fat högre än veckan innan, som vi ser i diagrammet nedan. Det som dock fyller på lagren är den ökande produktionen av råolja inom USA.
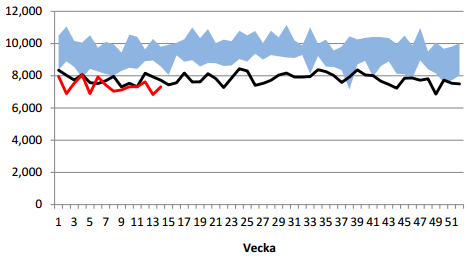
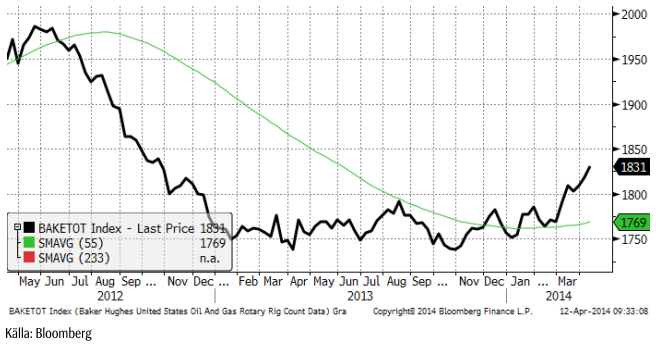
De senaste två åren har USA:s produktion av råolja ökat med 2.5 mbpd till nästan 8 mbpd. Antalet oljeriggar i USA fortsätter i den stigande trenden, som nu är tydlig och som startade för ett halvår sedan. Vi ser Baker Hughes Rig Count i diagrammet nedan, med fredagskvällens antal om 1831 riggar i drift som senaste uppdatering.
Vi rekommenderar en kort position i olja, t ex med MINIS OLJA B S eller MINIS OLJA A S.
Elektricitet
Elpriset fortsatte att falla i en tydlig negativ trend. Omsättningen i terminsmarknaden har sjunkit och vare sig producenter eller konsumenter är glada; konsumenter därför att de i många fall har prissäkrat på högre nivå. Vi ser dock inte något som skulle kunna vända trenden, men vet av erfarenhet om hur elmarknaden kan vända upp snabbt när fundamenta börjar peka uppåt, såsom vi såg ett exempel på förra månaden.
De längre terminskontrakten, dvs för kommande kalenderår, har inte hängt med i den allmänna prisnedgången den senaste veckan. Det finns köpintressen i dem. Det finns också tecken på att långsiktiga produktionsfaktorer, som terminspriset på kol för kalenderår 2015, inte faller i pris, utan istället visar styrka, som vi ska se nedan.
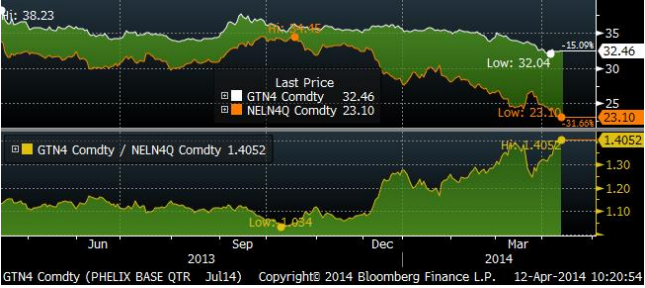
Phelix Baseload för det tredje kvartalet, Tysklands motsvarande kontrakt som tredje kvartalet på Nasdaq Commodities, ligger nu 40.5% över det nordiska. Förra veckan var skillnaden 34%. Den nordiska marknaden är alltså rekordbillig i jämförelse med den kontinentala.
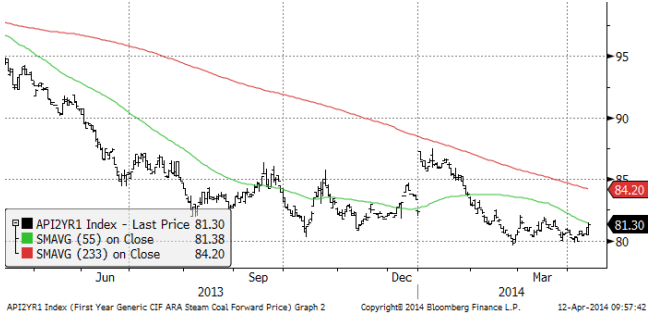
Priset på utsläppsrätter har börjat stiga, efter att ha konsoliderat sig i början på månaden efter priskraschen i mars. De senaste dagarna har priset gått från under 5 euro per ton till 5.37 i fredags. Även priset på kol tycks ha konsoliderat sig.
På kort sikt ser elpriset ut att kunna gå ännu lägre. Marknaden söker en botten. Vi vill inte rekommendera en kort position, därför att priset är så lågt i ett historiskt perspektiv, utan behåller neutral.
Naturgas
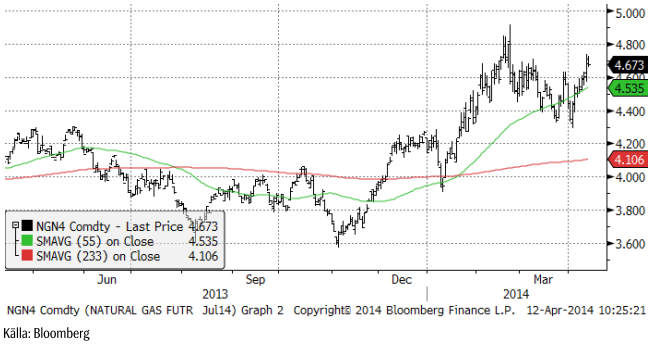
Eftersom det är så kort tid kvar på maj-kontraktet går vi över till att titta på juli-kontraktet. När det väntade prisfallet uteblev, blev motrörelsen (uppåt) starkare. Terminspriset gick från under 4.40 som lägst i april till 4.67 i fredags. Vi fortsätter med säljrekommendation.
Koppar
Kopparpriset har inte hängt med de andra metallerna efter den massiva likvideringen förra månaden. De fundamentala faktorerna är fortfarande svårgreppbara för marknadsanalytikerna. En faktor som kan ha betydelse är att premien för fysisk metall i Kina har fallit stadigt från 160 dollar per ton i februari till 70 dollar (CIF Shanghai).
Metal Bulletin (MB) rapporterar att 800 kt nu hålls i låsta lager i Kina. Prismässigt är det inte gynnsamt att importera metall till Kina just nu. Den preliminära importstatistiken avseende obearbetad koppar visar en uppgång från februaris låga 380 kt till 420 kt. Februaris import var onormalt låg pga det kinesiska nyåret, då en hel arbetsvecka går bort. Mars månads import kom dock inte alls upp i januaris 540 kt. Det verkar som om koncentrat importeras, smälts till metall som sedan lagras i låsta lagerhus i Kina.
Det kom några intressanta kommentarer från Cescos årliga kopparkonferens i Chile. Codelco ifrågasatte prognosen om ett utbudsöverskott i år. De menade att många nya projekt läggs på is pga det låga priset just nu. Kabeltillverkaren Nexans, en av de största kopparkonsumenterna i världen, lyfte frågan om substitution och påminde om att Kina ännu inte har konverterat från koppar till aluminium i kabeltillverkningen för landet, såsom är fallet i resten av världen. Här har vi alltså två av de största aktörerna i polemik med varandra!
Tekniskt ser priset ut att ha stigit färdigt och kan vara redo för en ny nedgång.
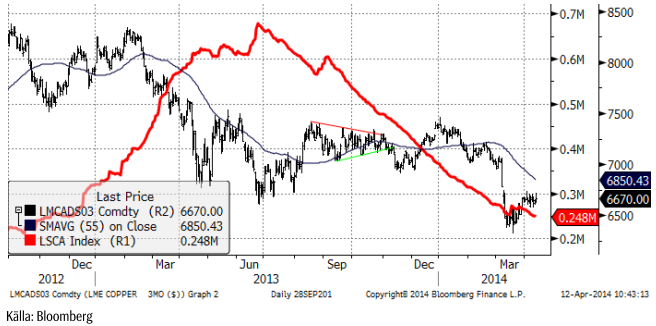
Vi rekommenderar kortsiktigt sälj på koppar.
Aluminium
Alcoa presenterade sin framtidsvision i Q1-rapporten, med en ökning av efterfrågan på 7% och en prognos om ett utbudsunderskott under året – det första på 9 år. Detta satte tonen i marknaden. Detta borde ge marknaden gott stöd, men samtidigt är uppsidan i priset begränsad av de stora lagren.
Den senaste tidens uppgång i priset beror sannolikt främst på att de som väntat sig en förändring i LME-reglerna för lagerhusen och ett större utbud av metall, stängt positioner baserat på dessa förhoppningar. Men vi tror också att det är mer fundamentala faktorer i arbete. Konsumenter är mer oroliga nu för den långsiktiga prisutvecklingen och är mer intresserade av att prissäkra sig långt fram.
Tekniskt noterar vi först och främst friskheten i uppgången. Det första motståndet finns på 1900 dollar.
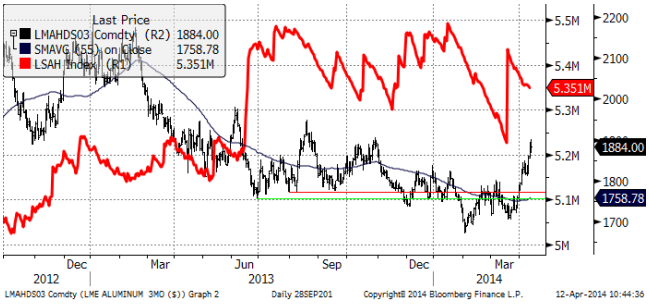
Vi fortsätter med neutral rekommendation på aluminium.
Zink
Zinkpriset följde de andra metallerna i veckan. Lagersituationen i aluminium följs av zinkaktörerna också. ILZSG-statistiken från förra veckan har förbättrat sentimentet och underlättar för marknaden att skaka av sig den negativa stämningen i kopparmarknaden. Trendmässigt är frånvaron av trend det mest uppenbara nu.
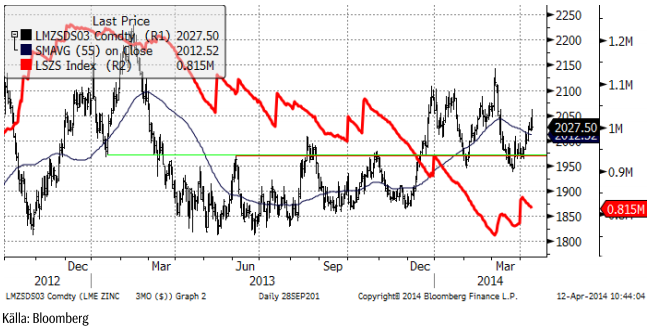
Vi rekommenderar köp av ZINK S eller BULL ZINK X4 S.
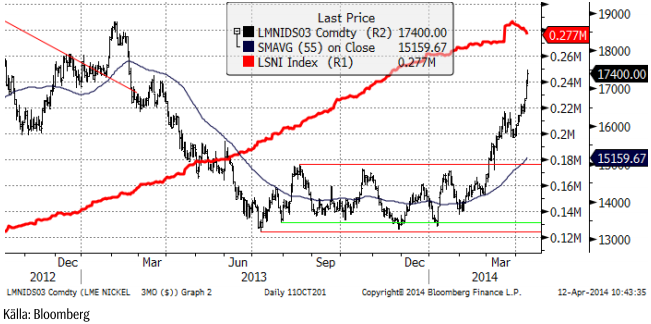
Nickel
Nickelpriset har gått upp 7% på en vecka. Vi har uppenbarligen underskattat styrkan i marknaden. Vi trodde processen skulle gå långsammare. Intressant är att LME-lagren har börjat falla! Om kineserna verkligen behöver metall, ser man det i LME-lagren och det gör vi nu. I veckan har det talats om att kinesiska verk baserade på NPI kommer att slå igen, eftersom det är svårt att få tag på råvaran. Priset på malm från Filippinerna är betydligt dyrare än den från Indonesien. Den senaste riskfaktorn, ett embargo mot Ryssland, har också bidragit till ett positivt sentiment.
Tekniskt har marknaden nått sin ”övre gräns” i den branta trendkanalen för uppgången. En rekyl nedåt har potential till 16750 dollar. Vi behåller vår rekommendation att utnyttja rekyler för köp. Om det inte blir något embargo mot Ryssland, vilket är mest troligt att det inte blir, och exportsäsongen från Norilsk kan komma igång som vanligt nu i vår, finns förutsättningar för en större rekyl nedåt.
Guld
Det var ingen överraskning när FOMC-protokollet publicerades i veckan, att se att det är en mer försiktig inställning till tapering, dvs nedtrappningen av QE3, som berättas om där. Som vi skrev förra veckan, tydde FED-chefen Janet Yellens blixtsnabba kommentar efter den återigen oväntat svaga arbetsmarknadsstatistiken på att penningpolitiken i USA kommer att vara mer expansiv än vad som ligger i förväntningarna.
Även i Sverige skjuts Riksbankens prognosticerade räntekurva (som indikerar högre räntor) hela tiden framåt. Räntehöjningarna som flaggas för, uteblir.
Kina, som haft de första betalningsinställningarna på företagsobligationer den senaste tiden, har enorma mängder av dåliga krediter. Vi skrev förra veckan om att Kina också lagt ett stimulanspaket. Vad som faktiskt sker, i motsats till vad centralbankschefer säger ska komma att ske, är att penningmängden faktiskt forsätter att öka, generellt, i världen. I diagrammet nedan ser vi guldpriset och penningmängden i USA, båda i dollar.
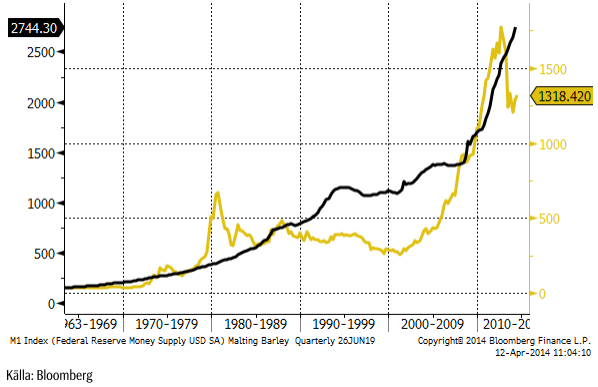
Guldet ser alltså ”billigt” ut i förhållande till utvecklingen i penningmängden på lång sikt.
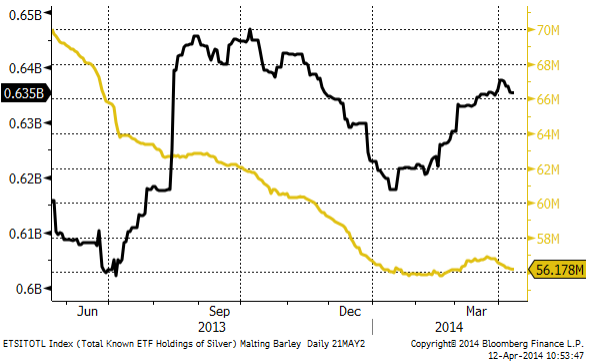
ETF-investerare har sålt både guld och silver hittills i april, som vi ser av diagrammet nedan.
Vi rekommenderar köp av GULD S.
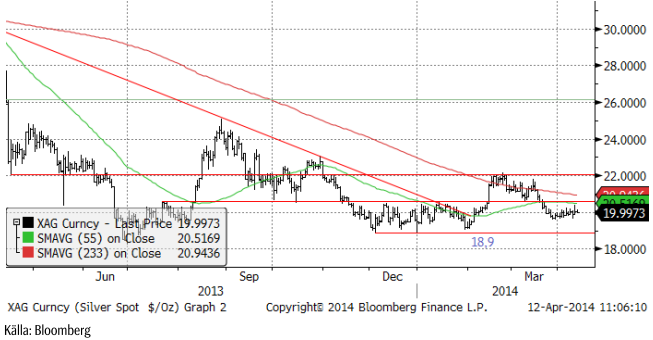
Silver
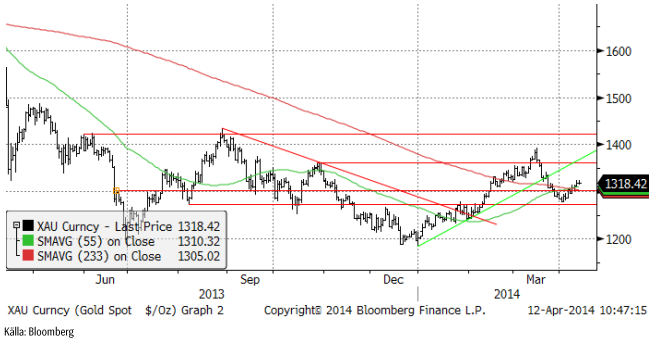
Silverpriset låg i veckan kvar inom konsolideringsnivån mellan 18.90 och 20 dollar per fin-uns. Vi tycker att silver ser mer köpvärt ut än guld, främst för att guld handlas på ett högt pris i silvertermer.
Nedan ser vi ett diagram över priset på guld uttryckt i silver. Det går alltså över 65 finuns silver på varje fin-uns av guld. Som vi ser är det en hög nivå, dvs silver är billigt i förhållande till guld.
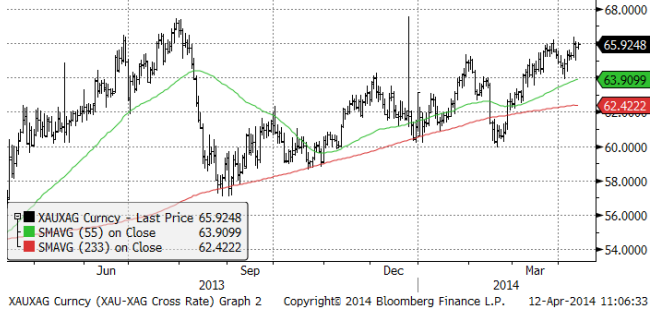
Vi anser att silver är mer köpvärt än guld och skulle vilja köpa på de här nivåerna. Vi rekommenderar köp av SILVER S.
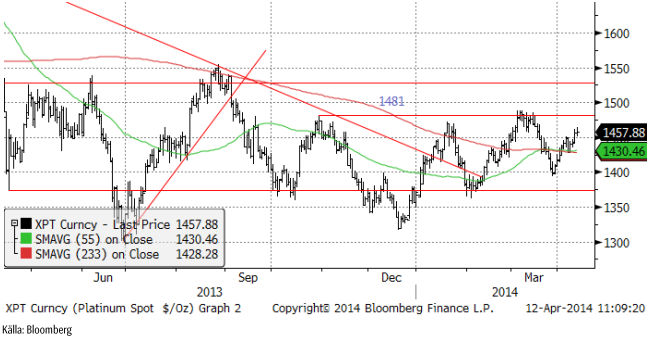
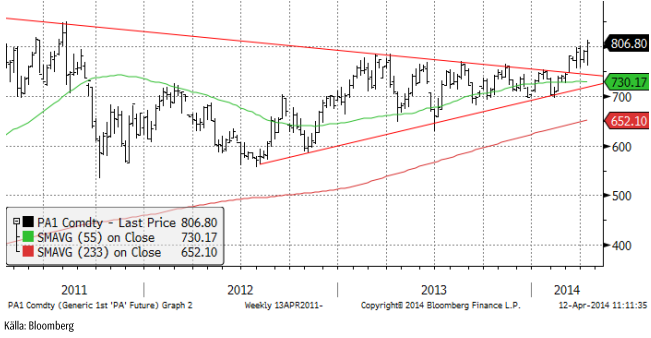
Platina & Palladium
Platina-priset noterar högre toppar och högre bottnar. Efter den lilla rekyl som var för en vecka sedan, har trenden fortsatt uppåt. Ett test av motståndsnivån vid 1481 dollar ser ut kunna bli av i veckan som kommer.
Priset på palladium, gick från 788 dollar till 806.80, när marknaden stängde i fredags. Fredagens handel var hausse-artad, efter att 800-dollar passerats. 800 dollar var en viktig motståndsnivå som nu är bruten. All-time-high är 861 dollar och den är inom räckhåll nu.
Vi rekommenderar köp av PLATINA S och PALLADIUM S, eller BULL PLATINA X4 S eller BULL PALLAD X4 S.
För den som vill ta ännu mer risk, finns nu även BULL PALLAD X5 S.
Kaffe
Kaffepriset steg upp till den gamla toppen. I diagrammet nedan ser vi prisutvecklingen för juli-kontraktet där priset vände vid den föregående toppen på 110.65 cent per pund. Vi väljer att kliva av KAFFE S och gå över till neutral. Skulle priset gå över 110.65 är motståndet brutet, men vi tror att det är mer troligt att priset faller tillbaka till 180 centsnivån.
Med den rapport om en befarad produktion i Brasilien på drygt 40 miljoner säckar, kan det bli ett underskott i år på ca 7 miljoner säckar under det kommande marknadsföringsåret. Det blir då det första året med underskott på fem år. Enligt mäklarfirman Marex Spectron är det ansamlade lagret från åren med överproduktion uppskattningsvis 9.65 miljoner säckar.
Kaffeexperten Judy Ganes-Chase, som driver konsultfirman J Ganes Consulting i Panama, skrev i en rapport att torkan i Brasilien kommer att påverka produktionen i upp till tre år. Kaffeträden har inte kunnat suga upp tillräckligt med näring och är känsliga för sjukdomar. Judy menar att detta kommer att visa sig så småningom. Ett El Niño nästa vinter kan öka nederbörden i Brasilien och öka risken för och angreppen av bladrost.
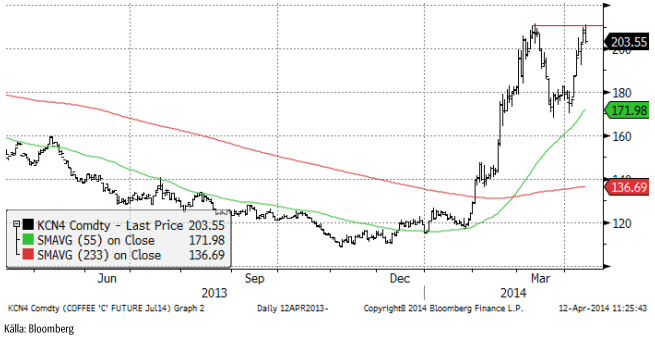
Vi går över till neutral rekommendation och säljer alltså KAFFE S, som köptes förra veckan. Skulle nivån på 110.65 cent brytas på uppsidan köper vi naturligtvis omedelbart KAFFE S igen.
Kakao
Priset på kakao i New York steg upp till 3000 dollar i veckan, men överlag har uppgången tappat mycket momentum. För att behålla den stigande trenden måste marknaden ta ett kliv uppåt nu. Gör den inte det, är det nog slut med haussen i kakao.
Förra veckan rapporterade vi om att leveranserna av bönor till hamnarna i Elfenbenskusten ökat med 8.7% från förra året. Det har nu även kommit information om att leveranserna av bönor till hamnen i Ghana, världens näst största producent, steg till 598 kt till 673 kt under säsongen till och med den 13 mars. Det är en ökning med 12.5%!
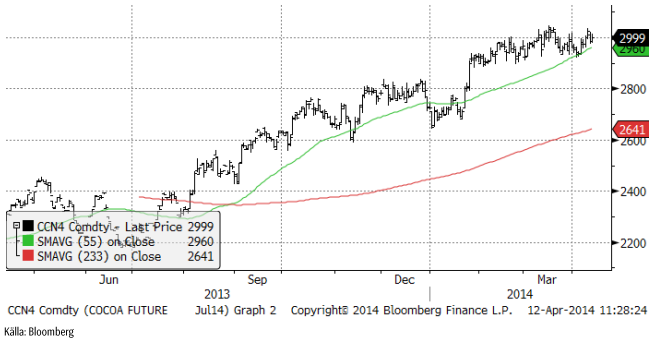
Vi rekommenderar en neutral position vid dagens situation.
[box]SEB Veckobrev Veckans råvarukommentar är producerat av SEB Merchant Banking och publiceras i samarbete och med tillstånd på Råvarumarknaden.se[/box]
Disclaimer
The information in this document has been compiled by SEB Merchant Banking, a division within Skandinaviska Enskilda Banken AB (publ) (“SEB”).
Opinions contained in this report represent the bank’s present opinion only and are subject to change without notice. All information contained in this report has been compiled in good faith from sources believed to be reliable. However, no representation or warranty, expressed or implied, is made with respect to the completeness or accuracy of its contents and the information is not to be relied upon as authoritative. Anyone considering taking actions based upon the content of this document is urged to base his or her investment decisions upon such investigations as he or she deems necessary. This document is being provided as information only, and no specific actions are being solicited as a result of it; to the extent permitted by law, no liability whatsoever is accepted for any direct or consequential loss arising from use of this document or its contents.
About SEB
SEB is a public company incorporated in Stockholm, Sweden, with limited liability. It is a participant at major Nordic and other European Regulated Markets and Multilateral Trading Facilities (as well as some non-European equivalent markets) for trading in financial instruments, such as markets operated by NASDAQ OMX, NYSE Euronext, London Stock Exchange, Deutsche Börse, Swiss Exchanges, Turquoise and Chi-X. SEB is authorized and regulated by Finansinspektionen in Sweden; it is authorized and subject to limited regulation by the Financial Services Authority for the conduct of designated investment business in the UK, and is subject to the provisions of relevant regulators in all other jurisdictions where SEB conducts operations. SEB Merchant Banking. All rights reserved.

Selling down on a ”deal”. Brent crude fell 6.2% last week with accelerated weakness towards the end of the week. Close of the week at $87.33/b and low of the week (and on Friday) of $85.8/b. Brent is falling another 4% this morning to $83.7/b on confirmation by Iran that a MoU text has been reached and that it will be signed on Friday this week.

So what is this ”deal” worth? Talk on the desk here this morning is that it is much like ”putting lipstick on a pig” where Trump has to sell this at home as a victory where ”the SoH has reopened”, the nuclear issue will be ironed out over the coming 60 days (or maybe 600 days?) and US consumers are getting a lower gasoline price and maybe US republicans survives the midterm elections.
The importance for Iran is that it emerges as the defacto winner of this war in the eyes of the non-US public world. That Iran now onwards is the ”ruler of the SoH” (combo of geography and new weapons systems like drones) or more softer: ”the guarantor of safe passage through the SoH”.
Iran doesn’t need nuclear weapons any more. Nuclear deterrence doesn’t work any more. Ukraine has made many attacks deep into Russia without being nuked in return. Plenty of Iranian ballistic rockets blasts over Israel but Iran wasn’t nuked in return.
There is no trust between the US and Iran. We don’t know all the details yet of the MoU. But what we do know is that there is no trust between the US and Iran what so ever. This is probably more like a descriptive text on how they can cooperate in a way where both sides keeps tactical leverage. Neither side makes irreversible concessions. Violations can be punished quickly. Cooperation produces immediate benefits.
This is a fragile structure. It can easily break down. There may be details which cannot be overcome. To be seen on Friday. The US has to show that it is willing put enough force behind managing and restraining Israel versus Hezbollah in Lebanon. We have seen that Netanyahu hasn’t listened all that much to Trump’s directives and wishes. This could be a major obstacle.
A gradual reopening is tactically preferable for Iran. A tactical leverage for Iran right now is that global oil stocks have been drawn down towards painful and increasingly dangerous levels with increasing risks for oil price spikes in mid-July to August. This together with US midterm elections on 3 November gives tactical leverage to Iran. Iran probably doesn’t want to fully give up on that leverage. A rapid, full reopening where global stocks are able to refill over the coming 60 days will significantly erode that leverage. If Iran reinstates a closure of the SoH after 60 days (if talks break down again), then the effect won’t be that impactful in terms of prices and the US midterm elections.
So a gradual and partial reopening where global markets gets the oil they need while they are unable to rebuild stocks could be a practical middle way for both parties. Trump can sell it as ”the SoH has reopened” and get affordable gasoline for US consumers. Iran can sell it as ”the SoH has fully reopened, but there is some friction” so flow is only 60-80% of normal.
Not much real demand destruction below $100/b. What we do know is that there is not much real price pain demand destruction for oil globally at an oil price below $100/b. A lot of demand-shock destruction. Fear. But demand should now come roaring back towards normal with fear for exceptionally high prices now is rapidly receding.
Sudden China demand destruction due to EVs? Bullocks. EV share of total Chinese carpool now around 13%. Share of new sales of EVs has reached 50%. This is a very gradual process. It doesn’t make oil demand fall like a rock over night. When EV new sales share reaches 100%, then the gasoline car pool will contract by some 5-10% per year. But that is only gasoline. Sudden reduction in Chinese oil demand is more about shock and risk.
Chinese crude oil imports will come roaring back. At what price? Today’s ”neutral” oil price is $70/b. That is the five year price which has steadily traded around the $70/b mark over the past 3-4 years. With still a risky picture one would think that China and the rest of the world will be big buyers of oil in the range of $70-85/b.
Global demand will likely snap back towards normal, forecasted demand and growth at such prices.
Physical reopening is a gradual process. The physical and practical reopening of the SoH will likely be gradual rather than sudden. And that probably suites Iran tactically as well.
Brent M1 price versus the Brent 5-yr (today’s ”normal” price)

Market is starting to take US/Iran headlines with a pinch of salt. Brent crude rose $2.8/b yesterday to an official close of $112.1/b. But after that it traded as low as $108.05/b before ending late night at around $109.7/b. Through the day it traded in a range of $106.87 – 112.72/b amid a flurry of news or rumors from Iran and the US. ”US temporary sanctions during negotiations” (falls alarm). ”We will bomb Iran” (not anyhow),… etc. While the market is still fluctuating to this kind of news flow, it is starting to take such headlines with a pinch of salt.
We’ll see. Maybe, maybe not. The Brent M1 contract is trading at $110.2/b this morning which very close to the average ticks through yesterday of $110.4/b.
Trump with bearish, verbal intervention whenever Brent trades above $110/b it seems. What seems to be a pattern is that Trump states something like ”very good negotiations going on with Iran”, ”New leaders in Iran are great,..”, ”Great progress in negotiations,…”, ”Deal in sight,..” etc whenever the Brent M1 contract trades above $110/b. An effort to cool the market. These hot air verbal interventions from Trump used to have a heavy bearish impact on prices, but they now seems to have less and less effect unless they are backed by reality.
As far as we can see there has been no real progress in the negotiations between the US and Iran with both sides still standing by their previous demands.
Iran is getting stronger while the cease fire lasts making a return to war for Trump yet harder. Iran is naturally in constant preparation for a return to war given Trump’s steady threats of bombing Iran again. Iran is naturally doing what ever is possible to prepare for a return to war. And every day the cease fire lasts it is better prepared. This naturally makes it more and more difficult and dangerous for the US to return to warring activity versus Iran as the consequences for energy infrastructure in the Persian Gulf will be more and more severe the longer the cease fire lasts. Israel seems to see it this way as well. That the war is not won and that current frozen state of a cease fire gives Iran opportunity to rebuild military and politically.
Global inventories are drawing down day by day. How much? In the meantime the Strait of Hormuz stays closed. There is varying measures and estimates of how much global inventories are drawing down. Our rough estimate, back of the envelope, is that global inventories are drawing down by at least some 10 mb/d or about 300 mb/d in a balance between loss of supply versus demand destruction. Other estimates we see are a monthly draw of 250-270 mb/d. The IEA only ’measured’ a draw in global observable stocks of 117 mb in April with oil on water rising 53 mb while on shore stocks fell 170 mb. But global stocks are hard to measure with large invisible, unmeasured stocks. As such a back of the envelope approach may be better.
Oil products is what the world is consuming. Oil product prices likely to rise while product stocks fall. Strategic Petroleum Reserves (SPR) are predominantly crude oil. Discharging oil from OECD SPR stocks, a sharp reduction in Chinese crude imports and a reduction in global refinery throughput of 6-7 mb/d has helped to keep crude oil markets satisfactorily supplied. But global inventories are drawing down none the less. And oil products is really what the world is consuming. So if global refinery throughput stays subdued, then demand will eventually have to match the supply of oil products. The likely path forward this summer is a steady draw down in jet fuel, diesel and gasoline. Higher prices for these. Then, if possible, higher refinery throughput and higher usage of crude in response to very profitable refinery margins. And lastly sharper draw in crude stocks and higher prices for these. But some 6 mb/d of oil products used to be exported through the Strait of Hormuz. And it may not be so easy to ramp up refinery activity across the world to compensate. Especially as Ukraine continues to damage Russian refineries as well as Russian crude production and export facilities.
Watch oil product stocks and prices as well as Brent calendar 2027. What to watch for this summer is thus oil product inventories falling and oil product premiums to crude rising. Another measure to watch is the Brent crude 2027 contract as it rises steadily day by day as the Strait of Hormuz stays closed and global oil inventories decline. The latter is close to the highest level since the start of the war and keeps rising.
The Brent M1 contract and the Brent 2027 prices and current price of jet fuel in Europe (ARA). All in USD/b

Our back of the envelope calculation of the global shortage created by the closure of the Strait of Hormuz. Note that 3.5 mb/d of discharge from SPR is also a draw. Note also that ’Forced demand loss’ of 2.5 mb/d is probably temporary and will fall back towards zero as logistics are sorted out leaving ’Price demand loss’ to do the job of balancing the market. Thus a shortfall of at least 9 mb/d created by the closure. More if SPR discharge is included and more if Forced demand loss recedes.

Brent is climbing higher. Front-month is at USD 106.3/bl this morning, close to a weekly high and a USD 9/bl jump from Mondays open. This is the move we flagged as a risk earlier in the week: the market shifting from ”a deal is around the corner” to ”this is going to take longer than we thought”.

Analyst Commodities, SEB
During April, rest-of-year Brent remained remarkably stable around USD 90/bl. A stability which rested on one single assumption: the SoH reopens around 1 May. That assumption is now slowly falling apart.
As we highlighted yesterday: every week of delay beyond 1 May adds (theoretically) ish USD 5/bl to the rest-of-year average, as global inventories draw 100 million barrels per week. i.e., a mid-May reopening implies rest-of-year Brent closer to USD 100/bl, and anything pushing into June or July takes us meaningfully higher.
What’s changed in the last 48 hours:
#1: The US military has formally warned that clearing suspected sea mines from SoH could take up to six months. That is a completely different timescale from what the financial market is pricing. Even a political deal tomorrow does not immediately reopen the strait.
#2: Trump has shifted his tone from urgency to ”strategic patience”. In yesterday’s press conference: ”Don’t rush me… I want a great deal.” The market is reading this as a president no longer feeling pressured by timelines, with the naval blockade running in the background.
#3: So far, the military activity is escalating, not de-escalating. Axios reports Iran is laying more mines in SoH. The US 3rd carrier strike group (USS George H.W. Bush) is arriving with two countermine vessels. Trump yesterday ordered the US Navy to destroy any Iranian boats caught laying mines. While CNN reports that the Pentagon is actively drawing up plans to strike Iranian SoH capabilities and individual Iranian military leaders if the ceasefire collapses. i.e., NOT a attitude consistent with an imminent deal!
Spot crude and product prices eased off the early-April highs on a combination of system rerouting and deal optimism. Both now weakening. Goldman estimates April Gulf output is reduced by 14.5 mbl/d, or 57% of pre-war supply, a number that keeps getting worse the longer this drags on.
Demand-side adaptation is ongoing: S. Korea has cut its Middle East crude dependence from 69% to 56% by pulling more from the Americas and Africa, and Japan is kicking off a second round of SPR releases from 1 May. But SPRs are finite.
Ref. to the negotiations, we should not bet on speed. The current Iranian leadership is dominated by genuine hardliners willing to absorb economic pain and run the clock to extract concessions. That is not a setup for a rapid resolution. US/Israeli media briefings keep framing the delay as ”internal Iranian divisions”, the reality is more complicated and points toward weeks and months, not days.
Our point is that the complexity is large, and higher prices have only just started (given a scenario where the negotiations drag out in time). The market spent April leaning on the USD 90/bl rest-of-year assumption; that case is diminishing by the hour. If ”early May reopening” is replaced by ”June, July or later” over the next week or two, both crude and products have meaningful room to reprice higher from here. There is a high risk being short energy and betting on any immediate political resolution(!).


Vattenfalls och Industrikrafts kärnkraftsbolag Videberg Kraft har valt Rolls-Royce SMR
Selling down on a ”deal”

Sommarväder skapar prisrally på elbörsen
Oil product price pain is set to rise as the Strait of Hormuz stays closed into summer

Solkraften pressar elpriserna dagtid
Oil product price pain is set to rise as the Strait of Hormuz stays closed into summer
Sommarväder skapar prisrally på elbörsen
Vattenfalls och Industrikrafts kärnkraftsbolag Videberg Kraft har valt Rolls-Royce SMR
Selling down on a ”deal”
-
Analys4 veckor sedan
Oil product price pain is set to rise as the Strait of Hormuz stays closed into summer
-
Nyheter2 veckor sedan
Sommarväder skapar prisrally på elbörsen
-
 Nyheter3 dagar sedan
Vattenfalls och Industrikrafts kärnkraftsbolag Videberg Kraft har valt Rolls-Royce SMR
-
Analys3 dagar sedan
Selling down on a ”deal”