

Analys
Råvarudeskens Årskrönika 2013

 ”Tailrisk-tapering-flattening”
Året då stimulanserna tog slut
 Under 2012 var ”tailrisk” modeordet som sammanfattade alla händelser av låg sannolikhet som skulle få stor inverkan om de inträffade. För råvarumarknaden var den mest uppenbara tailrisken konflikten mellan Israel och Iran. På makroplanet var riskerna kring EMU-zonen och USA:s konjunkturåterhämtning mest alarmerande tillsammans med Kinas inbromsning.
För att tysta Janne Korp* blandade USA, Kina och Europa ihop en trolldryck som hette duga. QE3 och Kinas sista egentliga stimulansinvesteringar kom under sensommaren 2012, medan 2013 har i mångt och mycket präglats av att stimulansfloden torkat upp. För USA:s del har episoden gått under namnet ”tapering” som också blev årets modeord. Bernankes ordlek kring när och hur tapering skulle uppstå har styrt marknadsrörelserna för att slutligen anlända som en vältimad julklapp i december. I Öst har de nytillträdda (inte nyvalda!) kinesiska ledarnas dito kommunikation kring tillväxtmålet som sänktes till 7,5 % och stimulansinvesteringar som nu skulle stabilisera och inte accelerera tillväxten haft minst lika stor påverkan på råvarupriserna.
Inget råvarurally
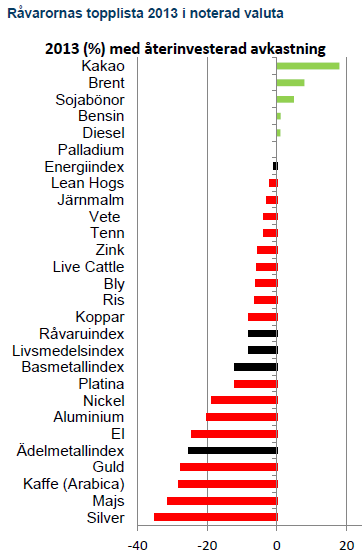
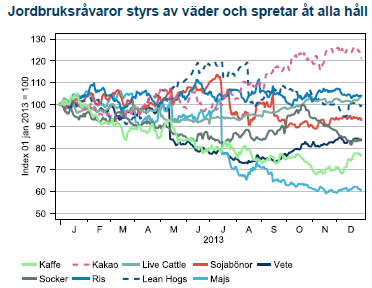
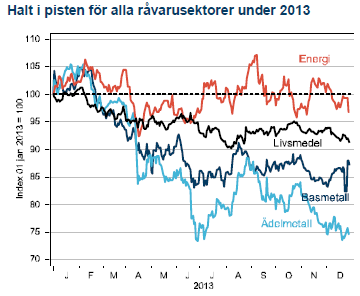 Fjolårets årskrönika titulerades ”Triskaidekafobia” – en grekisk ordlek med rädslan för den då stundande siffran 13. Otursnumret förde också ner råvarupriserna med besked. Vårt råvaruindex med 15 stycken råvaror tappade 8 % under året. Ingen av råvarusektorerna har stigit i värde. Energikorgen slutar precis under nollan på -1 % medan basmetaller, ädelmetaller och jordbruk föll med 12 %, 25 % och 8 %. Precis som i fjol ligger en jordbruksråvara i topp och på 2 av 3 bottenplatser. En tydlig erinran om vädergudens bidrag till volatiliteten i råvarupriserna. På samma tema finns majs och vete som fallit tillbaka efter fjolårets uppgång efter torkan i USA. Basmetallerna har dämpats efter att mycket av de högt ställda förväntningarna på produktionsökningar kommit till stånd. Ädelmetallerna har dock fallit mest, i egenskap av primär måltavla för årets modenyck – tapering.
Fallande priser har fått investerare att vikta ner råvaror medan våra industriella kunder utnyttjat de låga priserna på metaller för att säkra sina behov långt ut på kurvan. Elintensiva bolag kunde låsa in elpriset på 29,5öre/kWh 5 år framöver, vilket är det lägsta pris vi haft sedan 2005. Många lyckosamma jordbrukare sålde vete i grevens tid i början av året, innan den globala skörden på allvar fick priserna på fall.
* olyckskorpen i Fablernas värld, producerad 1968-1992
Guldet mitt i skottgluggen
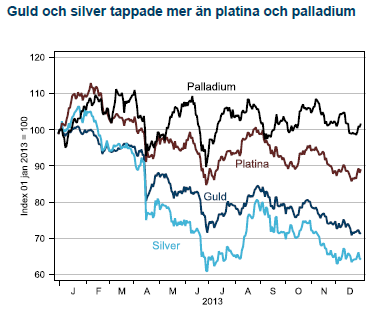 Året började med en stark förbättring av konjunkturutsikterna när USA undvek en skarp inbromsning efter det fiskala stupet och riskerna för att Euron skulle brytas upp minskade. I kölvattnet av denna starka start ökade investerares riskaptit och både guld och silver såldes till fördel för aktier. När sedan den oortodoxa penningpolitiken åter skulle börja tvingas in ramen för ortodox politik hamnade guld och silver mitt i skottgluggen. Utflödena ur guld-ETF:er var lavinartade och guld har under 2013 tappat 28 %, det största raset på 30 år. Investerare har allt sedan Fed:s QE1-start 2008 köpt guld och silver som hedge mot det kommande inflationsspöket. Spöket kom visserligen men snarare under namnet deflationsspöke (USA+EMU) och när nu Feds stimulanser avtar finner många guldgrävare det smärtsamma slutet på epoken för ”råvaran som inte kan gå ned”. När 2014 ser ut att bli ett säkrare år för världskonjunkturen, eurozonen fortfarande är intakt och Iran har kommit till förhandlingsbordet tror vi att guldet fortsätter ner och investerare som vill ha en icke centralbanksknuten valuta väljer Bitcoins (!).
Gruvbolagen försöker vända skutan
 Även utanför Sverige har gruvindustrin känt på prövningar under året som gått. I de tre stora gruvbolagen listade i London (Rio, BHP och Anglo America) har VD:n fått betala med sitt jobb när kostnadsstrukturen totalt missmatchat Kinas inbromsning och de lägre metallpriserna. Efterträdarna har målat upp bolagsstrategi i klassisk svångremsanda. Trendmässigt kan det vara ett tecken på att de senaste årens produktionsvåg huvudsakligen är över och för 2014 ser marknaden mer balanserad ut. Undantaget är järnmalm och koppar där en ny våg kommer under 2014.
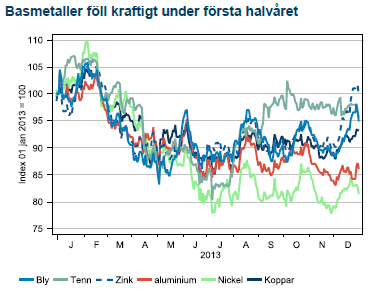
Nedgången för basmetaller kom under första halvåret då Kinas inbromsning verkade ske helt okontrollerat. När Kinas nya ledare började stimulera för att stabilisera ekonomin stabiliserades också basmetallerna. Ett rally under december avslutade året klart över bottenkänningen kring midsommar.
Brent blev årets skidbacke
 Under buller och bång har USA:s oljeproduktion stigit till 25 års högsta. På mindre än tre år har världens största oljekonsument vänt 40 år av fallande oljeproduktion till den största överraskningen i oljehistorien. Glädjande för oljepropagandamaskineriets fader, Obama, var också att under 2014 kommer importen för första gången på 20 år att vara lägre än produktionen. Denna utbudschock till trots har Brentoljan handlats i backwardation under hela året. USA:s stigande produktion har ganska precist kompenserats av den sammanlagda exportminskningen ifrån Iran, Libyen, Irak och Nigeria. De eviga produktionsstörningarna i områden med inverkan på Brentpriset (FOB Shetlandsöarna) har lett till en kraftig kurvlutning som gett investerare 12 % trots att Brent bara stigit med 6 %. USA-handlade WTI oljan har med stigande produktion istället legat i contango och givit dyr rullning för råvaruindex med WTI som underliggande oljetillgång.
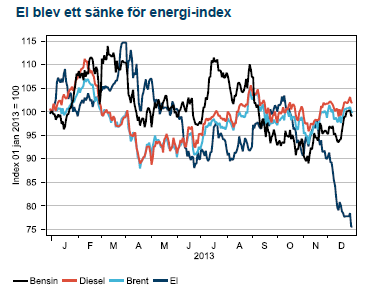
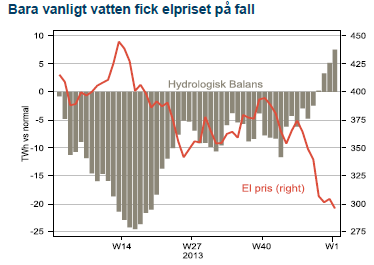 Råolja och oljeprodukterna bensin och diesel slutar året svagt i dur medan el blev årets besvikelse och föll hämningslöst under årets sista kvartal. En mild början på vintern (trots alla granna rönnbärsträd i oktober), en snabb påfyllning av vattenmagasinen från ett underskott till normalnivå och en sällsynt välfungerande svensk kärnkraft utgjorde mixen bakom prisraset i el.
Torkan över för den här gången
Årets stora rörelse var återhämtningen i produktion av majs efter torkan i USA 2012. Priset föll som en sten och placerade majs i botten av all råvaror 2013. Vinnaren bland livsmedelsråvarorna blev kakao som fortsätter sin långa, efterfrågedrivna trend uppåt. Utsikterna för stigande kakaopriser är fortfarande goda och lämnar en bitter eftersmak för chokladälskare.
Nu börjar hästens år
 Hästens år är sjunde året i den kinesiska zodiakens cykel om 12 år. Hästen står för det ädla och eleganta men också för snabbhet och uthållighet. Frågan är om den kinesiska ekonomin likaledes kommer uppvisa snabbhet och uthållighet under 2014? Troligen kommer den kinesiska ekonomin att hålla styrfart (>7 %) men uppsidan begränsas hela tiden av reformbehoven som ständigt aktualiseras när saker och ting ser ljusare ut. USA ska enligt Fed nu klara sig utan stimulanser medan Europa tragglar vidare precis norr om recession (1 %). Budskapet är tydligt; vi tror att ”flattening” kommer bli årets modeord 2014.


Market is starting to take US/Iran headlines with a pinch of salt. Brent crude rose $2.8/b yesterday to an official close of $112.1/b. But after that it traded as low as $108.05/b before ending late night at around $109.7/b. Through the day it traded in a range of $106.87 – 112.72/b amid a flurry of news or rumors from Iran and the US. ”US temporary sanctions during negotiations” (falls alarm). ”We will bomb Iran” (not anyhow),… etc. While the market is still fluctuating to this kind of news flow, it is starting to take such headlines with a pinch of salt.

We’ll see. Maybe, maybe not. The Brent M1 contract is trading at $110.2/b this morning which very close to the average ticks through yesterday of $110.4/b.
Trump with bearish, verbal intervention whenever Brent trades above $110/b it seems. What seems to be a pattern is that Trump states something like ”very good negotiations going on with Iran”, ”New leaders in Iran are great,..”, ”Great progress in negotiations,…”, ”Deal in sight,..” etc whenever the Brent M1 contract trades above $110/b. An effort to cool the market. These hot air verbal interventions from Trump used to have a heavy bearish impact on prices, but they now seems to have less and less effect unless they are backed by reality.
As far as we can see there has been no real progress in the negotiations between the US and Iran with both sides still standing by their previous demands.
Iran is getting stronger while the cease fire lasts making a return to war for Trump yet harder. Iran is naturally in constant preparation for a return to war given Trump’s steady threats of bombing Iran again. Iran is naturally doing what ever is possible to prepare for a return to war. And every day the cease fire lasts it is better prepared. This naturally makes it more and more difficult and dangerous for the US to return to warring activity versus Iran as the consequences for energy infrastructure in the Persian Gulf will be more and more severe the longer the cease fire lasts. Israel seems to see it this way as well. That the war is not won and that current frozen state of a cease fire gives Iran opportunity to rebuild military and politically.
Global inventories are drawing down day by day. How much? In the meantime the Strait of Hormuz stays closed. There is varying measures and estimates of how much global inventories are drawing down. Our rough estimate, back of the envelope, is that global inventories are drawing down by at least some 10 mb/d or about 300 mb/d in a balance between loss of supply versus demand destruction. Other estimates we see are a monthly draw of 250-270 mb/d. The IEA only ’measured’ a draw in global observable stocks of 117 mb in April with oil on water rising 53 mb while on shore stocks fell 170 mb. But global stocks are hard to measure with large invisible, unmeasured stocks. As such a back of the envelope approach may be better.
Oil products is what the world is consuming. Oil product prices likely to rise while product stocks fall. Strategic Petroleum Reserves (SPR) are predominantly crude oil. Discharging oil from OECD SPR stocks, a sharp reduction in Chinese crude imports and a reduction in global refinery throughput of 6-7 mb/d has helped to keep crude oil markets satisfactorily supplied. But global inventories are drawing down none the less. And oil products is really what the world is consuming. So if global refinery throughput stays subdued, then demand will eventually have to match the supply of oil products. The likely path forward this summer is a steady draw down in jet fuel, diesel and gasoline. Higher prices for these. Then, if possible, higher refinery throughput and higher usage of crude in response to very profitable refinery margins. And lastly sharper draw in crude stocks and higher prices for these. But some 6 mb/d of oil products used to be exported through the Strait of Hormuz. And it may not be so easy to ramp up refinery activity across the world to compensate. Especially as Ukraine continues to damage Russian refineries as well as Russian crude production and export facilities.
Watch oil product stocks and prices as well as Brent calendar 2027. What to watch for this summer is thus oil product inventories falling and oil product premiums to crude rising. Another measure to watch is the Brent crude 2027 contract as it rises steadily day by day as the Strait of Hormuz stays closed and global oil inventories decline. The latter is close to the highest level since the start of the war and keeps rising.
The Brent M1 contract and the Brent 2027 prices and current price of jet fuel in Europe (ARA). All in USD/b

Our back of the envelope calculation of the global shortage created by the closure of the Strait of Hormuz. Note that 3.5 mb/d of discharge from SPR is also a draw. Note also that ’Forced demand loss’ of 2.5 mb/d is probably temporary and will fall back towards zero as logistics are sorted out leaving ’Price demand loss’ to do the job of balancing the market. Thus a shortfall of at least 9 mb/d created by the closure. More if SPR discharge is included and more if Forced demand loss recedes.

Brent is climbing higher. Front-month is at USD 106.3/bl this morning, close to a weekly high and a USD 9/bl jump from Mondays open. This is the move we flagged as a risk earlier in the week: the market shifting from ”a deal is around the corner” to ”this is going to take longer than we thought”.

Analyst Commodities, SEB
During April, rest-of-year Brent remained remarkably stable around USD 90/bl. A stability which rested on one single assumption: the SoH reopens around 1 May. That assumption is now slowly falling apart.
As we highlighted yesterday: every week of delay beyond 1 May adds (theoretically) ish USD 5/bl to the rest-of-year average, as global inventories draw 100 million barrels per week. i.e., a mid-May reopening implies rest-of-year Brent closer to USD 100/bl, and anything pushing into June or July takes us meaningfully higher.
What’s changed in the last 48 hours:
#1: The US military has formally warned that clearing suspected sea mines from SoH could take up to six months. That is a completely different timescale from what the financial market is pricing. Even a political deal tomorrow does not immediately reopen the strait.
#2: Trump has shifted his tone from urgency to ”strategic patience”. In yesterday’s press conference: ”Don’t rush me… I want a great deal.” The market is reading this as a president no longer feeling pressured by timelines, with the naval blockade running in the background.
#3: So far, the military activity is escalating, not de-escalating. Axios reports Iran is laying more mines in SoH. The US 3rd carrier strike group (USS George H.W. Bush) is arriving with two countermine vessels. Trump yesterday ordered the US Navy to destroy any Iranian boats caught laying mines. While CNN reports that the Pentagon is actively drawing up plans to strike Iranian SoH capabilities and individual Iranian military leaders if the ceasefire collapses. i.e., NOT a attitude consistent with an imminent deal!
Spot crude and product prices eased off the early-April highs on a combination of system rerouting and deal optimism. Both now weakening. Goldman estimates April Gulf output is reduced by 14.5 mbl/d, or 57% of pre-war supply, a number that keeps getting worse the longer this drags on.
Demand-side adaptation is ongoing: S. Korea has cut its Middle East crude dependence from 69% to 56% by pulling more from the Americas and Africa, and Japan is kicking off a second round of SPR releases from 1 May. But SPRs are finite.
Ref. to the negotiations, we should not bet on speed. The current Iranian leadership is dominated by genuine hardliners willing to absorb economic pain and run the clock to extract concessions. That is not a setup for a rapid resolution. US/Israeli media briefings keep framing the delay as ”internal Iranian divisions”, the reality is more complicated and points toward weeks and months, not days.
Our point is that the complexity is large, and higher prices have only just started (given a scenario where the negotiations drag out in time). The market spent April leaning on the USD 90/bl rest-of-year assumption; that case is diminishing by the hour. If ”early May reopening” is replaced by ”June, July or later” over the next week or two, both crude and products have meaningful room to reprice higher from here. There is a high risk being short energy and betting on any immediate political resolution(!).
Down on Friday. Up on Monday. The Brent June crude oil contract traded down 5.1% last week to a close of $90.38/b. It reached a high of $103.87/b last Monday and a low of $86.09/b on Friday as Iran announced that the Strait of Hormuz was fully open for transit. That quickly changed over the weekend as the US upheld its blockade of Iranian oil exports while Iran naturally responded by closing the SoH again. The US blew a hole in the engine room of the Iranian ship TOUSKA and took custody of the ship on Sunday. Brent crude is up 5.6% this morning to $95.4/b.
The cease-fire is expiring tomorrow. The US has said it will send a delegation for a second round of negotiations in Islamabad in Pakistan. But Iran has for now rejected a second round of talks as it views US demands as unrealistic and excessive while the US is also blocking the Strait of Hormuz.
While Brent is up 5% this morning, the financial market is still very optimistic that progress will be made. That talks will continue and that the SoH will fully open by the start of May which is consistent with a rest-of-year average Brent crude oil price of around $90/b with the market now trading that balance at around $88/b.
Financial optimism vs. physical deterioration. We have a divergence where the financial market is trading negotiations, improvements and resolution while at the same time the physical market is deteriorating day by day. Physical oil flows remain constrained by disrupted flows, longer voyage times and elevated freight and insurance costs.
Financial markets are betting that a US/Iranian resolution will save us in time from violent shortages down the road. But every day that the SoH remains closed is bringing us closer to a potentially very painful point of shortages and much higher prices.
The US blockade is also a weapon of leverage against its European and Asian allies. When Iran closed the SoH it held the world economy as a hostage against the US. The US blockade of the SoH is of course blocking Iranian oil exports. But it is also an action of disruption directed towards Europe and Asia. The US has called for the rest of the world to engaged in the war with Iran: ”If you want oil from the Persian Gulf, then go and get it”. A risk is that the US plays brinkmanship with the global oil market directed towards its European and Asian allies and maybe even towards China to force them to engage and take part. Maybe unthinkable. But unthinkable has become the norm with Trump in the White House.


Sommarväder skapar prisrally på elbörsen
Oil product price pain is set to rise as the Strait of Hormuz stays closed into summer

Solkraften pressar elpriserna dagtid

Michel Gubel ger sin syn på oljemarknaden