

Analys
Råvarudeskens Årskrönika 2013

 ”Tailrisk-tapering-flattening”
Året då stimulanserna tog slut
 Under 2012 var ”tailrisk” modeordet som sammanfattade alla händelser av låg sannolikhet som skulle få stor inverkan om de inträffade. För råvarumarknaden var den mest uppenbara tailrisken konflikten mellan Israel och Iran. På makroplanet var riskerna kring EMU-zonen och USA:s konjunkturåterhämtning mest alarmerande tillsammans med Kinas inbromsning.
För att tysta Janne Korp* blandade USA, Kina och Europa ihop en trolldryck som hette duga. QE3 och Kinas sista egentliga stimulansinvesteringar kom under sensommaren 2012, medan 2013 har i mångt och mycket präglats av att stimulansfloden torkat upp. För USA:s del har episoden gått under namnet ”tapering” som också blev årets modeord. Bernankes ordlek kring när och hur tapering skulle uppstå har styrt marknadsrörelserna för att slutligen anlända som en vältimad julklapp i december. I Öst har de nytillträdda (inte nyvalda!) kinesiska ledarnas dito kommunikation kring tillväxtmålet som sänktes till 7,5 % och stimulansinvesteringar som nu skulle stabilisera och inte accelerera tillväxten haft minst lika stor påverkan på råvarupriserna.
Inget råvarurally
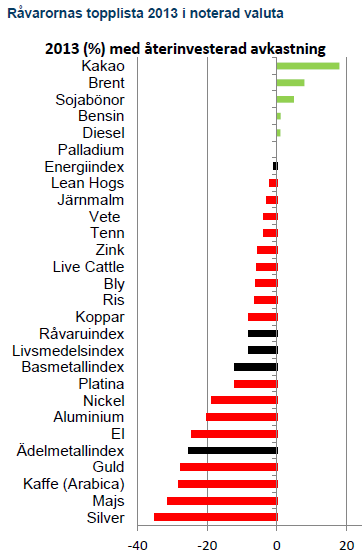
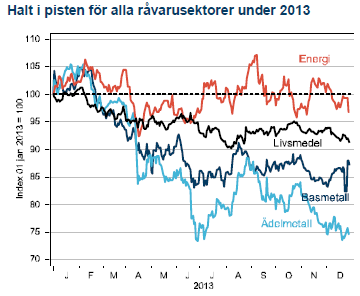 Fjolårets årskrönika titulerades ”Triskaidekafobia” – en grekisk ordlek med rädslan för den då stundande siffran 13. Otursnumret förde också ner råvarupriserna med besked. Vårt råvaruindex med 15 stycken råvaror tappade 8 % under året. Ingen av råvarusektorerna har stigit i värde. Energikorgen slutar precis under nollan på -1 % medan basmetaller, ädelmetaller och jordbruk föll med 12 %, 25 % och 8 %. Precis som i fjol ligger en jordbruksråvara i topp och på 2 av 3 bottenplatser. En tydlig erinran om vädergudens bidrag till volatiliteten i råvarupriserna. På samma tema finns majs och vete som fallit tillbaka efter fjolårets uppgång efter torkan i USA. Basmetallerna har dämpats efter att mycket av de högt ställda förväntningarna på produktionsökningar kommit till stånd. Ädelmetallerna har dock fallit mest, i egenskap av primär måltavla för årets modenyck – tapering.
Fallande priser har fått investerare att vikta ner råvaror medan våra industriella kunder utnyttjat de låga priserna på metaller för att säkra sina behov långt ut på kurvan. Elintensiva bolag kunde låsa in elpriset på 29,5öre/kWh 5 år framöver, vilket är det lägsta pris vi haft sedan 2005. Många lyckosamma jordbrukare sålde vete i grevens tid i början av året, innan den globala skörden på allvar fick priserna på fall.
* olyckskorpen i Fablernas värld, producerad 1968-1992
Guldet mitt i skottgluggen
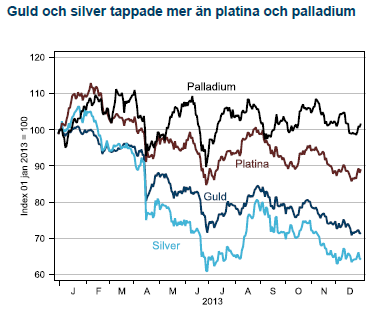 Året började med en stark förbättring av konjunkturutsikterna när USA undvek en skarp inbromsning efter det fiskala stupet och riskerna för att Euron skulle brytas upp minskade. I kölvattnet av denna starka start ökade investerares riskaptit och både guld och silver såldes till fördel för aktier. När sedan den oortodoxa penningpolitiken åter skulle börja tvingas in ramen för ortodox politik hamnade guld och silver mitt i skottgluggen. Utflödena ur guld-ETF:er var lavinartade och guld har under 2013 tappat 28 %, det största raset på 30 år. Investerare har allt sedan Fed:s QE1-start 2008 köpt guld och silver som hedge mot det kommande inflationsspöket. Spöket kom visserligen men snarare under namnet deflationsspöke (USA+EMU) och när nu Feds stimulanser avtar finner många guldgrävare det smärtsamma slutet på epoken för ”råvaran som inte kan gå ned”. När 2014 ser ut att bli ett säkrare år för världskonjunkturen, eurozonen fortfarande är intakt och Iran har kommit till förhandlingsbordet tror vi att guldet fortsätter ner och investerare som vill ha en icke centralbanksknuten valuta väljer Bitcoins (!).
Gruvbolagen försöker vända skutan
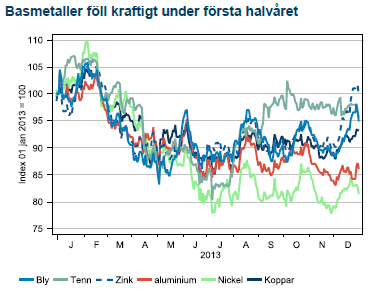 Även utanför Sverige har gruvindustrin känt på prövningar under året som gått. I de tre stora gruvbolagen listade i London (Rio, BHP och Anglo America) har VD:n fått betala med sitt jobb när kostnadsstrukturen totalt missmatchat Kinas inbromsning och de lägre metallpriserna. Efterträdarna har målat upp bolagsstrategi i klassisk svångremsanda. Trendmässigt kan det vara ett tecken på att de senaste årens produktionsvåg huvudsakligen är över och för 2014 ser marknaden mer balanserad ut. Undantaget är järnmalm och koppar där en ny våg kommer under 2014.
Nedgången för basmetaller kom under första halvåret då Kinas inbromsning verkade ske helt okontrollerat. När Kinas nya ledare började stimulera för att stabilisera ekonomin stabiliserades också basmetallerna. Ett rally under december avslutade året klart över bottenkänningen kring midsommar.
Brent blev årets skidbacke
 Under buller och bång har USA:s oljeproduktion stigit till 25 års högsta. På mindre än tre år har världens största oljekonsument vänt 40 år av fallande oljeproduktion till den största överraskningen i oljehistorien. Glädjande för oljepropagandamaskineriets fader, Obama, var också att under 2014 kommer importen för första gången på 20 år att vara lägre än produktionen. Denna utbudschock till trots har Brentoljan handlats i backwardation under hela året. USA:s stigande produktion har ganska precist kompenserats av den sammanlagda exportminskningen ifrån Iran, Libyen, Irak och Nigeria. De eviga produktionsstörningarna i områden med inverkan på Brentpriset (FOB Shetlandsöarna) har lett till en kraftig kurvlutning som gett investerare 12 % trots att Brent bara stigit med 6 %. USA-handlade WTI oljan har med stigande produktion istället legat i contango och givit dyr rullning för råvaruindex med WTI som underliggande oljetillgång.
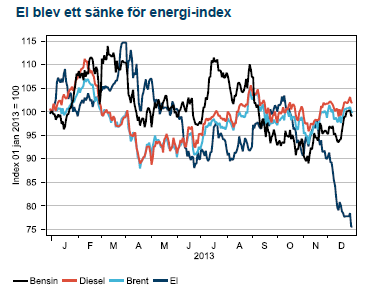
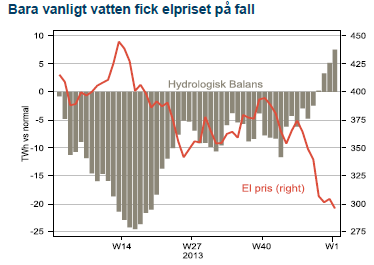 Råolja och oljeprodukterna bensin och diesel slutar året svagt i dur medan el blev årets besvikelse och föll hämningslöst under årets sista kvartal. En mild början på vintern (trots alla granna rönnbärsträd i oktober), en snabb påfyllning av vattenmagasinen från ett underskott till normalnivå och en sällsynt välfungerande svensk kärnkraft utgjorde mixen bakom prisraset i el.
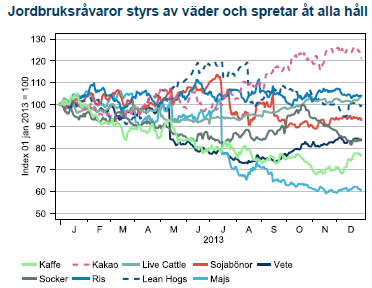
Torkan över för den här gången
Årets stora rörelse var återhämtningen i produktion av majs efter torkan i USA 2012. Priset föll som en sten och placerade majs i botten av all råvaror 2013. Vinnaren bland livsmedelsråvarorna blev kakao som fortsätter sin långa, efterfrågedrivna trend uppåt. Utsikterna för stigande kakaopriser är fortfarande goda och lämnar en bitter eftersmak för chokladälskare.
Nu börjar hästens år
 Hästens år är sjunde året i den kinesiska zodiakens cykel om 12 år. Hästen står för det ädla och eleganta men också för snabbhet och uthållighet. Frågan är om den kinesiska ekonomin likaledes kommer uppvisa snabbhet och uthållighet under 2014? Troligen kommer den kinesiska ekonomin att hålla styrfart (>7 %) men uppsidan begränsas hela tiden av reformbehoven som ständigt aktualiseras när saker och ting ser ljusare ut. USA ska enligt Fed nu klara sig utan stimulanser medan Europa tragglar vidare precis norr om recession (1 %). Budskapet är tydligt; vi tror att ”flattening” kommer bli årets modeord 2014.


Some rebound but not much. Brent crude rebounded 1.5% yesterday to $65.47/b. This morning it is inching 0.2% up to $65.6/b. The lowest close last week was on Thursday at $64.11/b.

The curve structure is almost as week as it was before the weekend. The rebound we now have gotten post the message from OPEC+ over the weekend is to a large degree a rebound along the curve rather than much strengthening at the front-end of the curve. That part of the curve structure is almost as weak as it was last Thursday.
We are still on a weakening path. The message from OPEC+ over the weekend was we are still on a weakening path with rising supply from the group. It is just not as rapidly weakening as was feared ahead of the weekend when a quota hike of 500 kb/d/mth for November was discussed.
The Brent curve is on its way to full contango with Brent dipping into the $50ies/b. Thus the ongoing weakening we have had in the crude curve since the start of the year, and especially since early June, will continue until the Brent crude oil forward curve is in full contango along with visibly rising US and OECD oil inventories. The front-month Brent contract will then flip down towards the $60/b-line and below into the $50ies/b.
At what point will OPEC+ turn to cuts? The big question then becomes: When will OPEC+ turn around to make some cuts? At what (price) point will they choose to stabilize the market? Because for sure they will. Higher oil inventories, some more shedding of drilling rigs in US shale and Brent into the 50ies somewhere is probably where the group will step in.
There is nothing we have seen from the group so far which indicates that they will close their eyes, let the world drown in oil and the oil price crash to $40/b or below.
The message from OPEC+ is also about balance and stability. The world won’t drown in oil in 2026. The message from the group as far as we manage to interpret it is twofold: 1) Taking back market share which requires a lower price for non-OPEC+ to back off a bit, and 2) Oil market stability and balance. It is not just about 1. Thus fretting about how we are all going to drown in oil in 2026 is totally off the mark by just focusing on point 1.
When to buy cal 2026? Before Christmas when Brent hits $55/b and before OPEC+ holds its last meeting of the year which is likely to be in early December.
Brent crude oil prices have rebounded a bit along the forward curve. Not much strengthening in the structure of the curve. The front-end backwardation is not much stronger today than on its weakest level so far this year which was on Thursday last week.

The front-end backwardation fell to its weakest level so far this year on Thursday last week. A slight pickup yesterday and today, but still very close to the weakest year to date. More oil from OPEC+ in the coming months and softer demand and rising inventories. We are heading for yet softer levels.

Down to the lowest since early May. Brent crude has fallen sharply the latest four days. It closed at USD 64.11/b yesterday which is the lowest since early May. It is staging a 1.3% rebound this morning along with gains in both equities and industrial metals with an added touch of support from a softer USD on top.
What stands out the most to us this week is the collapse in the Dubai one to three months time-spread.
Dubai is medium sour crude. OPEC+ is in general medium sour crude production. Asian refineries are predominantly designed to process medium sour crude. So Dubai is the real measure of the balance between OPEC+ holding back or not versus Asian oil demand for consumption and stock building.
A sharp weakening of the front-end of the Dubai curve. The front-end of the Dubai crude curve has been holding out very solidly throughout this summer while the front-end of the Brent and WTI curves have been steadily softening. But the strength in the Dubai curve in our view was carrying the crude oil market in general. A source of strength in the crude oil market. The core of the strength.
The now finally sharp decline of the front-end of the Dubai crude curve is thus a strong shift. Weakness in the Dubai crude marker is weakness in the core of the oil market. The core which has helped to hold the oil market elevated.
Facts supports the weakening. Add in facts of Iraq lifting production from Kurdistan through Turkey. Saudi Arabia lifting production to 10 mb/d in September (normal production level) and lifting exports as well as domestic demand for oil for power for air con is fading along with summer heat. Add also in counter seasonal rise in US crude and product stocks last week. US oil stocks usually decline by 1.3 mb/week this time of year. Last week they instead rose 6.4 mb/week (+7.2 mb if including SPR). Total US commercial oil stocks are now only 2.1 mb below the 2015-19 seasonal average. US oil stocks normally decline from now to Christmas. If they instead continue to rise, then it will be strongly counter seasonal rise and will create a very strong bearish pressure on oil prices.
Will OPEC+ lift its voluntary quotas by zero, 137 kb/d, 500 kb/d or 1.5 mb/d? On Sunday of course OPEC+ will decide on how much to unwind of the remaining 1.5 mb/d of voluntary quotas for November. Will it be 137 kb/d yet again as for October? Will it be 500 kb/d as was talked about earlier this week? Or will it be a full unwind in one go of 1.5 mb/d? We think most likely now it will be at least 500 kb/d and possibly a full unwind. We discussed this in a not earlier this week: ”500 kb/d of voluntary quotas in October. But a full unwind of 1.5 mb/d”
The strength in the front-end of the Dubai curve held out through summer while Brent and WTI curve structures weakened steadily. That core strength helped to keep flat crude oil prices elevated close to the 70-line. Now also the Dubai curve has given in.

Brent crude oil forward curves

Total US commercial stocks now close to normal. Counter seasonal rise last week. Rest of year?

Total US crude and product stocks on a steady trend higher.

Analys
OPEC+ will likely unwind 500 kb/d of voluntary quotas in October. But a full unwind of 1.5 mb/d in one go could be in the cards
Down to mid-60ies as Iraq lifts production while Saudi may be tired of voluntary cut frugality. The Brent December contract dropped 1.6% yesterday to USD 66.03/b. This morning it is down another 0.3% to USD 65.8/b. The drop in the price came on the back of the combined news that Iraq has resumed 190 kb/d of production in Kurdistan with exports through Turkey while OPEC+ delegates send signals that the group will unwind the remaining 1.65 mb/d (less the 137 kb/d in October) of voluntary cuts at a pace of 500 kb/d per month pace.
Signals of accelerated unwind and Iraqi increase may be connected. Russia, Kazakhstan and Iraq were main offenders versus the voluntary quotas they had agreed to follow. Russia had a production ’debt’ (cumulative overproduction versus quota) of close to 90 mb in March this year while Kazakhstan had a ’debt’ of about 60 mb and the same for Iraq. This apparently made Saudi Arabia angry this spring. Why should Saudi Arabia hold back if the other voluntary cutters were just freeriding? Thus the sudden rapid unwinding of voluntary cuts. That is at least one angle of explanations for the accelerated unwinding.
If the offenders with production debts then refrained from lifting production as the voluntary cuts were rapidly unwinded, then they could ’pay back’ their ’debts’ as they would under-produce versus the new and steadily higher quotas.
Forget about Kazakhstan. Its production was just too far above the quotas with no hope that the country would hold back production due to cross-ownership of oil assets by international oil companies. But Russia and Iraq should be able to do it.
Iraqi cumulative overproduction versus quotas could reach 85-90 mb in October. Iraq has however steadily continued to overproduce by 3-5 mb per month. In July its new and gradually higher quota came close to equal with a cumulative overproduction of only 0.6 mb that month. In August again however its production had an overshoot of 100 kb/d or 3.1 mb for the month. Its cumulative production debt had then risen to close to 80 mb. We don’t know for September yet. But looking at October we now know that its production will likely average close to 4.5 mb/d due to the revival of 190 kb/d of production in Kurdistan. Its quota however will only be 4.24 mb/d. Its overproduction in October will thus likely be around 250 kb/d above its quota with its production debt rising another 7-8 mb to a total of close to 90 mb.
Again, why should Saudi Arabia be frugal while Iraq is freeriding. Better to get rid of the voluntary quotas as quickly as possible and then start all over with clean sheets.
Unwinding the remaining 1.513 mb/d in one go in October? If OPEC+ unwinds the remaining 1.513 mb/d of voluntary cuts in one big go in October, then Iraq’s quota will be around 4.4 mb/d for October versus its likely production of close to 4.5 mb/d for the coming month..
OPEC+ should thus unwind the remaining 1.513 mb/d (1.65 – 0.137 mb/d) in one go for October in order for the quota of Iraq to be able to keep track with Iraq’s actual production increase.
October 5 will show how it plays out. But a quota unwind of at least 500 kb/d for Oct seems likely. An overall increase of at least 500 kb/d in the voluntary quota for October looks likely. But it could be the whole 1.513 mb/d in one go. If the increase in the quota is ’only’ 500 kb/d then Iraqi cumulative production will still rise by 5.7 mb to a total of 85 mb in October.
Iraqi production debt versus quotas will likely rise by 5.7 mb in October if OPEC+ only lifts the overall quota by 500 kb/d in October. Here assuming historical production debt did not rise in September. That Iraq lifts its production by 190 kb/d in October to 4.47 mb/d (August level + 190 kb/d) and that OPEC+ unwinds 500 kb/d of the remining quotas in October when they decide on this on 5 October.


Silver spränger den magiska gränsen, kostar nu över 50 USD per uns

Blykalla, Evroc och Studsvik vill bygga kärnkraftsdrivna datacenter i Sverige

Toppmöte om framtidens kärnkraft runt Östersjön hölls idag

Nytt prisrekord, guld stiger över 4000 USD

Goldman Sachs höjer prognosen för guld, tror priset når 4900 USD

Mahvie Minerals i en guldtrend
Volatile but going nowhere. Brent crude circles USD 66 as market weighs surplus vs risk

Aktier i guldbolag laggar priset på guld

Kinas elproduktion slog nytt rekord i augusti, vilket även kolkraft gjorde

Tyskland har så höga elpriser att företag inte har råd att använda elektricitet
-
 Nyheter4 veckor sedan
Mahvie Minerals i en guldtrend
-
Analys4 veckor sedan
Volatile but going nowhere. Brent crude circles USD 66 as market weighs surplus vs risk
-
 Nyheter4 veckor sedan
Aktier i guldbolag laggar priset på guld
-
 Nyheter4 veckor sedan
Kinas elproduktion slog nytt rekord i augusti, vilket även kolkraft gjorde
-
Nyheter3 veckor sedan
Tyskland har så höga elpriser att företag inte har råd att använda elektricitet
-

 Nyheter4 veckor sedan
Guld når sin högsta nivå någonsin, nu även justerat för inflation
-

 Nyheter4 veckor sedan
Det stigande guldpriset en utmaning för smyckesköpare
-
Analys4 veckor sedan
Waiting for the surplus while we worry about Israel and Qatar