

Analys
The last hurrah from Vienna

![]() We see a close to 100% probability of an extension of oil production cuts from OPEC at the upcoming OPEC meeting in Vienna on May 25. For H2 2017, we see compliance with proposed cuts as a much more difficult issue than the deal itself. We think there is a 95% probability that Russia will sign on for a new six-month production cut period, but we see only a 30% probability that Russia will keep compliance for that period. Oil cuts during H2 2017 will come at a high cost due to seasonally higher production. We believe the next big price turn will come from non-compliance from Russia in particular but also other OPEC countries, as growing US production shows evidence of the futility of subsidising growth there by keeping production off stream. Saudi Arabia seems assured that production cuts at any price are the right way to go; it seems to us that the longer OPEC tries to keep production down, the more such measures backfire.
We see a close to 100% probability of an extension of oil production cuts from OPEC at the upcoming OPEC meeting in Vienna on May 25. For H2 2017, we see compliance with proposed cuts as a much more difficult issue than the deal itself. We think there is a 95% probability that Russia will sign on for a new six-month production cut period, but we see only a 30% probability that Russia will keep compliance for that period. Oil cuts during H2 2017 will come at a high cost due to seasonally higher production. We believe the next big price turn will come from non-compliance from Russia in particular but also other OPEC countries, as growing US production shows evidence of the futility of subsidising growth there by keeping production off stream. Saudi Arabia seems assured that production cuts at any price are the right way to go; it seems to us that the longer OPEC tries to keep production down, the more such measures backfire.
Core OPEC members give a good lead
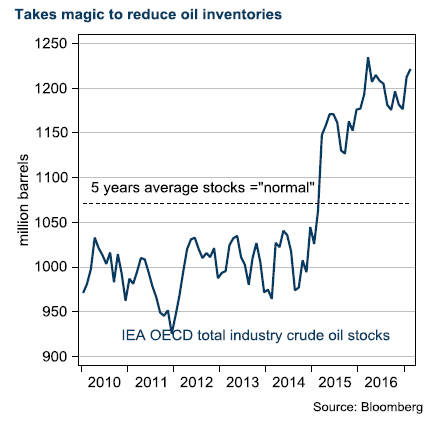 The OPEC and several other key producers including Russia have agreed to cut production by 1.8 million bbl/d for H1 2017 to reduce global glut, formally defined as retreating global stocks to normal levels, i.e. the five-year average. It is increasingly clear that the target will not be reached after the first six months of this year. Saudi Arabian oil minister Al-Falih opened up initially for an extension for H2 2017, and last week for nine months, including Q1 2018. Other core OPEC members have gradually confirmed the extension as well. We assume a Brent crude price of USD 50 fully reflects a six-month extension of OPEC production cuts.
Saudi Arabia supports extension
It has become obvious that Deputy Crown Prince Mohammed bin Salman, who has emerged as Saudi Arabia’s leading economic force, was the architect behind the Saudis’ policy U-turn in Doha, leading up to the cut at the official meeting in Vienna in November 2016. In our view, this was confirmed by the shuffle of the Kingdom’s oil minister, replacing Ali al-Naimi after two decades. If this were a game of chess, we would view this as a rokade.
Prince Mohammed has designated divesting Armaco at the top of his agenda, and that forms the basis of the Saudis’ policy and willingness to cut production in compensation for a short-term higher oil price.
Costly mistake
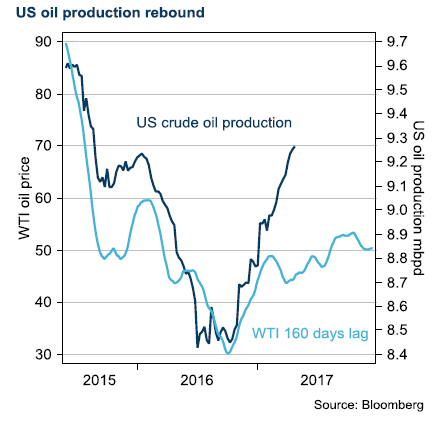 The savvy players recognise the danger of taking real action in cutting production. History is repeating itself. Higher prices have reversed the US production drop, extending the time it takes for the market to balance, and pushing the volume share away from OPEC and toward two non-cut participants, the US and lately also Libya.
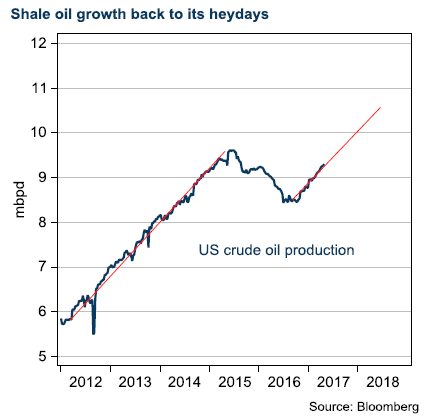
We strongly argue it was too early for OPEC to take action. The rebalancing process had another year, perhaps two, before running its course. If OPEC had waited, a number of bankruptcies in the US energy sector would have played out, and some banks would have lost their faith in energy lending for a long time. Instead, US shale oil is growing at the same rate as it did before the 2014 oil slump and production is now higher than in 2014, which was about the time that OPEC initiated its strategy aimed at knocking off higher costs by flooding the market. Costs are dynamic, however, and the low-price era has pushed breakeven levels lower and provided a solid platform for future growth.
 Russia: biggest loser in extension deal
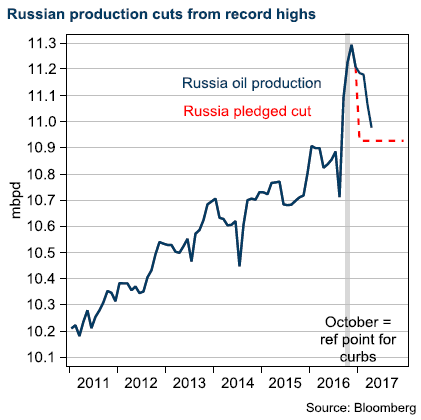
We base our strong opinion of a low 30% chance of an implemented cut during the second half on Russia’s seasonal oil production pattern. Russia has shown its usual low interest in active cuts, and takes its cut from a very high October 2016 production as a reference point for the curbs. Russia has cut about 250,000 bbl/d from its pledge of a 300,000 bbl/d cut, but production is still 1.6% higher than in 2016 and export are 2.14% higher than in March 2016. The first quarter is seasonally weak in Russian crude production, while the second half is stronger, and cuts in the seasonal peak require a strong commitment. We doubt that Russia will turn down additional market share for the sake of Saudi Arabia’s Aramco divestment.
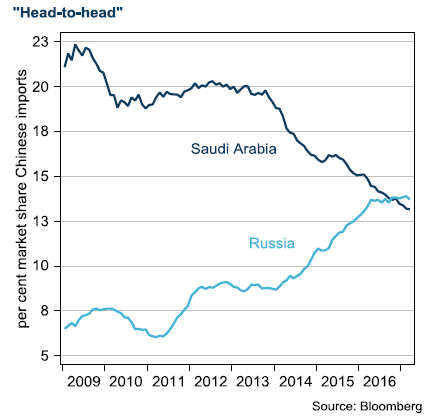
Russia has another reason to be careful in long-term cooperation with the Saudis. Russia has been successful in grabbing market share in China, the only oil consumer growing at any significant pace. This is not the right time to give up footprint anywhere, as competition will increase in all markets ahead.
“Everything is fine”
With little chance of action from Vienna on May 25, we think eroding compliance will set the tone after the May meeting. The oil price will likely hover at around USD 40/bbl when the agreement on production cuts vanishes, and an extension of production cuts will not come into question at the second OPEC meeting this year in November-December.
Research disclaimer
Risk warning
All investments involve risks and investors are encouraged to make their own decision as to the appropriateness of an investment in any securities referred to in this report, based on their specific investment objectives, financial status and risk tolerance. The historical return of a financial instrument is not a guarantee of future return. The value of financial instruments can rise or fall, and it is not certain that you will get back all the capital you have invested.
Research disclaimers
Handelsbanken Capital Markets, a division of Svenska Handelsbanken AB (publ) (collectively referred to herein as ‘SHB’), is responsible for the preparation of research reports. SHB is regulated in Sweden by the Swedish Financial Supervisory Authority, in Norway by the Financial Supervisory Authority of Norway, in Finland by the Financial Supervisory Authority and in Denmark by the Danish Financial Supervisory Authority. All research reports are prepared from trade and statistical services and other information that SHB considers to be reliable. SHB has not independently verified such information and does not represent that such information is true, accurate or complete. Accordingly, to the extent permitted by law, neither SHB, nor any of its directors, officers or employees, nor any other person, accept any liability whatsoever for any loss, however it arises, from any use of such research reports or its contents or otherwise arising in connection therewith.
In no event will SHB or any of its affiliates, their officers, directors or employees be liable to any person for any direct, indirect, special or consequential damages arising out of any use of the information contained in the research reports, including without limitation any lost profits even if SHB is expressly advised of the possibility or likelihood of such damages.
The views contained in SHB research reports are the opinions of employees of SHB and its affiliates and accurately reflect the personal views of the respective analysts at this date and are subject to change. There can be no assurance that future events will be consistent with any such opinions. Each analyst identified in this research report also certifies that the opinions expressed herein and attributed to such analyst accurately reflect his or her individual views about the companies or securities discussed in the research report.
Research reports are prepared by SHB for information purposes only. The information in the research reports does not constitute a personal recommendation or personalised investment advice and such reports or opinions should not be the basis for making investment or strategic decisions. This document does not constitute or form part of any offer for sale or subscription of or solicitation of any offer to buy or subscribe for any securities nor shall it or any part of it form the basis of or be relied on in connection with any contract or commitment whatsoever. Past performance may not be repeated and should not be seen as an indication of future performance. The value of investments and the income from them may go down as well as up and investors may forfeit all principal originally invested. Investors are not guaranteed to make profits on investments and may lose money. Exchange rates may cause the value of overseas investments and the income arising from them to rise or fall. This research product will be updated on a regular basis.
No part of SHB research reports may be reproduced or distributed to any other person without the prior written consent of SHB. The distribution of this document in certain jurisdictions may be restricted by law and persons into whose possession this document comes should inform themselves about, and observe, any such restrictions.
The report does not cover any legal or tax-related aspects pertaining to any of the issuer’s planned or existing debt issuances.


Parts of the Brent crude curve dipping into the high $50ies/b. Brent crude fell 2.3% over the week to Friday. It closed the week at $61.29/b, a slight gain on the day, but also traded to a low of $60.14/b that same day and just barely avoided trading into the $50ies/b. This morning it is risk-on in equities which seems to help industrial metals a little higher. But no such luck for oil. It is down 0.8% at $60.8/b. This week looks set for Brent crude to dip its feet in the $50ies/b. The Brent 3mth contract actually traded into the high $50ies/b on Friday.

The front-end backwardation has been on a weakening foot and is now about to fully disappear. The lowest point of the crude oil curve has also moved steadily lower and lower and its discount to the 5yr contract is now $6.8/b. A solid contango. The Brent 3mth contract did actually dip into the $50ies/b intraday on Friday when it traded to a low point of $59.93/b.
More weakness to come as lots of oil at sea comes to ports. Mid-East OPEC countries have boosted exports along with lower post summer consumption and higher production. The result is highly visibly in oil at sea which increased by 17 mb to 1,311 mb over the week to Sunday. Up 185 mb since mid-August. On its way to discharge at a port somewhere over the coming month or two.
Don’t forget that the oil market path ahead is all down to OPEC+. Remember that what is playing out in the oil market now is all by design by OPEC+. The group has decided that the unwind of the voluntary cuts is what it wants to do. In a combination of meeting demand from consumers as well as taking back market share. But we need to remember that how this plays out going forward is all at the mercy of what OPEC+ decides to do. It will halt the unwinding at some point. It will revert to cuts instead of unwind at some point.
A few months with Brent at $55/b and 40-50 US shale oil rigs kicked out may be what is needed. We think OPEC+ needs to see the exit of another 40-50 drilling rigs in the US shale oil patches to set US shale oil production on a path to of a 1 mb/d year on year decline Dec-25 to Dec-26. We are not there yet. But a 2-3 months period with Brent crude averaging $55/b would probably do it.
Oil on water increased 17 mb over the week to Sunday while oil in transit increased by 23 mb. So less oil was standing still. More was moving.

Crude oil floating storage (stationary more than 7 days). Down 11 mb over week to Sunday

The lowest point of the Brent crude oil curve versus the 5yr contract. Weakest so far this year.

Crude oil 1mth to 3mth time-spreads. Dubai held out strongly through summer, but then that center of strength fell apart in late September and has been leading weakness in crude curves lower since then.

Rebounding along with most markets. But concerns over solidity of Gaza peace may also contribute. Brent crude fell 0.8% yesterday to $61.91/b and its lowest close since May this year. This morning it is bouncing up 0.9% to $62.5/b along with a softer USD amid positive sentiment with both equities and industrial metals moving higher. Concerns that the peace in Gaza may be less solid than what one might hope for also yields some support to Brent. Bets on tech stocks are rebounding, defying fears of trade war. Money moving back into markets. Gold continues upwards its strong trend and a softer dollar helps it higher today as well.
US crude & products probably rose 5.6 mb last week (API) versus a normal seasonal decline of 2.4 mb. The US API last night partial and thus indicative data for US oil inventories. Their data indicates that US crude stocks rose 7.4 mb last week, gasoline stocks rose 3.0 mb while Distillate stocks fell 4.8 mb. Altogether an increase in commercial crude and product stocks of 5.6 mb. Commercial US crude and product stocks normally decline by 2.4 mb this time of year. So seasonally adjusted the US inventories rose 8 mb last week according to the indicative numbers by the API. That is a lot. Also, the counter seasonal trend of rising stocks versus normally declining stocks this time of year looks on a solid pace of continuation. If the API is correct then total US crude and product stocks would stand 41 mb higher than one year ago and 6 mb higher than the 2015-19 average. And if we combine this with our knowledge of a sharp increase in production and exports by OPEC(+) and a large increase in oil at sea, then the current trend in US oil inventories looks set to continue. So higher stocks and lower crude oil prices until OPEC(+) switch to cuts. Actual US oil inventory data today at 18:00 CET.
US commercial crude and product stocks rising to 1293 mb in week 41 if last nights indicative numbers from API are correct.

Crude oil soon coming to a port near you. OPEC has lifted production sharply higher this autumn. At the same time demand for oil in the Middle-East has fallen as we have moved out of summer heat and crude oil burn for power for air-conditioning. The Middle-East oil producers have thus been able to lift exports higher on both accounts. Crude oil and condensates on water has shot up by 177 mb since mid-August. This oil is now on its way to ports around the world. And when they arrive, it will likely help to lift stocks onshore higher. That is probably when we will lose the last bit of front-end backwardation the the crude oil curves. That will help to drive the front-month Brent crude oil price down to the $60/b line and revisit the high $50ies/b. Then the eyes will be all back on OPEC+ when they meet in early November and then again in early December.
Crude oil and condensates at sea have moved straight up by 177 mb since mid-August as OPEC(+) has produced more, consumed less and exported more.

When it starts to move lower it moves rather quickly. Gaza, China, IEA. Brent crude is down 2.1% today to $62/b after having traded as high as $66.58/b last Thursday and above $70/b in late September. The sell-off follows the truce/peace in Gaze, a flareup in US-China trade and yet another bearish oil outlook from the IEA.
A lasting peace in Gaze could drive crude oil at sea to onshore stocks. A lasting peace in Gaza would probably calm down the Houthis and thus allow more normal shipments of crude oil to sail through the Suez Canal, the Red Sea and out through the Bab-el-Mandeb Strait. Crude oil at sea has risen from 48 mb in April to now 91 mb versus a pre-Covid normal of about 50-60 mb. The rise to 91 mb is probably the result of crude sailing around Africa to be shot to pieces by the Houthis. If sailings were to normalize through the Suez Canal, then it could free up some 40 mb in transit at sea moving onshore into stocks.
The US-China trade conflict is of course bearish for demand if it continues.
Bearish IEA yet again. Getting closer to 2026. Credibility rises. We expect OPEC to cut end of 2025. The bearish monthly report from the IEA is what it is, but the closer we get to 2026, the more likely the IEA is of being ball-park right in its outlook. In its monthly report today the IEA estimates that the need for crude oil from OPEC in 2026 will be 25.4 mb/d versus production by the group in September of 29.1 mb/d. The group thus needs to do some serious cutting at the end of 2025 if it wants to keep the market balanced and avoid inventories from skyrocketing. Given that IEA is correct that is. We do however expect OPEC to implement cuts to avoid a large increase in inventories in Q1-26. The group will probably revert to cuts either at its early December meeting when they discuss production for January or in early January when they discuss production for February. The oil price will likely head yet lower until the group reverts to cuts.
Dubai: The Mid-East anchor dragging crude oil lower. Surplus emerging in Mid-East pricing. Crude oil prices held surprisingly strong all through the summer. A sign and a key source of that strength came from the strength in the front-end backwardation of the Dubai crude oil curve. It held out strong from mid-June and all until late September with an average 1-3mth time-spread premium of $1.8/b from mid-June to end of September. The 1-3mth time-spreads for Brent and WTI however were in steady deterioration from late June while their flat prices probably were held up by the strength coming from the Persian Gulf. Then in late September the strength in the Dubai curve suddenly collapsed. Since the start of October it has been weaker than both the Brent and the WTI curves. The Dubai 1-3mth time-spread now only stands at $0.25/b. The Middle East is now exporting more as it is producing more and also consuming less following elevated summer crude burn for power (Aircon) etc.
The only bear-element missing is a sudden and solid rise in OECD stocks. The only thing that is missing for the bear-case everyone have been waiting for is a solid, visible rise in OECD stocks in general and US oil stocks specifically. So watch out for US API indications tomorrow and official US oil inventories on Thursday.
No sign of any kind of fire-sale of oil from Saudi Arabia yet. To what we can see, Saudi Arabia is not at all struggling to sell its oil. It only lowered its Official Selling Prices (OSPs) to Asia marginally for November. A surplus market + Saudi determination to sell its oil to the market would normally lead to a sharp lowering of Saudi OSPs to Asia. Not yet at least and not for November.
The 5yr contract close to fixed at $68/b. Of importance with respect to how far down oil can/will go. When the oil market moves into a surplus then the spot price starts to trade in a large discount to the 5yr contract. Typically $10-15/b below the 5yr contract on average in bear-years (2009, 2015, 2016, 2020). But the 5yr contract is usually pulled lower as well thus making this approach a moving target. But the 5yr contract price has now been rock solidly been pegged to $68/b since 2022. And in the 2022 bull-year (Brent spot average $99/b), the 5yr contract only went to $72/b on average. If we assume that the same goes for the downside and that 2026 is a bear-year then the 5yr goes to $64/b while the spot is trading at a $10-15/b discount to that. That would imply an average spot price next year of $49-54/b. But that is if OPEC doesn’t revert to cuts and instead keeps production flowing. We think OPEC(+) will trim/cut production as needed into 2026 to prevent a huge build-up in global oil stocks and a crash in prices. But for now we are still heading lower. Into the $50ies/b.


Brent crude set to dip its feet into the high $50ies/b this week

Vad guldets uppgång egentligen betyder för världen

Spotpriset på guld över 4300 USD och silver över 54 USD
Crude oil soon coming to a port near you

Guld och silver stiger hela tiden mot nya höjder

OPEC+ missar produktionsmål, stöder oljepriserna

Ett samtal om guld, olja, fjärrvärme och förnybar energi

Goldman Sachs höjer prognosen för guld, tror priset når 4900 USD
Guld nära 4000 USD och silver 50 USD, därför kan de fortsätta stiga

Blykalla och amerikanska Oklo inleder ett samarbete
-
 Nyheter3 veckor sedan
OPEC+ missar produktionsmål, stöder oljepriserna
-
 Nyheter4 veckor sedan
Ett samtal om guld, olja, fjärrvärme och förnybar energi
-
 Nyheter2 veckor sedan
Goldman Sachs höjer prognosen för guld, tror priset når 4900 USD
-
 Nyheter3 veckor sedan
Guld nära 4000 USD och silver 50 USD, därför kan de fortsätta stiga
-
 Nyheter3 veckor sedan
Blykalla och amerikanska Oklo inleder ett samarbete
-
Analys4 veckor sedan
Are Ukraine’s attacks on Russian energy infrastructure working?
-

 Nyheter4 veckor sedan
Guldpriset uppe på nya höjder, nu 3750 USD
-
Nyheter3 veckor sedan
Ett samtal om guld, olja, koppar och stål