

Analys
Gold outlook: flat for the year

 Summary
Our base-case fair-value for gold is broadly flat over the coming year, as support from rising inflation will counter the downward pressure from rising interest rates.
Despite policy interest rates rising in 2017, the US Dollar has depreciated and US Treasury yields have declined. We expect these paradoxical trends to abate in 2018.
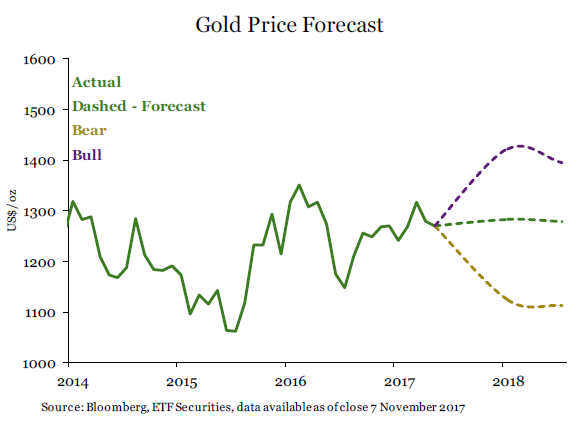 Most of the variation in gold price in our bull and bear cases (compared to our base case) comes from assumptions around investor positioning. Many measures of market volatility are currently subdued. However, several risks – both political and financial – exist. Sentiment towards gold could shift significantly depending on which of these views dominate market psyche.
US Federal Reserve to continue tightening
We believe that in addition to the fully-priced-in December 2017 hike, the US central bank will follow through with three further rate hikes in 2018. That comes on top of the balancesheet run-off that the Fed has already announced. Although some market participants think that under a new Chair, the Fed will become more dovish, we believe the central bank will remain data-dependent and trained staff economists’ analysis will become more influential in the Board’s decision making. In light of strengthening domestic demand and a tight labour market, the inflationary potential will be hard to ignore.
Inflation to gain momentum
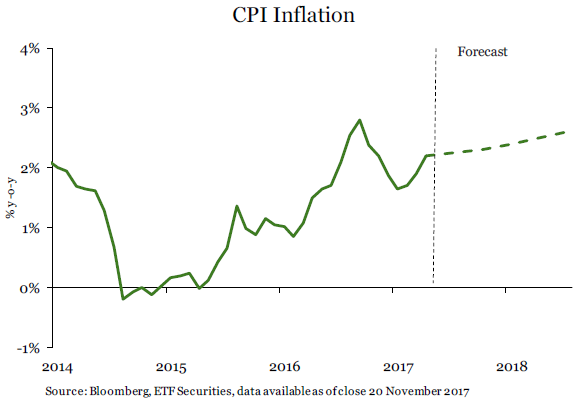 Inflation has been subdued in 2017, despite so many signs of cyclical strength, but a large number of idiosyncratic factors account for this apparent weakness in price movements. Dominant wireless phone service providers changing pricing; solar eclipse changing the timing of hotel stays; severe hurricane disruptions; budget airlines opening new routes are some of the idiosyncratic factors that are unlikely to be repeated. Also the calculation of owner occupied equivalent rent has caused some distortions in the inflation numbers as it is sensitive to energy prices. With volatility in energy prices having fallen, we expect these distortions to subside. The unemployment rate is at its lowest in 16 years and a healthy number of jobs are being added every month (notwithstanding hurricane disruptions). The strength in the labour market is now likely to show up in inflation as per its traditional relationship2.
We expect US inflation to rise to 2.4% in June 2018 and 2.6% by December 2018 (from 2.2% in September 2017). These levels will likely be uncomfortably high for the Fed, but given the lags in policy and price response, there is little the Fed can do next year to stop it (the inflationary pressure has been built up this year). However, we believe three rate hikes in 2018 will be required to keep inflation expectations sufficiently anchored.
US Treasury yields
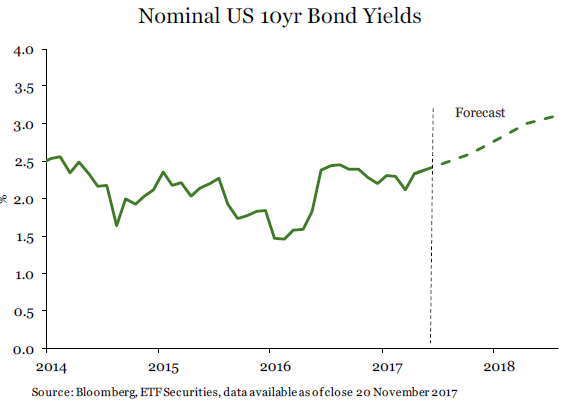 During the rate tightening that has taken place in 2017, the US Treasury yield curve has flattened. While there have been 75bps of policy rate increases since December 2016, nominal 10-year Treasury yields have fallen from 2.60% to 2.34%. We don’t think that 10-year yields can continue to decline. We expect 10- year Treasury yields to rise to 3.1% by the end of 2018.
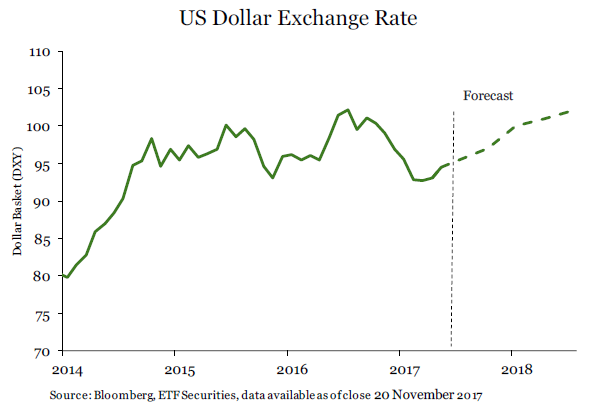
We expect the US Dollar to appreciate modestly (see FX Outlook 2018), reversing some of the weakness that we have seen in 2017. We expect the DXY (the trade weighted US dollar index) to appreciate to 102 by the end of 2018 from 94 currently. A lack of progress in implementing pro-growth policies that the Trump Administration had promised, a lack of tax and budget reform and a generally stronger Euro and Yen have weighed on the US Dollar in 2017. Some of these trends will continue to drag on dollar performance in 2018, but rising interest rates will lend some support. We believe that the policy divergence between the Federal Reserve, European Central Bank and Bank of Japan will become more pronounced as the market becomes increasingly disappointed by the pace of tapering by the latter two central banks. That will reverse some of the strength in the Euro and Yen.
Market sentiment
 We expect CFTC futures market positioning in gold to hover around 120k contracts net long, lower than current positioning (190k), but marginally higher than the long-term average positioning of around 90k contracts net long. Currently positioning is elevated due to investor fears around continued sabre-rattling between US/Japan and North Korea and some of the tensions in the Middle East. These concerns could fall away if new developments on these geopolitical issues do not resurface. We have observed that when such geopolitical issues simmer in the background, political risk-premia tends to dissipate from the price of gold. It requires keeping the issues at the forefront of market psyche for the premia to endure.
Bull case
Our bull case for gold assumes only two rate hikes in 2018. As a result the DXY only rises to 99 and treasury yields only rise to 2.8%. We assume that inflation rises to 3%.
We raise the investor positioning in gold to 200k contracts net long for the whole forecast horizon. This is one of the main drivers of higher gold prices in this scenario compared to the base case. There are numerous risks which can push demand for gold futures higher:
- Continued sabre-rattling between US/Japan/South Korea and North Korea; • The proxy war between Saudi Arabia and Iran escalates;
- A disorderly unwind of credit in China;
- Italian policy paralysed by the inability to form a government after the election;
- Catalonian independence pushing Spain close to civil war
- A potential second general election in Germany; and
- Market volatility measures such as the VIX (equity), MOVE (bond) spike as yield-trades unwind
In the bull case scenario, gold will rise to US$1420/oz by the middle of the year, and ease to just below US$1400/oz by the end of 2018.
Bear case
In our bear case, we assume the Fed delivers four rates hikes in 2018 as it tries to anchor inflation expectations. 10-year nominal Treasury yields rise to 3.3% by the end of the year, while the DXY appreciates to 105. By year-end inflation falls back to 1.6%. In this scenario we assume that the absence of any geopolitical risk premia or adverse financial market shock and so speculative positioning falls to 40k contracts net long. In the bear case scenario gold falls to US$1110/oz by end of 2018.


Brent crude is essentially flat on the week, but after a volatile ride. Prices started Monday near USD 65.5/bl, climbed steadily to a mid-week high of USD 67.8/bl on Wednesday evening, before falling sharply – losing about USD 2/bl during Thursday’s session.

Brent is currently trading around USD 65.8/bl, right back where it began. The volatility reflects the market’s ongoing struggle to balance growing surplus risks against persistent geopolitical uncertainty and resilient refined product margins. Thursday’s slide snapped a three-day rally and came largely in response to a string of bearish signals, most notably from the IEA’s updated short-term outlook.
The IEA now projects record global oversupply in 2026, reinforcing concerns flagged earlier by the U.S. EIA, which already sees inventories building this quarter. The forecast comes just days after OPEC+ confirmed it will continue returning idle barrels to the market in October – albeit at a slower pace of +137,000 bl/d. While modest, the move underscores a steady push to reclaim market share and adds to supply-side pressure into year-end.
Thursday’s price drop also followed geopolitical incidences: Israeli airstrikes reportedly targeted Hamas leadership in Doha, while Russian drones crossed into Polish airspace – events that initially sent crude higher as traders covered short positions.
Yet, sentiment remains broadly cautious. Strong refining margins and low inventories at key pricing hubs like Europe continue to support the downside. Chinese stockpiling of discounted Russian barrels and tightness in refined product markets – especially diesel – are also lending support.
On the demand side, the IEA revised up its 2025 global demand growth forecast by 60,000 bl/d to 740,000 bl/d YoY, while leaving 2026 unchanged at 698,000 bl/d. Interestingly, the agency also signaled that its next long-term report could show global oil demand rising through 2050.
Meanwhile, OPEC offered a contrasting view in its latest Monthly Oil Market Report, maintaining expectations for a supply deficit both this year and next, even as its members raise output. The group kept its demand growth estimates for 2025 and 2026 unchanged at 1.29 million bl/d and 1.38 million bl/d, respectively.
We continue to watch whether the bearish supply outlook will outweigh geopolitical risk, and if Brent can continue to find support above USD 65/bl – a level increasingly seen as a soft floor for OPEC+ policy.
Brent crude makes some gains as Israel’s attack on Hamas in Qatar rattles markets. Brent crude spiked to a high of USD 67.38/b yesterday as Israel made a strike on Hamas in Qatar. But it wasn’t able to hold on to that level and only closed up 0.6% in the end at USD 66.39/b. This morning it is starting on the up with a gain of 0.9% at USD 67/b. Still rattled by Israel’s attack on Hamas in Qatar yesterday. Brent is getting some help on the margin this morning with Asian equities higher and copper gaining half a percent. But the dark cloud of surplus ahead is nonetheless hanging over the market with Brent trading two dollar lower than last Tuesday.

Geopolitical risk premiums in oil rarely lasts long unless actual supply disruption kicks in. While Israel’s attack on Hamas in Qatar is shocking, the geopolitical risk lifting crude oil yesterday and this morning is unlikely to last very long as such geopolitical risk premiums usually do not last long unless real disruption kicks in.
US API data yesterday indicated a US crude and product stock build last week of 3.1 mb. The US API last evening released partial US oil inventory data indicating that US crude stocks rose 1.3 mb and middle distillates rose 1.5 mb while gasoline rose 0.3 mb. In total a bit more than 3 mb increase. US crude and product stocks usually rise around 1 mb per week this time of year. So US commercial crude and product stock rose 2 mb over the past week adjusted for the seasonal norm. Official and complete data are due today at 16:30.
A 2 mb/week seasonally adj. US stock build implies a 1 – 1.4 mb/d global surplus if it is persistent. Assume that if the global oil market is running a surplus then some 20% to 30% of that surplus ends up in US commercial inventories. A 2 mb seasonally adjusted inventory build equals 286 kb/d. Divide by 0.2 to 0.3 and we get an implied global surplus of 950 kb/d to 1430 kb/d. A 2 mb/week seasonally adjusted build in US oil inventories is close to noise unless it is a persistent pattern every week.
US IEA STEO oil report: Robust surplus ahead and Brent averaging USD 51/b in 2026. The US EIA yesterday released its monthly STEO oil report. It projected a large and persistent surplus ahead. It estimates a global surplus of 2.2 m/d from September to December this year. A 2.4 mb/d surplus in Q1-26 and an average surplus for 2026 of 1.6 mb/d resulting in an average Brent crude oil price of USD 51/b next year. And that includes an assumption where OPEC crude oil production only averages 27.8 mb/d in 2026 versus 27.0 mb/d in 2024 and 28.6 mb/d in August.
Brent will feel the bear-pressure once US/OECD stocks starts visible build. In the meanwhile the oil market sits waiting for this projected surplus to materialize in US and OECD inventories. Once they visibly starts to build on a consistent basis, then Brent crude will likely quickly lose altitude. And unless some unforeseen supply disruption kicks in, it is bound to happen.
US IEA STEO September report. In total not much different than it was in January

US IEA STEO September report. US crude oil production contracting in 2026, but NGLs still growing. Close to zero net liquids growth in total.

Brent crude touched a low of USD 65.07 per barrel on Friday evening before rebounding sharply by USD 2 to USD 67.04 by mid-day Monday. The rally came despite confirmation from OPEC+ of a measured production increase starting next month. Prices have since eased slightly, down USD 0.6 to around USD 66.50 this morning, as the market evaluates the group’s policy, evolving demand signals, and rising geopolitical tension.
On Sunday, OPEC+ approved a 137,000 barrels-per-day increase in collective output beginning in October – a cautious first step in unwinding the final tranche of 1.66 million barrels per day in voluntary cuts, originally set to remain off the market through end-2026. Further adjustments will depend on ”evolving market conditions.” While the pace is modest – especially relative to prior monthly hikes – the signal is clear: OPEC+ is methodically re-entering the market with a strategic intent to reclaim lost market share, rather than defend high prices.
This shift in tone comes as Saudi Aramco also trimmed its official selling prices for Asian buyers, further reinforcing the group’s tilt toward a volume-over-price strategy. We see this as a clear message: OPEC+ intends to expand market share through steady production increases, and a lower price point – potentially below USD 65/b – may be necessary to stimulate demand and crowd out higher-cost competitors, particularly U.S. shale, where average break-evens remain around WTI USD 50/b.
Despite the policy shift, oil prices have held firm. Brent is still hovering near USD 66.50/b, supported by low U.S. and OECD inventories, where crude and product stocks remain well below seasonal norms, keeping front-month backwardation intact. Also, the low inventory levels at key pricing hubs in Europe and continued stockpiling by Chinese refiners are also lending resilience to prices. Tightness in refined product markets, especially diesel, has further underpinned this.
Geopolitical developments are also injecting a slight risk premium. Over the weekend, Russia launched its most intense air assault on Kyiv since the war began, damaging central government infrastructure. This escalation comes as the EU weighs fresh sanctions on Russian oil trade and financial institutions. Several European leaders are expected in Washington this week to coordinate on Ukraine strategy – and the prospect of tighter restrictions on Russian crude could re-emerge as a price stabilizer.
In Asia, China’s crude oil imports rose to 49.5 million tons in August, up 0.8% YoY. The rise coincides with increased Chinese interest in Russian Urals, offered at a discount during falling Indian demand. Chinese refiners appear to be capitalizing on this arbitrage while avoiding direct exposure to U.S. trade penalties.
Going forward, our attention turns to the data calendar. The EIA’s STEO is due today (Tuesday), followed by the IEA and OPEC monthly oil market reports on Thursday. With a pending supply surplus projected during the fourth quarter and into 2026, markets will dissect these updates for any changes in demand assumptions and non-OPEC supply growth. Stay tuned!


Kinas elproduktion slog nytt rekord i augusti, vilket även kolkraft gjorde

Det stigande guldpriset en utmaning för smyckesköpare

Aktier i guldbolag laggar priset på guld
Volatile but going nowhere. Brent crude circles USD 66 as market weighs surplus vs risk

Guld når sin högsta nivå någonsin, nu även justerat för inflation

Meta bygger ett AI-datacenter på 5 GW och 2,25 GW gaskraftverk
Aker BP gör ett av Norges största oljefynd på ett decennium, stärker resurserna i Yggdrasilområdet
Brent sideways on sanctions and peace talks

Ett samtal om koppar, kaffe och spannmål
Sommarens torka kan ge högre elpriser i höst
-
 Nyheter4 veckor sedan
Meta bygger ett AI-datacenter på 5 GW och 2,25 GW gaskraftverk
-
 Nyheter4 veckor sedan
Aker BP gör ett av Norges största oljefynd på ett decennium, stärker resurserna i Yggdrasilområdet
-
Analys4 veckor sedan
Brent sideways on sanctions and peace talks
-
 Nyheter4 veckor sedan
Ett samtal om koppar, kaffe och spannmål
-
 Nyheter4 veckor sedan
Sommarens torka kan ge högre elpriser i höst
-
Analys4 veckor sedan
Brent edges higher as India–Russia oil trade draws U.S. ire and Powell takes the stage at Jackson Hole
-

 Nyheter3 veckor sedan
Mahvie Minerals är verksamt i guldrikt område i Finland
-
Analys3 veckor sedan
Increasing risk that OPEC+ will unwind the last 1.65 mb/d of cuts when they meet on 7 September