

Analys
Defensive Assets: Gold, a precious ally in the fight against equity drawdown


In the previous instalments of this blog series, we highlighted the defensive behaviour of quality and high dividend equities, long duration government bonds and safe haven currencies as an asset, as well as an overlay to other asset classes. The last few weeks really put investors’ portfolio to the test and the least we can say is that those defensive assets did very well. While Global Equities (MSCI World net TR) lost 17.91% from the most recent tops on 12th February up to 9th March, Long Duration Treasuries (proxied by the Bloomberg Barclays US Treasury 10+) have return an incredible +21.99%. In the same period, Japanese Yen was up 7.54% versus the US Dollar and Quality stocks (proxied by the WisdomTree Global Quality Dividend Growth net TR) did cushion the fall, losing 15.73% and therefore outperforming the market by 2.27%1.
This week, our journey takes us to a fourth asset class, Commodities. Using our defensive framework, we will assess how single commodities or commodity sectors react to equity downturn. In particular, we will highlight how:
- precious metals such as Gold can bring potential diversification and defensiveness to a portfolio as well as act as inflation hedge on the upside. Gold was up 6.96% from 12th February to 9th March 2020;
- Broad commodities could act as a diversifier in a multi asset portfolio.
In the following, we analyse traditional Commodity benchmarks that use front month futures to invest in the different commodities in the universe (being commodities in general or sectors). The only exception are precious metals, were physical investments are considered (physical bullions in vaults for Gold for example). Enhanced commodities are meant to represent “smart beta” in commodities where the strategy can invest further along the curve (i.e. not always in the front month future) to improve the roll yield available to the investor while delivering similar spot and collateral returns. More information on this topic is available on our website. Those strategies have historically delivered strong outperformance over time while keeping the correlation with the benchmark very high.
Precious Metals stands out in Commodities
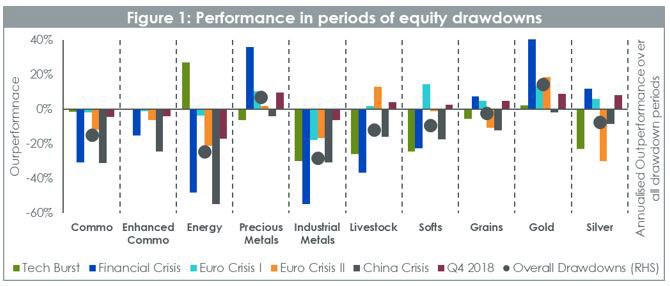
Our framework focuses on 4 characteristics, risk reduction, asymmetry of returns, diversification and valuation. Starting with drawdown protection in Figure 1, it is pretty clear that broad commodities and most commodities sectors are cyclical in nature. Enhanced Commodities fare better than traditional benchmark overall, but the standout defensive asset is precious metals and in particular Gold. In 5 out of the 6 drawdown periods, Gold performed positively, delivering 14.4% per year on average. To put this result in perspective, over those 6 periods, European equities have delivered -35.2%, Min Volatility equities -17.8%, Cash +2.8%, EUR Treasury AAA 8.4% and USD Treasury 11.3%2.
It is worth noting, however, that Energy can also deliver some downside protection when the equity downturn is the result of external shocks such as geopolitical uncertainties. In such, cases Energy and Oil, in particular, tend to react on the upside providing some protection aligned with Gold.
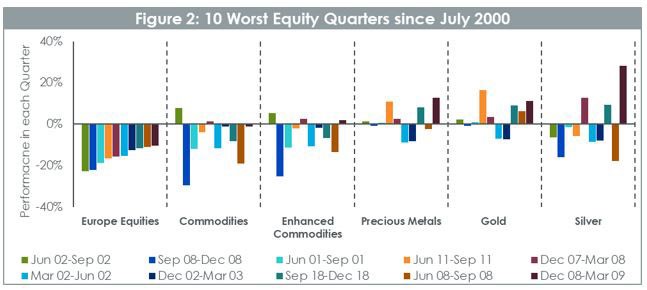
Looking further at the performance of Precious Metals in periods of drawdown we observe in figure 2 that over the 10 worst quarters for European equities in the last 20 years, Gold has 7 quarters of positive performance – a rate of 70%. On average gold outperformed equities by 19% in those quarters. Silver provides results that are more mixed despite outperforming equities by 14% on average. While over the full period commodities didn’t provide a positive return, in 8 of the 10 periods they outperformed equity markets by 8% on average proving that they are still a powerful diversifier. Enhanced Commodities fared even better outperforming equities by 9.6% on average per quarter.
Commodities a chief diversifier
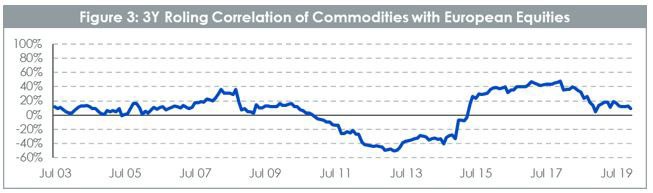
In fact, the rolling 3Y correlation between commodities and equities remains consistently below 50% with long periods where it is nil or even negative. From a pure portfolio construction point of view, this is very exciting as it hands us a diversifying asset that can help reduce the overall volatility of the portfolio.
Gold, a precious tool to build defensive portfolios
From a more macroeconomic perspective and looking at Commodities performance across business cycles, it is again very clear that Precious Metals offer a protection in economic slowdown or recession. In Figure 3, we have split the last 20 years in 4 types of periods using the Organisation for Economic Co-operation and Development (“OECD”) Composite Leading indicator (“CLI”). The CLI has been designed to decrease a few months before economy start to slow down or increase before the economy restarts. So, a strong decline in CLI tends to indicate a probable downturn in equity markets for example.
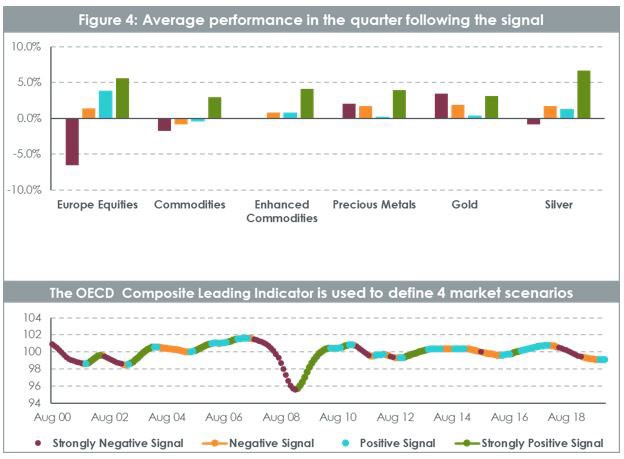
Enhanced Commodities behaved very well compared to front month commodities, cutting significantly the downside in negative economic environments and doing better in positive ones. It is worth noting as well the extent to which commodities and enhanced commodities perform when the economic signals are strong. This is linked to the well documented properties of commodities as an inflation hedge. Precious Metals exhibit a very strong and versatile profile driven mainly by gold.
It is interesting to note that Gold has outperformed very strongly in very negative or negative economic scenarios but also has done very well in periods of strong economic rebound, buoyed by its inflation hedge proprieties. This makes Gold a pretty asymmetric asset with strong positive performance in difficult economic periods but also good performance in strong rebound and when yields are expected to increase. Silver, similarly to palladium and platinum, offers also an interesting payoff, behaving part like a precious metal and part like an industrial metal. In periods where the economy is strong, it benefits from being used in the industry and behave more pro cyclically than gold. However, in economic downturn, it benefits from its status as a precious metal and delivers some protection.
This brings us to our fourth pillar in our framework: valuation. WisdomTree issued its quarterly outlook for Gold in January 2020, offering a number of scenarios fo the metal this year. In “Gold: how we value the precious metal”, we explain how we characterise gold’s past behaviour. Unlike other commodities where the balance of physical supply and demand influence the price, gold behaves more like a pseudo currency, driven by more macroeconomic variables like the interest rate environment, inflation, exchange rates and sentiment. Characterising gold’s past behaviour allows us to project where gold could go in the future (assuming it maintains consistent behaviour) using an internal model. In recent weeks, given the sharp rise in volatility of many asset markets and decisive action by a number of central banks across the globe, we are treading a path that looks like the bull case scenario presented our January 2020 outlooks. That scenario would see gold prices head over US$2000/oz by the end of the year. In that scenario, the Federal Reserve of the US embarks on policy easing (which has already started), that drives Treasury yields lower than where they were in December 2019 (Treasury yields have already broken new all-time lows of 0.35% on March 10th 2020). Inflation in that scenario is at an elevated 2.5% (which is in line with the January 2020 actual reading). Lastly, speculative positioning in gold futures markets remains elevated throughout the course of the year (at 350k contracts net long). In February 2020, we saw speculative positioning hit fresh highs (388k) and at the time of writing (10th March 2020), it remains above the 350k. We caution that if the current shock we are experiencing is temporary, we could get the recent interest rate cuts reversed, Treasury yields could rise to 2% and positing in gold futures could head back to more normal levels (closer to 120k). That was what we presented as a base case in January, where gold would end the year at US$1640/oz. So the downside from the levels ate the time of writing is somewhat limited (with gold trading at US$1650/oz at the time of writing) even if we end up in what was the base case.
This concludes our 6 weeks grand tour of the “natural” defensive assets among the main 4 asset classes. Next week we will start focusing on portfolio construction and on different ideas to design defensive and versatile portfolios.
Europe Equities is proxied by the STOXX Europe 600 net total return index. Broad Commodities (Commo) is proxied by the Bloomberg Commodity Total Return Index. Enhanced Commodities is proxied by Optimized Roll Commodity Total Return Index. Energy is proxied by the Bloomberg Energy subindex Total Return Index. Precious Metals is proxied by the Bloomberg Precious Metals subindex Total Return Index. Industrial Metals is proxied by the Bloomberg Industrial Metals subindex Total Return Index. Livestock is proxied by the Bloomberg Livestock subindex Total Return Index. Softs is proxied by the Bloomberg Softs subindex Total Return Index. Grains is proxied by the Bloomberg Grains subindex Total Return Index. Gold is proxied by the LBMA Gold Price PM Index. Silver is proxied by the LBMA Silver Price index.
By: Pierre Debru, Director, Research
Source
1 WisdomTree, Bloomberg. In EUR.
2 WisdomTree, Bloomberg. In EUR. Europe Equities is proxied by the STOXX Europe 600 net total return index. Min Vol is proxied by MSCI World Min Volatility net total return index. Cash Euro is proxied by a series of daily compounded Eonia. EUR Treasury AAA is proxied by the Bloomberg Barclays EUR Aggregate Treasury AAA total return index. USD Treasury is proxied by the Bloomberg Barclays USD Treasury total return index.

The latest weekly report from the US DOE showed a substantial drawdown across key petroleum categories, adding more upside potential to the fundamental picture.

Commercial crude inventories (excl. SPR) fell by 5.8 million barrels, bringing total inventories down to 415.1 million barrels. Now sitting 11% below the five-year seasonal norm and placed in the lowest 2015-2022 range (see picture below).
Product inventories also tightened further last week. Gasoline inventories declined by 2.1 million barrels, with reductions seen in both finished gasoline and blending components. Current gasoline levels are about 3% below the five-year average for this time of year.
Among products, the most notable move came in diesel, where inventories dropped by almost 4.1 million barrels, deepening the deficit to around 20% below seasonal norms – continuing to underscore the persistent supply tightness in diesel markets.
The only area of inventory growth was in propane/propylene, which posted a significant 5.1-million-barrel build and now stands 9% above the five-year average.
Total commercial petroleum inventories (crude plus refined products) declined by 4.2 million barrels on the week, reinforcing the overall tightening of US crude and products.


A classic case of “buy the rumor, sell the news” played out in oil markets, as Brent crude has dropped sharply – down nearly USD 10 per barrel since yesterday evening – following Iran’s retaliatory strike on a U.S. air base in Qatar. The immediate reaction was: “That was it?” The strike followed a carefully calibrated, non-escalatory playbook, avoiding direct threats to energy infrastructure or disruption of shipping through the Strait of Hormuz – thus calming worst-case fears.
After Monday morning’s sharp spike to USD 81.4 per barrel, triggered by the U.S. bombing of Iranian nuclear facilities, oil prices drifted sideways in anticipation of a potential Iranian response. That response came with advance warning and caused limited physical damage. Early this morning, both the U.S. President and Iranian state media announced a ceasefire, effectively placing a lid on the immediate conflict risk – at least for now.
As a result, Brent crude has now fallen by a total of USD 12 from Monday’s peak, currently trading around USD 69 per barrel.
Looking beyond geopolitics, the market will now shift its focus to the upcoming OPEC+ meeting in early July. Saudi Arabia’s decision to increase output earlier this year – despite falling prices – has drawn renewed attention considering recent developments. Some suggest this was a response to U.S. pressure to offset potential Iranian supply losses.
However, consensus is that the move was driven more by internal OPEC+ dynamics. After years of curbing production to support prices, Riyadh had grown frustrated with quota-busting by several members (notably Kazakhstan). With Saudi Arabia cutting up to 2 million barrels per day – roughly 2% of global supply – returns were diminishing, and the risk of losing market share was rising. The production increase is widely seen as an effort to reassert leadership and restore discipline within the group.
That said, the FT recently stated that, the Saudis remain wary of past missteps. In 2018, Riyadh ramped up output at Trump’s request ahead of Iran sanctions, only to see prices collapse when the U.S. granted broad waivers – triggering oversupply. Officials have reportedly made it clear they don’t intend to repeat that mistake.
The recent visit by President Trump to Saudi Arabia, which included agreements on AI, defense, and nuclear cooperation, suggests a broader strategic alignment. This has fueled speculation about a quiet “pump-for-politics” deal behind recent production moves.
Looking ahead, oil prices have now retraced the entire rally sparked by the June 13 Israel–Iran escalation. This retreat provides more political and policy space for both the U.S. and Saudi Arabia. Specifically, it makes it easier for Riyadh to scale back its three recent production hikes of 411,000 barrels each, potentially returning to more moderate increases of 137,000 barrels for August and September.
In short: with no major loss of Iranian supply to the market, OPEC+ – led by Saudi Arabia – no longer needs to compensate for a disruption that hasn’t materialized, especially not to please the U.S. at the cost of its own market strategy. As the Saudis themselves have signaled, they are unlikely to repeat previous mistakes.
Conclusion: With Brent now in the high USD 60s, buying oil looks fundamentally justified. The geopolitical premium has deflated, but tensions between Israel and Iran remain unresolved – and the risk of missteps and renewed escalation still lingers. In fact, even this morning, reports have emerged of renewed missile fire despite the declared “truce.” The path forward may be calmer – but it is far from stable.
Analys
A muted price reaction. Market looks relaxed, but it is still on edge waiting for what Iran will do
Brent crossed the 80-line this morning but quickly fell back assigning limited probability for Iran choosing to close the Strait of Hormuz. Brent traded in a range of USD 70.56 – 79.04/b last week as the market fluctuated between ”Iran wants a deal” and ”US is about to attack Iran”. At the end of the week though, Donald Trump managed to convince markets (and probably also Iran) that he would make a decision within two weeks. I.e. no imminent attack. Previously when when he has talked about ”making a decision within two weeks” he has often ended up doing nothing in the end. The oil market relaxed as a result and the week ended at USD 77.01/b which is just USD 6/b above the year to date average of USD 71/b.

Brent jumped to USD 81.4/b this morning, the highest since mid-January, but then quickly fell back to a current price of USD 78.2/b which is only up 1.5% versus the close on Friday. As such the market is pricing a fairly low probability that Iran will actually close the Strait of Hormuz. Probably because it will hurt Iranian oil exports as well as the global oil market.
It was however all smoke and mirrors. Deception. The US attacked Iran on Saturday. The attack involved 125 warplanes, submarines and surface warships and 14 bunker buster bombs were dropped on Iranian nuclear sites including Fordow, Natanz and Isfahan. In response the Iranian Parliament voted in support of closing the Strait of Hormuz where some 17 mb of crude and products is transported to the global market every day plus significant volumes of LNG. This is however merely an advise to the Supreme leader Ayatollah Ali Khamenei and the Supreme National Security Council which sits with the final and actual decision.
No supply of oil is lost yet. It is about the risk of Iran closing the Strait of Hormuz or not. So far not a single drop of oil supply has been lost to the global market. The price at the moment is all about the assessed risk of loss of supply. Will Iran choose to choke of the Strait of Hormuz or not? That is the big question. It would be painful for US consumers, for Donald Trump’s voter base, for the global economy but also for Iran and its population which relies on oil exports and income from selling oil out of that Strait as well. As such it is not a no-brainer choice for Iran to close the Strait for oil exports. And looking at the il price this morning it is clear that the oil market doesn’t assign a very high probability of it happening. It is however probably well within the capability of Iran to close the Strait off with rockets, mines, air-drones and possibly sea-drones. Just look at how Ukraine has been able to control and damage the Russian Black Sea fleet.
What to do about the highly enriched uranium which has gone missing? While the US and Israel can celebrate their destruction of Iranian nuclear facilities they are also scratching their heads over what to do with the lost Iranian nuclear material. Iran had 408 kg of highly enriched uranium (IAEA). Almost weapons grade. Enough for some 10 nuclear warheads. It seems to have been transported out of Fordow before the attack this weekend.
The market is still on edge. USD 80-something/b seems sensible while we wait. The oil market reaction to this weekend’s events is very muted so far. The market is still on edge awaiting what Iran will do. Because Iran will do something. But what and when? An oil price of 80-something seems like a sensible level until something do happen.


Nickelmarknaden under fortsatt press – överskott väntas bestå till 2026

Westinghouse planerar tio nya stora kärnreaktorer i USA – byggstart senast 2030

Eurobattery Minerals förvärvar majoritet i spansk volframgruva

USA ska införa 50 procent tull på koppar

Ryska staten siktar på att konfiskera en av landets största guldproducenter

Mahvie Minerals växlar spår – satsar fullt ut på guld

Jonas Lindvall är tillbaka med ett nytt oljebolag, Perthro, som ska börsnoteras
A muted price reaction. Market looks relaxed, but it is still on edge waiting for what Iran will do

Oljan, guldet och marknadens oroande tystnad

Domstolen ger klartecken till Lappland Guldprospektering
-
 Nyheter4 veckor sedan
Mahvie Minerals växlar spår – satsar fullt ut på guld
-
Analys4 veckor sedan
A muted price reaction. Market looks relaxed, but it is still on edge waiting for what Iran will do
-
 Nyheter3 veckor sedan
Jonas Lindvall är tillbaka med ett nytt oljebolag, Perthro, som ska börsnoteras
-
 Nyheter3 veckor sedan
Oljan, guldet och marknadens oroande tystnad
-
 Nyheter3 veckor sedan
Domstolen ger klartecken till Lappland Guldprospektering
-
Analys3 veckor sedan
Tightening fundamentals – bullish inventories from DOE
-
 Nyheter2 veckor sedan
Ryska staten siktar på att konfiskera en av landets största guldproducenter
-

 Nyheter2 veckor sedan
Sommarvädret styr elpriset i Sverige