

Analys
What is behind the recent fall in US crude oil stocks?
 US crude oil stocks have fallen significantly during the summer months. This was mainly attributable to an increase in crude oil processing. In this way US refineries reacted to robust demand for middle distillates, which is reflected in low US distillate stocks and record US distillate exports. As crude oil processing declines, US crude oil stocks will likely rise again in the fourth quarter. Robust US distillate exports are exerting pressure on refinery margins in Europe, which will probably increase Europe’s dependency on imports of oil products.
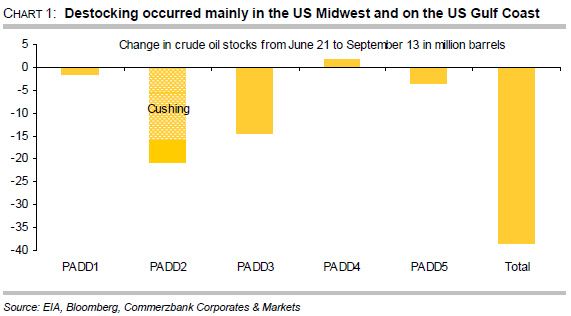
 US crude oil stocks have fallen significantly during the summer months. Since the end of June they have declined by 38m barrels and in mid-September reached their lowest level for 18 months. Destocking has been concentrated on two regions: in the Midwest (PADD 2) stocks have fallen by more than 20m barrels, and on the US Gulf Coast (PADD 3) by more than 14m barrels (chart 1). The lion’s share of the destocking in the Midwest related to the storage hub in Cushing, where stocks have fallen by a total of 16.5m barrels for 13 weeks in succession. What is the reason for this surprising trend and will the destocking continue?
The trend in stock levels can be divided into three sub-components: on the supply side are US oil production and US oil imports, and on the demand side, crude oil processing by refineries. US oil production has increased until recently. In mid-September it reached its highest level since May 1989 of more than 7.4m barrels per day. This component cannot therefore explain the destocking of recent weeks. On the other hand, imports of crude oil have fallen sharply. In the summer months they were, on average, 1m barrels per day lower than in the previous year. However, this will not be sufficient to balance out the simultaneous increase in US oil production. Between the end of June and mid-September this was, on average, 1.4m barrels per day above the previous year’s level. The trend on the supply side would therefore have been an indication of stockbuilding. The main reason for the significant destocking this summer is therefore to be found on the demand side, i.e. from the higher volumes of crude oil processed at refineries.
Crude oil processing in the USA was higher than usual this summer
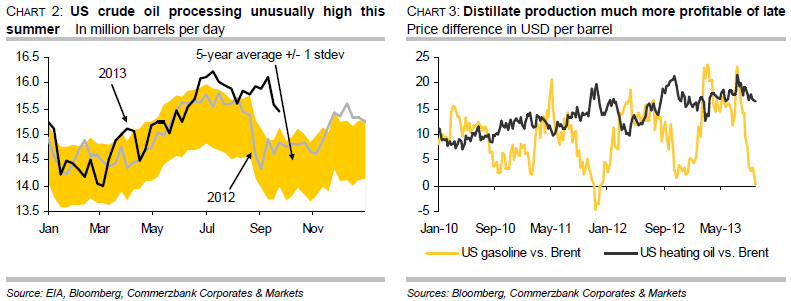
US refineries stepped up crude oil processing much more significantly than usual this summer. Between the end of June and mid-September, an average of 16m barrels of crude oil was processed daily. This was 600,000 barrels per day more than in the corresponding period last year, and 900,000 barrels per day more than the long-term average level (chart 2). At the beginning of July, more crude oil was processed than at any time in the last eight years. It was also striking that refineries maintained processing rates at their high levels of July and August up to mid-September. Normally, refineries scale back their utilisation from the end of August as the summer driving season approaches an end. Refineries usually use the time in early autumn to carry out maintenance and to switch operations to the winter season. Hence, significantly more crude oil has been processed this summer than would otherwise be normal at this time of the year. This has only been possible by consistently dipping into crude oil stocks, although more crude oil has also been available as a result of the increased level of domestic oil production.
This cannot be explained with trends in the US gasoline market…
The fact that US refineries have increased their crude oil processing so strongly over an extended period this summer cannot be explained by trends in the US gasoline market, which is normally the most important driver of refinery activity in the summer months. Demand for gasoline in the US during the summer driving season showed virtually no increase compared to last year. US gasoline stocks have remained consistently 5 to 6 per cent above their long-term average for weeks with a few exceptions. US gasoline production was just slightly higher this summer than in the previous years. Moreover, the US exported less gasoline between March and July than one year ago, according to the EIA.
…but is attributable to distillate production in particular
The reason for the unusually high level of refinery activity over a prolonged period is above all attributable to middle distillates. US refineries have significantly increased the production of middle distillates in particular. This increased to an average of 5m barrels per day in the summer months, which was 13% higher than average for the last five years. More than half of the increase in crude oil processing this summer is therefore attributable to the middle distillates segment. The varying trend in processing margins is likely to have played a part here. While margins for gasoline production have fallen to the lowest level since end of 2011, they are still relatively high for middle distillates (chart 3). The fact that margins for middle distillates have held up much better is attributable to low US distillate stocks, which have remained well below their long-term average levels despite robust production of middle distillates.
Strong demand for distillates in and outside the USA
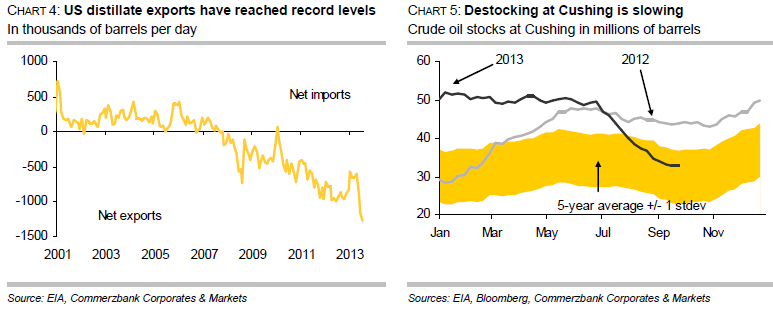
This is mainly the result of higher domestic demand and robust demand for distillates from abroad. Distillate demand from US consumers was 10% higher than last year during the summer months and 6% above the average of the last five years. Moreover, the USA exported 1.276m barrels of middle distillates per day on balance in July after having reached a level nearly as high in June (chart 4, page 3). Daily net distillate exports were almost twice as high in June and July as in the first four months of the year and also 26% above the same period last year. Weekly estimates from the US Energy Information Administration also indicate that distillate exports remained at a similarly high level in August and September.
Refinery activity is unlikely to sustain these exceptionally high levels
US refineries have benefited from cheaper crude oil from the country’s interior until recently, which, thanks to new pipeline capacity, can be transported to the US Gulf Coast, where roughly half of US refinery capacity is situated. This also enables US refineries to avoid the continuing restrictions on crude oil exports from the USA, since these restrictions do not apply to the export of oil products. Despite everything, US refineries are unlikely to maintain their distinctly high levels of crude oil processing of recent months, given lower margins. The EIA expects average crude oil processing of 15.3m barrels per day in the fourth quarter. This would still be more than 500,000 barrels per day above the average of the last five years, but some 600,000 barrels per day less than in the third quarter. The lower demand for crude oil from refineries indicates higher stock levels, if US oil imports are not being reduced markedly, as US oil production is likely to increase further as a result of the surge in shale oil production in North Dakota and Texas. In fact, the decline in US crude oil stocks seems to have come to an end. In the second half of September stocks were already increasing by roughly 8m barrels, due to lower volume of crude oil processing and higher oil imports.
Decline in crude oil stocks has recently also slowed at Cushing
The 13-week long decline in crude oil stocks at Cushing has also weakened visibly in recent weeks (chart 5). Whereas, between the beginning of July and the end of August, on balance an average of 1.36m barrels of crude oil per week were drained off Cushing, in September the figure had fallen to an average of less than 500,000 barrels per week. At the end of September, the decline in stocks at Cushing had almost come to an end. Should stocks be built up also at Cushing in the weeks ahead, this would not be attributable to a lack of transport or processing capacities. These are now sufficient – as the steady fall in Cushing stocks over the summer months despite rising shale oil production in the Midwest demonstrated. In fact, once the Southern leg of the Keystone XL pipeline is completed, additional transport capacities of 700,000 barrels per day will be available by year-end. A stock build-up would instead be attributable to lower crude oil processing at refineries. This should exert pressure on the WTI price in particular.
Record US distillate exports creating problems for refineries in Europe
What are the implications of these trends for Europe? According to data from the EIA, the USA was already exporting record volumes of middle distillates to Europe in May and June. Based on shipping data, this trend has continued in September. The high levels of US distillate exports will exert pressure on refinery margins in Europe. Despite low gasoil stocks, the price differential between gasoil and Brent oil has been moving in a narrow range around USD 15 per barrel for some months, which is hardly sufficient to offset the very low margins in gasoline production. The situation has been compounded by the fact that the USA itself has now become a net gasoline exporter. As a result the US market – formerly the most important sales market for European refineries – has been lost. At the same time, the USA is also competing in gasoline on other sales markets such as South America, for instance. Further refinery closures in Europe are thus on the cards, which would further increase Europe’s dependency on imports of oil products.


The latest weekly report from the US DOE showed a substantial drawdown across key petroleum categories, adding more upside potential to the fundamental picture.

Commercial crude inventories (excl. SPR) fell by 5.8 million barrels, bringing total inventories down to 415.1 million barrels. Now sitting 11% below the five-year seasonal norm and placed in the lowest 2015-2022 range (see picture below).
Product inventories also tightened further last week. Gasoline inventories declined by 2.1 million barrels, with reductions seen in both finished gasoline and blending components. Current gasoline levels are about 3% below the five-year average for this time of year.
Among products, the most notable move came in diesel, where inventories dropped by almost 4.1 million barrels, deepening the deficit to around 20% below seasonal norms – continuing to underscore the persistent supply tightness in diesel markets.
The only area of inventory growth was in propane/propylene, which posted a significant 5.1-million-barrel build and now stands 9% above the five-year average.
Total commercial petroleum inventories (crude plus refined products) declined by 4.2 million barrels on the week, reinforcing the overall tightening of US crude and products.


A classic case of “buy the rumor, sell the news” played out in oil markets, as Brent crude has dropped sharply – down nearly USD 10 per barrel since yesterday evening – following Iran’s retaliatory strike on a U.S. air base in Qatar. The immediate reaction was: “That was it?” The strike followed a carefully calibrated, non-escalatory playbook, avoiding direct threats to energy infrastructure or disruption of shipping through the Strait of Hormuz – thus calming worst-case fears.
After Monday morning’s sharp spike to USD 81.4 per barrel, triggered by the U.S. bombing of Iranian nuclear facilities, oil prices drifted sideways in anticipation of a potential Iranian response. That response came with advance warning and caused limited physical damage. Early this morning, both the U.S. President and Iranian state media announced a ceasefire, effectively placing a lid on the immediate conflict risk – at least for now.
As a result, Brent crude has now fallen by a total of USD 12 from Monday’s peak, currently trading around USD 69 per barrel.
Looking beyond geopolitics, the market will now shift its focus to the upcoming OPEC+ meeting in early July. Saudi Arabia’s decision to increase output earlier this year – despite falling prices – has drawn renewed attention considering recent developments. Some suggest this was a response to U.S. pressure to offset potential Iranian supply losses.
However, consensus is that the move was driven more by internal OPEC+ dynamics. After years of curbing production to support prices, Riyadh had grown frustrated with quota-busting by several members (notably Kazakhstan). With Saudi Arabia cutting up to 2 million barrels per day – roughly 2% of global supply – returns were diminishing, and the risk of losing market share was rising. The production increase is widely seen as an effort to reassert leadership and restore discipline within the group.
That said, the FT recently stated that, the Saudis remain wary of past missteps. In 2018, Riyadh ramped up output at Trump’s request ahead of Iran sanctions, only to see prices collapse when the U.S. granted broad waivers – triggering oversupply. Officials have reportedly made it clear they don’t intend to repeat that mistake.
The recent visit by President Trump to Saudi Arabia, which included agreements on AI, defense, and nuclear cooperation, suggests a broader strategic alignment. This has fueled speculation about a quiet “pump-for-politics” deal behind recent production moves.
Looking ahead, oil prices have now retraced the entire rally sparked by the June 13 Israel–Iran escalation. This retreat provides more political and policy space for both the U.S. and Saudi Arabia. Specifically, it makes it easier for Riyadh to scale back its three recent production hikes of 411,000 barrels each, potentially returning to more moderate increases of 137,000 barrels for August and September.
In short: with no major loss of Iranian supply to the market, OPEC+ – led by Saudi Arabia – no longer needs to compensate for a disruption that hasn’t materialized, especially not to please the U.S. at the cost of its own market strategy. As the Saudis themselves have signaled, they are unlikely to repeat previous mistakes.
Conclusion: With Brent now in the high USD 60s, buying oil looks fundamentally justified. The geopolitical premium has deflated, but tensions between Israel and Iran remain unresolved – and the risk of missteps and renewed escalation still lingers. In fact, even this morning, reports have emerged of renewed missile fire despite the declared “truce.” The path forward may be calmer – but it is far from stable.
Analys
A muted price reaction. Market looks relaxed, but it is still on edge waiting for what Iran will do
Brent crossed the 80-line this morning but quickly fell back assigning limited probability for Iran choosing to close the Strait of Hormuz. Brent traded in a range of USD 70.56 – 79.04/b last week as the market fluctuated between ”Iran wants a deal” and ”US is about to attack Iran”. At the end of the week though, Donald Trump managed to convince markets (and probably also Iran) that he would make a decision within two weeks. I.e. no imminent attack. Previously when when he has talked about ”making a decision within two weeks” he has often ended up doing nothing in the end. The oil market relaxed as a result and the week ended at USD 77.01/b which is just USD 6/b above the year to date average of USD 71/b.

Brent jumped to USD 81.4/b this morning, the highest since mid-January, but then quickly fell back to a current price of USD 78.2/b which is only up 1.5% versus the close on Friday. As such the market is pricing a fairly low probability that Iran will actually close the Strait of Hormuz. Probably because it will hurt Iranian oil exports as well as the global oil market.
It was however all smoke and mirrors. Deception. The US attacked Iran on Saturday. The attack involved 125 warplanes, submarines and surface warships and 14 bunker buster bombs were dropped on Iranian nuclear sites including Fordow, Natanz and Isfahan. In response the Iranian Parliament voted in support of closing the Strait of Hormuz where some 17 mb of crude and products is transported to the global market every day plus significant volumes of LNG. This is however merely an advise to the Supreme leader Ayatollah Ali Khamenei and the Supreme National Security Council which sits with the final and actual decision.
No supply of oil is lost yet. It is about the risk of Iran closing the Strait of Hormuz or not. So far not a single drop of oil supply has been lost to the global market. The price at the moment is all about the assessed risk of loss of supply. Will Iran choose to choke of the Strait of Hormuz or not? That is the big question. It would be painful for US consumers, for Donald Trump’s voter base, for the global economy but also for Iran and its population which relies on oil exports and income from selling oil out of that Strait as well. As such it is not a no-brainer choice for Iran to close the Strait for oil exports. And looking at the il price this morning it is clear that the oil market doesn’t assign a very high probability of it happening. It is however probably well within the capability of Iran to close the Strait off with rockets, mines, air-drones and possibly sea-drones. Just look at how Ukraine has been able to control and damage the Russian Black Sea fleet.
What to do about the highly enriched uranium which has gone missing? While the US and Israel can celebrate their destruction of Iranian nuclear facilities they are also scratching their heads over what to do with the lost Iranian nuclear material. Iran had 408 kg of highly enriched uranium (IAEA). Almost weapons grade. Enough for some 10 nuclear warheads. It seems to have been transported out of Fordow before the attack this weekend.
The market is still on edge. USD 80-something/b seems sensible while we wait. The oil market reaction to this weekend’s events is very muted so far. The market is still on edge awaiting what Iran will do. Because Iran will do something. But what and when? An oil price of 80-something seems like a sensible level until something do happen.


Sommarvädret styr elpriset i Sverige

Samtal om flera delar av råvarumarknaden
Tightening fundamentals – bullish inventories from DOE

Jonas Lindvall är tillbaka med ett nytt oljebolag, Perthro, som ska börsnoteras

Oljan, guldet och marknadens oroande tystnad

Stor uppsida i Lappland Guldprospekterings aktie enligt analys

Brookfield ska bygga ett AI-datacenter på hela 750 MW i Strängnäs
Silverpriset släpar efter guldets utveckling, har mer uppsida

Tradingfirman XTX Markets bygger datacenter i finska Kajana för 1 miljard euro

Uppgången i oljepriset planade ut under helgen
-
 Nyheter3 veckor sedan
Stor uppsida i Lappland Guldprospekterings aktie enligt analys
-
 Nyheter4 veckor sedan
Brookfield ska bygga ett AI-datacenter på hela 750 MW i Strängnäs
-
 Nyheter3 veckor sedan
Silverpriset släpar efter guldets utveckling, har mer uppsida
-
 Nyheter4 veckor sedan
Tradingfirman XTX Markets bygger datacenter i finska Kajana för 1 miljard euro
-
 Nyheter2 veckor sedan
Uppgången i oljepriset planade ut under helgen
-

 Nyheter2 veckor sedan
Låga elpriser i sommar – men mellersta Sverige får en ökning
-
Analys2 veckor sedan
Very relaxed at USD 75/b. Risk barometer will likely fluctuate to higher levels with Brent into the 80ies or higher coming 2-3 weeks
-

 Nyheter1 vecka sedan
Mahvie Minerals växlar spår – satsar fullt ut på guld