

Analys
Silver versus platina

 Sedan silverpriset toppade i början av april i år har det fallit tillbaka från toppnoteringen kring 50 USD per troy ounce och har sedan etablerat sig kring dagens nivå om 32 USD per troy ounce. Under samma period har guldpriset fortsatt sin upptrend. Givet detta kan silver anses vara ett köp, i alla fall för den som ser det som ett relativitetsköp. Det kan vara så, men frågan är om inte platina erbjuder ett ännu bättre tillfälle till köp?
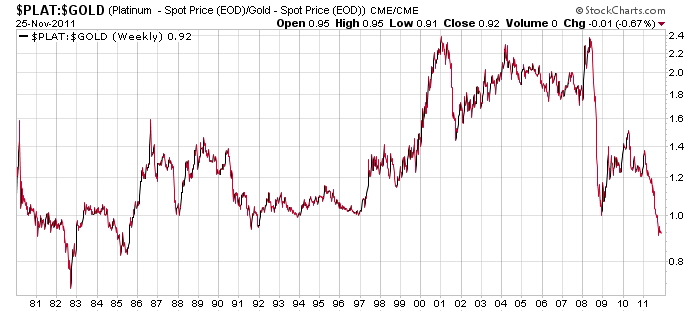
Först av allt, låt oss titta på platinapriset relativt silver och guld ur ett historiskt perspektiv. Genom att använda platinapriset i förhållande till de övriga ädelmetallerna kan vi se hur de andra metallerna handlas relativt varandra både nu och historiskt. I dag är ration platina/guld lägre än 1,0 vilket indikerar att platinapriset är lägre än guldpriset, något som är tämligen sällsynt. Det normala är att platinapriset handlas över priset på guld
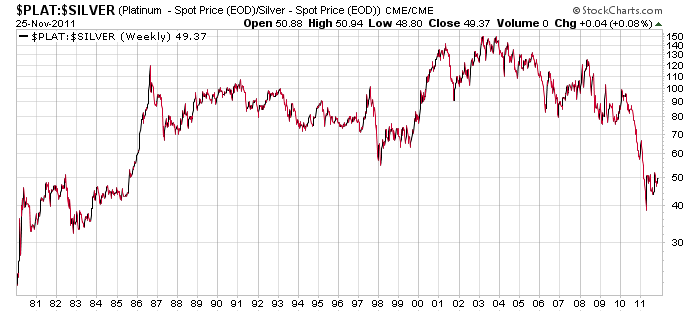
Notera också att platina handlas till låga nivåer jämfört med silverpriset, endast femtio gånger dyrare. Siffran kan förefalla hög, men det är faktiskt ”bara” som är det ordet som gäller. Senaste gången vi såg motsvarande prisrelation, 1:50 mellan silver och platina var 1985. Nivån brukar således vara betydligt högre.
En annan faktor som gör att vi anser att det är intressant att titta på platina är att guld och silver handlas en bra bit över produktionskostnaden, något som inte är fallet med platina. Precis som allt annat har cash-kostnaden för att utvinna ett troy ounce guld stigit, och den närmar sig nu 600 USD per troy ounce. Silver kostar närmare 5 USD per troy ounce, givet att vi talar green field gruvbrytning utan möjligheter att dra fördel av produktionen av basmetaller som zink och bly.
Analysteamet på Standard Bank konstaterar att “från ett kostnadsperspektiv så är platina köpvärt till priser under 1.550 USD per troy ounce” Vi kan bara hålla med dem om detta.Eftersom silvret i dag handlas till ett pris om cirka 32 USD per troy ounce så säljs det till över 600 procent av produktionskostnaderna, samma siffra är 200 procent för guldet. Platina däremot säljs till ett pris på råvarubörserna som ligger i närheten av produktionskostnaderna. Det betyder att silver och guldpriset kan komma att falla betydligt mer än platinapriset innan producenterna, det vill säga gruvorna, gör åtstramningar i fråga om fortsatt produktion för att minska sina förluster. Enligt lagen om tillgång och efterfrågan vet vi att minskad produktion ger ett minskat utbud, något som höjer priset, allt annat lika. Det finns därför anledningen att tro att priset på platina kan vara ett betydligt bet än det både guld och silver.
Platina startar en tillfällig uppgång. Men sen då?
När vi senast gjorde en teknisk analys på Platina var priset 1 604 USD/oz och datumet var den 1 november. Det första av våra uppgångsmål för hösten var redan infriat och det andra, på 1 670 USD/oz var nästan nått i och med en notering i 1 661 USD/oz. Även om det fanns utrymme för en avslutande uppgång för att helt infria målet, var nya nedgångar sedan att vänta eftersom den långsiktiga trenden var fallande.
De senaste fyra veckorna har Platina följt kartan mycket trofast. Vi fick en avslutande uppgång till 1 676 USD/oz den 9 november, men där tog kraften slut. Uppgången var fullbordad och vårt mål på 1 670 USD/oz som vi satte redan i början av oktober, var infriat till fullo.
I den efterföljande nedgången, som pågår än idag, är noteringen i 1526 USD/oz i fredags, den lägsta hittills. Frågan är förstås om denna nedgång på 9 procent från toppen, ska räcka? Ja, tillfälligtvis bör den göra det i alla fall.
De senaste tre månaderna har Platina skapat en fallande trend och sammanbinder vi topparna i denna nedgång, får vi en trendlinje som idag har värdet 1 618 USD/oz (se diagrammet). Denna trendlinje bör nu testas igen.
Datummässigt är det början av nästa vecka, 5-7 december som kommer att ge oss viktiga ledtrådar om den fortsatta utvecklingen i Platina. En topp i detta tidsfönster varnar för fortsatta nedgångar, medan en tydlig lågpunkt talar för att den fallande trendlinjen kan komma att ge vika under vintern.
Eftersom vi fortfarande lever med informationen att en nedgång mot 1100-1200 under vintern inte är utesluten, ser vi alla uppgångar som tillfälliga i en fallande marknad tills vi får signaler om något annat. En första signal om trendändring skulle vara om den fallande trendlinjen på 1618 USD/oz bryts. Och en ny långsiktig uppgång anser vi har påbörjats den dag som Platina stänger över motståndet 1658-1676 USD/oz.
Du kan handla PLATINA med följande minifutures:
Uppgång MINILONG PLAT A med en hävstång kring 4,56
Nedgång: MINISHRT PLAT D med en hävstång kring 4,61
Läs mer om minifutures på RBS hemsida
[box]Denna analys publiceras på Råvarumarknaden.se med tillstånd och i samarbete med Axier Equities.[/box]
Ansvarsfriskrivning
Den tekniska analysen har producerats av Axier Equities. Informationen är rapporterad i god tro och speglar de aktuella åsikterna hos medarbetarna, dessa kan ändras utan varsel. Axier Equities tar inget ansvar för handlingar baserade på informationen.
Om Axier Equities
Axier Equities erbjuder såväl institutionella placerare som privatpersoner den erfarenhet, kompetens och analysredskap som krävs för en trygg och effektiv handel på de finansiella marknaderna. Axier Equities erbjuder ingen handel, vare sig för egen räkning eller för kunder utan arbetar endast med finansiell marknadsföring och informationshantering. Företagets kunder får dessutom ta del av deras analysprodukter som till exempel det fullständiga morgonbrevet med ytterligare kommentarer och prognoser. Varje vecka tillkommer minst 30 analyser i Axier Equities analysarkiv. För ytterligare information se Axier Equities hemsida.


Market is starting to take US/Iran headlines with a pinch of salt. Brent crude rose $2.8/b yesterday to an official close of $112.1/b. But after that it traded as low as $108.05/b before ending late night at around $109.7/b. Through the day it traded in a range of $106.87 – 112.72/b amid a flurry of news or rumors from Iran and the US. ”US temporary sanctions during negotiations” (falls alarm). ”We will bomb Iran” (not anyhow),… etc. While the market is still fluctuating to this kind of news flow, it is starting to take such headlines with a pinch of salt.

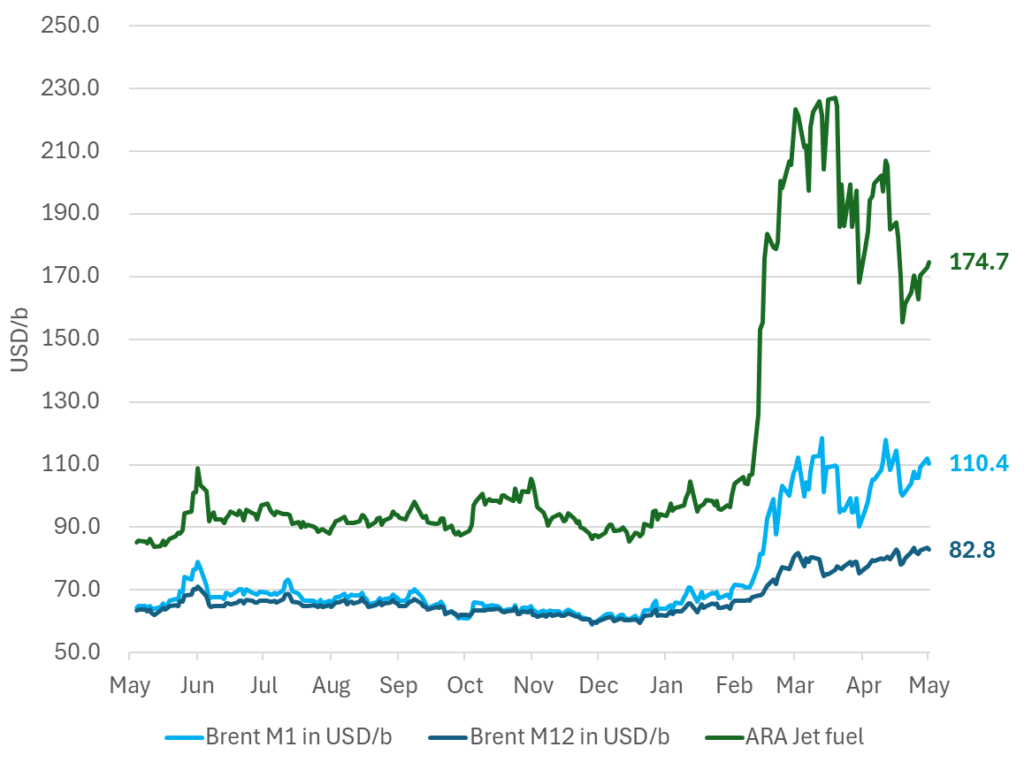
We’ll see. Maybe, maybe not. The Brent M1 contract is trading at $110.2/b this morning which very close to the average ticks through yesterday of $110.4/b.
Trump with bearish, verbal intervention whenever Brent trades above $110/b it seems. What seems to be a pattern is that Trump states something like ”very good negotiations going on with Iran”, ”New leaders in Iran are great,..”, ”Great progress in negotiations,…”, ”Deal in sight,..” etc whenever the Brent M1 contract trades above $110/b. An effort to cool the market. These hot air verbal interventions from Trump used to have a heavy bearish impact on prices, but they now seems to have less and less effect unless they are backed by reality.
As far as we can see there has been no real progress in the negotiations between the US and Iran with both sides still standing by their previous demands.
Iran is getting stronger while the cease fire lasts making a return to war for Trump yet harder. Iran is naturally in constant preparation for a return to war given Trump’s steady threats of bombing Iran again. Iran is naturally doing what ever is possible to prepare for a return to war. And every day the cease fire lasts it is better prepared. This naturally makes it more and more difficult and dangerous for the US to return to warring activity versus Iran as the consequences for energy infrastructure in the Persian Gulf will be more and more severe the longer the cease fire lasts. Israel seems to see it this way as well. That the war is not won and that current frozen state of a cease fire gives Iran opportunity to rebuild military and politically.
Global inventories are drawing down day by day. How much? In the meantime the Strait of Hormuz stays closed. There is varying measures and estimates of how much global inventories are drawing down. Our rough estimate, back of the envelope, is that global inventories are drawing down by at least some 10 mb/d or about 300 mb/d in a balance between loss of supply versus demand destruction. Other estimates we see are a monthly draw of 250-270 mb/d. The IEA only ’measured’ a draw in global observable stocks of 117 mb in April with oil on water rising 53 mb while on shore stocks fell 170 mb. But global stocks are hard to measure with large invisible, unmeasured stocks. As such a back of the envelope approach may be better.
Oil products is what the world is consuming. Oil product prices likely to rise while product stocks fall. Strategic Petroleum Reserves (SPR) are predominantly crude oil. Discharging oil from OECD SPR stocks, a sharp reduction in Chinese crude imports and a reduction in global refinery throughput of 6-7 mb/d has helped to keep crude oil markets satisfactorily supplied. But global inventories are drawing down none the less. And oil products is really what the world is consuming. So if global refinery throughput stays subdued, then demand will eventually have to match the supply of oil products. The likely path forward this summer is a steady draw down in jet fuel, diesel and gasoline. Higher prices for these. Then, if possible, higher refinery throughput and higher usage of crude in response to very profitable refinery margins. And lastly sharper draw in crude stocks and higher prices for these. But some 6 mb/d of oil products used to be exported through the Strait of Hormuz. And it may not be so easy to ramp up refinery activity across the world to compensate. Especially as Ukraine continues to damage Russian refineries as well as Russian crude production and export facilities.
Watch oil product stocks and prices as well as Brent calendar 2027. What to watch for this summer is thus oil product inventories falling and oil product premiums to crude rising. Another measure to watch is the Brent crude 2027 contract as it rises steadily day by day as the Strait of Hormuz stays closed and global oil inventories decline. The latter is close to the highest level since the start of the war and keeps rising.
The Brent M1 contract and the Brent 2027 prices and current price of jet fuel in Europe (ARA). All in USD/b
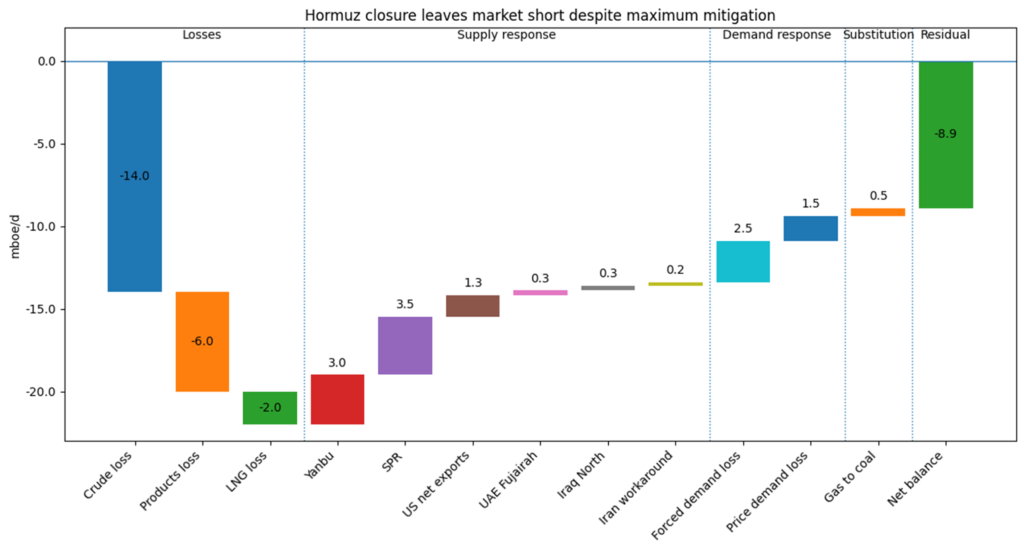
Our back of the envelope calculation of the global shortage created by the closure of the Strait of Hormuz. Note that 3.5 mb/d of discharge from SPR is also a draw. Note also that ’Forced demand loss’ of 2.5 mb/d is probably temporary and will fall back towards zero as logistics are sorted out leaving ’Price demand loss’ to do the job of balancing the market. Thus a shortfall of at least 9 mb/d created by the closure. More if SPR discharge is included and more if Forced demand loss recedes.
Brent is climbing higher. Front-month is at USD 106.3/bl this morning, close to a weekly high and a USD 9/bl jump from Mondays open. This is the move we flagged as a risk earlier in the week: the market shifting from ”a deal is around the corner” to ”this is going to take longer than we thought”.

Analyst Commodities, SEB
During April, rest-of-year Brent remained remarkably stable around USD 90/bl. A stability which rested on one single assumption: the SoH reopens around 1 May. That assumption is now slowly falling apart.
As we highlighted yesterday: every week of delay beyond 1 May adds (theoretically) ish USD 5/bl to the rest-of-year average, as global inventories draw 100 million barrels per week. i.e., a mid-May reopening implies rest-of-year Brent closer to USD 100/bl, and anything pushing into June or July takes us meaningfully higher.
What’s changed in the last 48 hours:
#1: The US military has formally warned that clearing suspected sea mines from SoH could take up to six months. That is a completely different timescale from what the financial market is pricing. Even a political deal tomorrow does not immediately reopen the strait.
#2: Trump has shifted his tone from urgency to ”strategic patience”. In yesterday’s press conference: ”Don’t rush me… I want a great deal.” The market is reading this as a president no longer feeling pressured by timelines, with the naval blockade running in the background.
#3: So far, the military activity is escalating, not de-escalating. Axios reports Iran is laying more mines in SoH. The US 3rd carrier strike group (USS George H.W. Bush) is arriving with two countermine vessels. Trump yesterday ordered the US Navy to destroy any Iranian boats caught laying mines. While CNN reports that the Pentagon is actively drawing up plans to strike Iranian SoH capabilities and individual Iranian military leaders if the ceasefire collapses. i.e., NOT a attitude consistent with an imminent deal!
Spot crude and product prices eased off the early-April highs on a combination of system rerouting and deal optimism. Both now weakening. Goldman estimates April Gulf output is reduced by 14.5 mbl/d, or 57% of pre-war supply, a number that keeps getting worse the longer this drags on.
Demand-side adaptation is ongoing: S. Korea has cut its Middle East crude dependence from 69% to 56% by pulling more from the Americas and Africa, and Japan is kicking off a second round of SPR releases from 1 May. But SPRs are finite.
Ref. to the negotiations, we should not bet on speed. The current Iranian leadership is dominated by genuine hardliners willing to absorb economic pain and run the clock to extract concessions. That is not a setup for a rapid resolution. US/Israeli media briefings keep framing the delay as ”internal Iranian divisions”, the reality is more complicated and points toward weeks and months, not days.
Our point is that the complexity is large, and higher prices have only just started (given a scenario where the negotiations drag out in time). The market spent April leaning on the USD 90/bl rest-of-year assumption; that case is diminishing by the hour. If ”early May reopening” is replaced by ”June, July or later” over the next week or two, both crude and products have meaningful room to reprice higher from here. There is a high risk being short energy and betting on any immediate political resolution(!).
Down on Friday. Up on Monday. The Brent June crude oil contract traded down 5.1% last week to a close of $90.38/b. It reached a high of $103.87/b last Monday and a low of $86.09/b on Friday as Iran announced that the Strait of Hormuz was fully open for transit. That quickly changed over the weekend as the US upheld its blockade of Iranian oil exports while Iran naturally responded by closing the SoH again. The US blew a hole in the engine room of the Iranian ship TOUSKA and took custody of the ship on Sunday. Brent crude is up 5.6% this morning to $95.4/b.
The cease-fire is expiring tomorrow. The US has said it will send a delegation for a second round of negotiations in Islamabad in Pakistan. But Iran has for now rejected a second round of talks as it views US demands as unrealistic and excessive while the US is also blocking the Strait of Hormuz.
While Brent is up 5% this morning, the financial market is still very optimistic that progress will be made. That talks will continue and that the SoH will fully open by the start of May which is consistent with a rest-of-year average Brent crude oil price of around $90/b with the market now trading that balance at around $88/b.
Financial optimism vs. physical deterioration. We have a divergence where the financial market is trading negotiations, improvements and resolution while at the same time the physical market is deteriorating day by day. Physical oil flows remain constrained by disrupted flows, longer voyage times and elevated freight and insurance costs.
Financial markets are betting that a US/Iranian resolution will save us in time from violent shortages down the road. But every day that the SoH remains closed is bringing us closer to a potentially very painful point of shortages and much higher prices.
The US blockade is also a weapon of leverage against its European and Asian allies. When Iran closed the SoH it held the world economy as a hostage against the US. The US blockade of the SoH is of course blocking Iranian oil exports. But it is also an action of disruption directed towards Europe and Asia. The US has called for the rest of the world to engaged in the war with Iran: ”If you want oil from the Persian Gulf, then go and get it”. A risk is that the US plays brinkmanship with the global oil market directed towards its European and Asian allies and maybe even towards China to force them to engage and take part. Maybe unthinkable. But unthinkable has become the norm with Trump in the White House.



Oil product price pain is set to rise as the Strait of Hormuz stays closed into summer

Solkraften pressar elpriserna dagtid

Michel Gubel ger sin syn på oljemarknaden

Svag vårflod dubblar elpriserna