Analys
SHB Råvarubrevet 18 november 2011
 Ytterligare upptrappning av skuldkrisen i Europa har lett till en kraftig av riskaversion vilket pressat råvarupriserna på bred front denna vecka. Brentolja exempelvis tappade 5 procent för att mot slutet av veckan återhämta sig något. Vikande lager på oljeprodukter, amerikanska destillatlager föll för 8e veckan i rad och är nu under historiskt snitt, har varit bidragande till en kraftig riskpremie på olja men vi ser nu att efterfrågan minskar i snabbare takt än lagernivåerna och det är inte omöjligt att vi sakta rör oss ned och testar 100 dollar nivån på brent innan årsskiftet. Vårt råvaruindex har tappat lite drygt 1.5 procent och är nu ned 0.66 procent på året.
På elmarknaden har de flesta faktorer verkat för nedsidan de senaste dagarna och närmaste kvartalet Q1 2012 har tappat 4.7 procent. Såväl fossila bränslen som väderlek har givit stöd åt säljarna och ser vi till väderprognoserna förväntas det vara blött och milt även under den kommande veckan. Senaste 10-dagars prognoser visar på nederbörd om upp till hela 9 TWh och ett temperaturöverskott om 3.3 grader. Det är för perioden bearish och spotpriset kan under dessa premisser inte stiga. Däremot tror vi att det mesta av överskottet nu skall vara diskonterat för så ett eventuellt väderomslag (även om det inför helgen inte verkar sannolikt i någon av de väderkörningar vi sett) kan ge en intressant öppning på uppsidan.
Metaller
LME index föll tillbaka 3 procent och en stark dollar bidrar till nedgången. Koppar finner nu stöd från ett starkt köpintresse på den fysiska marknaden. Lagren fortsätter att minska där LME lagren fallit med närmare 15 procent de senaste sex veckorna, även Shanghai lagren är ned. Intressanta dagar framöver vad gäller de fysiska premierna då de ledande gruvbolagen är i Asien för att förhandla premierna på den fysiska marknaden. Zink är en metall som kan komma att stiga nästa år. Kinesiska analyshuset Antaike räknar med att vi går från ett överskott till underskott av Zink under 2012 varpå Kina måste importera mer och ta från dagens höga lager. På kort sikt ser det dock ut som vi får räkna med sidledes rörelser på zinkmarknaden.
Gapet mellan marginalkostnaden för produktion och marknadspris är alltid intressant att följa på råvaror. Om vi tittar på Koppar och Aluminium tex så handlas Koppar på 7600 dollar och, aluminium runt 2100 dollar. Det innebär att Koppar handlas ca 90 procent över marginalkostnad för produktion, medan aluminium handlas ca 16 procent under marginalkostnad. Trots detta ökar efterfrågan på aluminium ungefär dubbelt så fort. Skillnaden är en stram utbudssituation på koppar. För att kopparskall ska handla kvar på nuvarande nivåer krävs därför fortsatt höga Kinesiska importsiffror och de som tror på Kinesisk inbromsning kanske hellre väljer att hålla aluminium och liknande metaller (där olönsam högkostnadsproduktion faller bort). De som har en något mer optimistisk syn på tillväxtmarknaden föredrar istället koppar eftersom en råvara med ett stramt utbud ger en större potential. Detta gäller även för olja och gas där oljepriset drivs av en stram balans där efterfrågan viker på högre nivåer medan gasefterfrågan växer snabbare och där utbudet mer än väl matchar denna tillväxt på efterfrågan.
Annars har det varit mest fokus på järnmalm som nu återhämtat lite av höstens kraftiga fall. En tillfällig rekyl på asiatiska stålpriser under veckan har förbättrat vinstmarginalerna något för de lokala stålverken och således stabiliserat insatsråvarorna. Spotpriset på järnmalm som föll 30 procent under september och oktober har sedan början av november stigit med 25 procent igen vilket återigen visar på ett intresse att säkra upp råvaror strategiskt så fort marknaden faller för mycket (även om bortfall av indiskt material på marknaden just i det är fallet varit starkt bidragande till uppgången). Kinesiska verk som dragit ner kapacitetsutnyttjande från 715 ton (juli) till 625 ton per år annualiserat, verkar finna lönsamhet på dessa nivåer men vi tror att effekterna av de senaste månadernas överkapacitet kommer att vara kännbara för stålpriserna, framför allt i Europa, en bra bit in på nästa år. Intressant att notera att Bank of China sätter upp en enhet för finansiell järnmalmshandel inom kort vilket är positivt eftersom det starkt kommer att bidra till likviditeten och utvecklingen av denna marknad. Vår förhoppning är naturligtvis att på sikt kunna erbjuda sparprodukter kopplade till stålsektorn (stål, järnmalm, frakt och kanske tom stenkol även om det senare är på mycket längre sikt) så fort marknaden är mogen och dessa går att handla kostnadseffektivt.
I Sverige och Finland råder en gruvboom tack vare den stora efterfrågan på järnmalm och metaller och under RMGs gruvkonferens i veckan fick vi en uppdatering kring några av alla de projekt som är på gång i regionen. Aldrig tidigare har det brutis så mycket malm i Sverige vilket ger effekter på sysselsättningen i Norr. I Pajala har gruvindustrins uppgång inneburit att kommunen som tidigare haft problem med avfolkning nu drabbats av bostadsbrist. Sammanlagt investerades 675 miljoner kronor 2010 i sökandet efter metaller och mineral i Sverige och under första halvan av 2011 ökade antalet ansökningar om undersökningstillstånd med 40 procent.
I runda tal brukar man säga att bara ett av 200 undersökningstillstånd leder till en ny gruva men det visar ändå på ett fortsatt stort intresse och idag letar cirka 100 bolag malm i Sverige. Kanske också är värt att notera att det tar ca 10 år från prospektering till färdig gruva (ytterligare 1-2 år för basmetaller) så det är en enorm utmaning att få till ny kapacitet för att möta den kraftiga tillväxten på efterfrågan (Kanada har exempelvis ett underskott på 100,000 kvalificerade gruvarbetare idag). Nedan finner ni några alla de gruvprojekt som är på gång i Norden:
Järnmalm
-Northland, LKAB, Northern Iron, Rana Gruber, Beowulf, Grängesberg, Scandinavian Resources, Nordic Iron, Dannemora
Koppar
-Avalon, Boliden, Kopparberg Mineral, Altona, Nussir
Guld
-Agnico-Eagle, Dragon Mines, Gold-Ore Resources, Lappland Goldminers, Endomines, Nordic Mines, Botnia Exploration, Store Norske, Arctic Gold, Blackstone
Övriga
-Talvivaara (Nickel), Continental Precious (Vanadium, Molybden, Uran, Nickel Mountain, Blackstone (Nickel, Koppar, Zink), Belvedere (Nickel), First Quantum (Nickel, Koppar), Anglo American (koppar, nickel, platina), Nordic Mining, Outokumpu, Tertiary Minerals, Gold Fields, Sotkamo Silver, Tasman Metals
Ädelmetaller
Guldet har inte undgått den nedåtgående trenden på råvarumarknaden utan har fallit närmare 3 procent. Flera påtvingade likvidationer på terminsmarknaden har bidragit till nedgången. Den fysiska efterfrågan är å andra sidan fortsatt stark. Världens största guld ETF, SPDR Gold trust, har registrerat inflöden och det verkar således som långsiktiga investerare ser detta som ett köptillfälle. Guldtackor och guldmynt blir alltmer populära där efterfrågan under tredje kvartalet nådde rekordnivåer enligt World Gold Council. Vi tror fortsatt att investerare väljer att söka skydd i guld vilket ger stöd åt prisbilden. Vidare meddelade Ben Bernanke förra veckan att nuvarande klimat sannolikt kommer att ”motivera exceptionellt låga nivåer för styrräntan åtminstone genom mitten av 2013”. Detta kommer troligtvis innebära att den reala räntan (räntan en investerare får på en amerikansk statsskuldväxel efter inflationen) är fortsatt negativ de kommande 12-18 månaderna. Guldinvesterare har historiskt gynnats av låg till negativ ränta. Ser vi tillbaka till 1970-talet har guldet haft en positiv avkastning YoY när realräntan fallit under 2 procent, och ju lägre desto bättre för guld.
Livsmedel
Kaffepriset har återhämtat sig och handlas nu strax under 235 cent (+5 procent i november). Nederbörd lång under normalen i de kafferika delarna av Braslien är den främsta orsaken till prisuppgången. International Coffee Organisation hade redan sedan tidigare reviderat ned sin prognos för 2011/2012 från 129.5 miljoner bags till (1 bag= 60 kg) till 127.4 miljoner bags. I centralamerika har man problem med för mycket regn där skörden under oktober var 19% lägre YoY. Vidare har Colombianska kaffeförbundet nyligen reviderat ned skördeprognoserna för 2012 med 23 procent. Det som balanserar prisbilden något är att de nya högavkastande Brasilianska bönorna är av god kvalite (2-års cykler) så svårt att se at priset springer i väg upp till tidigare höga strax under 300 cent men risken är helt klart på uppsidan.
Terminspriser på vete stängde ned för veckan som helhet i både Chicago och Paris. Nedgången är starkt påverkad av ökad oro för både den amerikanska och den europeiska exporten. Brittiskt fodervete lär ha exporterats till USA vilket ytterligare bevisar det amerikanska vetets dåliga konkurrenskraft. Oroande för Frankrike är att deras annars väldigt lojala köpare Algeriet i veckan köpt 500.000 ton sydamerikanskt vete. Fortsatt uppjusterade förväntningar för den australiensiska veteskörden, med eventuell rekordhög export, har även det bidragit till nedgången. Ryska höstvetet har gått in i vintervila utan ett skyddande snölager, men det finns än så länge inga skäl till oro. Med fortsatt god tillgång på vete, ökad konkurrens på exportmarknaden samt minskat stöd från majsen kan vetet fortsätta ned.
Majsen i Chicago har gått ned kraftigt i veckan, inte minst på grund av usla amerikanska exportsiffror för tredje veckan i rad – konkurrensen är hård från både majs och fodervete från främst Ukraina och Australien. Fokus kommer ligga på den fortsatta utvecklingen för den amerikanska exporten och väderutvecklingen i Sydamerika fram tills januari då nästa stora USDA-rapport publiceras. Med nuvarande goda väderutveckling i Sydamerika och hård konkurrens från andra länder bör majsen kunna fortsätta nedåt – nedgången kommer dock begränsas av fortsatt osäkerhet kring den amerikanska avkastningsnivån, låga amerikanska lagernivåer och även i fortsättningen påverkas av utvecklingen för den globala ekonomin.
Sojapriserna i Chicago är i stort sett oförändrade sedan förra torsdagen. Priserna har pressats nedåt av lägre majspriser och lägre priser på råolja men har fått stöd av ökat köpintresse från Kina – som i veckan köpt 420.000 ton sojabönor från USA. Förväntningarna på Kinas totala import av sojabönor säsongen 2011/12 har dessutom justerats upp till rekordhöga 58,5 miljoner ton. Fokus kommer framöver läggas på den fortsatta efterfrågan från Kina och väderutvecklingen i Sydamerika. Förväntningarna är väldigt höga på den sydamerikanska skörden och minsta lilla försämring kan få priserna att stiga igen. Den brasilianska sådden är till 66 procent klar och den argentinska till 30 procent. Prisutvecklingen kommer dock fortsätta påverkas av utvecklingen av skuldkrisen i EU.
Handelsbankens Råvaruindex
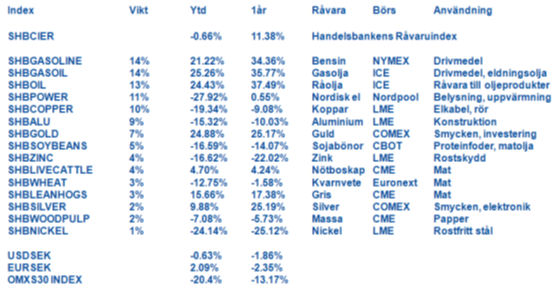
Handelsbankens råvaruindex består av de underliggande indexen för respektive råvara. Vikterna är bestämda till hälften från värdet av global produktion och till hälften från likviditeten i terminskontrakten.
[box]SHB Råvarubrevet är producerat av Handelsbanken och publiceras i samarbete och med tillstånd på Råvarumarknaden.se[/box]
Ansvarsbegränsning
Detta material är producerat av Svenska Handelsbanken AB (publ) i fortsättningen kallad Handelsbanken. De som arbetar med innehållet är inte analytiker och materialet är inte oberoende investeringsanalys. Innehållet är uteslutande avsett för kunder i Sverige. Syftet är att ge en allmän information till Handelsbankens kunder och utgör inte ett personligt investeringsråd eller en personlig rekommendation. Informationen ska inte ensamt utgöra underlag för investeringsbeslut. Kunder bör inhämta råd från sina rådgivare och basera sina investeringsbeslut utifrån egen erfarenhet.
Informationen i materialet kan ändras och också avvika från de åsikter som uttrycks i oberoende investeringsanalyser från Handelsbanken. Informationen grundar sig på allmänt tillgänglig information och är hämtad från källor som bedöms som tillförlitliga, men riktigheten kan inte garanteras och informationen kan vara ofullständig eller nedkortad. Ingen del av förslaget får reproduceras eller distribueras till någon annan person utan att Handelsbanken dessförinnan lämnat sitt skriftliga medgivande. Handelsbanken ansvarar inte för att materialet används på ett sätt som strider mot förbudet mot vidarebefordran eller offentliggörs i strid med bankens regler.
Finansiellt instruments historiska avkastning är inte en garanti för framtida avkastning. Värdet på finansiella instrument kan både öka och minska och det är inte säkert att du får tillbaka hela det investerade kapitalet.
Analys
Brent crude ticks higher on tension, but market structure stays soft

Brent crude has climbed roughly USD 1.5-2 per barrel since Friday, yet falling USD 0.3 per barrel this mornig and currently trading near USD 67.25/bbl after yesterday’s climb. While the rally reflects short-term geopolitical tension, price action has been choppy, and crude remains locked in a broader range – caught between supply-side pressure and spot resilience.

Prices have been supported by renewed Ukrainian drone strikes targeting Russian infrastructure. Over the weekend, falling debris triggered a fire at the 20mtpa Kirishi refinery, following last week’s attack on the key Primorsk terminal.
Argus estimates that these attacks have halted ish 300 kbl/d of Russian refining capacity in August and September. While the market impact is limited for now, the action signals Kyiv’s growing willingness to disrupt oil flows – supporting a soft geopolitical floor under prices.
The political environment is shifting: the EU is reportedly considering sanctions on Indian and Chinese firms facilitating Russian crude flows, while the U.S. has so far held back – despite Bessent warning that any action from Washington depends on broader European participation. Senator Graham has also publicly criticized NATO members like Slovakia and Hungary for continuing Russian oil imports.
It’s worth noting that China and India remain the two largest buyers of Russian barrels since the invasion of Ukraine. While New Delhi has been hit with 50% secondary tariffs, Beijing has been spared so far.
Still, the broader supply/demand balance leans bearish. Futures markets reflect this: Brent’s prompt spread (gauge of near-term tightness) has narrowed to the current USD 0.42/bl, down from USD 0.96/bl two months ago, pointing to weakening backwardation.
This aligns with expectations for a record surplus in 2026, largely driven by the faster-than-anticipated return of OPEC+ barrels to market. OPEC+ is gathering in Vienna this week to begin revising member production capacity estimates – setting the stage for new output baselines from 2027. The group aims to agree on how to define “maximum sustainable capacity,” with a proposal expected by year-end.
While the IEA pegs OPEC+ capacity at 47.9 million barrels per day, actual output in August was only 42.4 million barrels per day. Disagreements over data and quota fairness (especially from Iraq and Nigeria) have already delayed this process. Angola even quit the group last year after being assigned a lower target than expected. It also remains unclear whether Russia and Iraq can regain earlier output levels due to infrastructure constraints.
Also, macro remains another key driver this week. A 25bp Fed rate cut is widely expected tomorrow (Wednesday), and commodities in general could benefit a potential cut.
Summing up: Brent crude continues to drift sideways, finding near-term support from geopolitics and refining strength. But with surplus building and market structure softening, the upside may remain capped.
Analys
Volatile but going nowhere. Brent crude circles USD 66 as market weighs surplus vs risk

Brent crude is essentially flat on the week, but after a volatile ride. Prices started Monday near USD 65.5/bl, climbed steadily to a mid-week high of USD 67.8/bl on Wednesday evening, before falling sharply – losing about USD 2/bl during Thursday’s session.

Brent is currently trading around USD 65.8/bl, right back where it began. The volatility reflects the market’s ongoing struggle to balance growing surplus risks against persistent geopolitical uncertainty and resilient refined product margins. Thursday’s slide snapped a three-day rally and came largely in response to a string of bearish signals, most notably from the IEA’s updated short-term outlook.
The IEA now projects record global oversupply in 2026, reinforcing concerns flagged earlier by the U.S. EIA, which already sees inventories building this quarter. The forecast comes just days after OPEC+ confirmed it will continue returning idle barrels to the market in October – albeit at a slower pace of +137,000 bl/d. While modest, the move underscores a steady push to reclaim market share and adds to supply-side pressure into year-end.
Thursday’s price drop also followed geopolitical incidences: Israeli airstrikes reportedly targeted Hamas leadership in Doha, while Russian drones crossed into Polish airspace – events that initially sent crude higher as traders covered short positions.
Yet, sentiment remains broadly cautious. Strong refining margins and low inventories at key pricing hubs like Europe continue to support the downside. Chinese stockpiling of discounted Russian barrels and tightness in refined product markets – especially diesel – are also lending support.
On the demand side, the IEA revised up its 2025 global demand growth forecast by 60,000 bl/d to 740,000 bl/d YoY, while leaving 2026 unchanged at 698,000 bl/d. Interestingly, the agency also signaled that its next long-term report could show global oil demand rising through 2050.
Meanwhile, OPEC offered a contrasting view in its latest Monthly Oil Market Report, maintaining expectations for a supply deficit both this year and next, even as its members raise output. The group kept its demand growth estimates for 2025 and 2026 unchanged at 1.29 million bl/d and 1.38 million bl/d, respectively.
We continue to watch whether the bearish supply outlook will outweigh geopolitical risk, and if Brent can continue to find support above USD 65/bl – a level increasingly seen as a soft floor for OPEC+ policy.
Analys
Waiting for the surplus while we worry about Israel and Qatar

Brent crude makes some gains as Israel’s attack on Hamas in Qatar rattles markets. Brent crude spiked to a high of USD 67.38/b yesterday as Israel made a strike on Hamas in Qatar. But it wasn’t able to hold on to that level and only closed up 0.6% in the end at USD 66.39/b. This morning it is starting on the up with a gain of 0.9% at USD 67/b. Still rattled by Israel’s attack on Hamas in Qatar yesterday. Brent is getting some help on the margin this morning with Asian equities higher and copper gaining half a percent. But the dark cloud of surplus ahead is nonetheless hanging over the market with Brent trading two dollar lower than last Tuesday.

Geopolitical risk premiums in oil rarely lasts long unless actual supply disruption kicks in. While Israel’s attack on Hamas in Qatar is shocking, the geopolitical risk lifting crude oil yesterday and this morning is unlikely to last very long as such geopolitical risk premiums usually do not last long unless real disruption kicks in.
US API data yesterday indicated a US crude and product stock build last week of 3.1 mb. The US API last evening released partial US oil inventory data indicating that US crude stocks rose 1.3 mb and middle distillates rose 1.5 mb while gasoline rose 0.3 mb. In total a bit more than 3 mb increase. US crude and product stocks usually rise around 1 mb per week this time of year. So US commercial crude and product stock rose 2 mb over the past week adjusted for the seasonal norm. Official and complete data are due today at 16:30.
A 2 mb/week seasonally adj. US stock build implies a 1 – 1.4 mb/d global surplus if it is persistent. Assume that if the global oil market is running a surplus then some 20% to 30% of that surplus ends up in US commercial inventories. A 2 mb seasonally adjusted inventory build equals 286 kb/d. Divide by 0.2 to 0.3 and we get an implied global surplus of 950 kb/d to 1430 kb/d. A 2 mb/week seasonally adjusted build in US oil inventories is close to noise unless it is a persistent pattern every week.
US IEA STEO oil report: Robust surplus ahead and Brent averaging USD 51/b in 2026. The US EIA yesterday released its monthly STEO oil report. It projected a large and persistent surplus ahead. It estimates a global surplus of 2.2 m/d from September to December this year. A 2.4 mb/d surplus in Q1-26 and an average surplus for 2026 of 1.6 mb/d resulting in an average Brent crude oil price of USD 51/b next year. And that includes an assumption where OPEC crude oil production only averages 27.8 mb/d in 2026 versus 27.0 mb/d in 2024 and 28.6 mb/d in August.
Brent will feel the bear-pressure once US/OECD stocks starts visible build. In the meanwhile the oil market sits waiting for this projected surplus to materialize in US and OECD inventories. Once they visibly starts to build on a consistent basis, then Brent crude will likely quickly lose altitude. And unless some unforeseen supply disruption kicks in, it is bound to happen.
US IEA STEO September report. In total not much different than it was in January
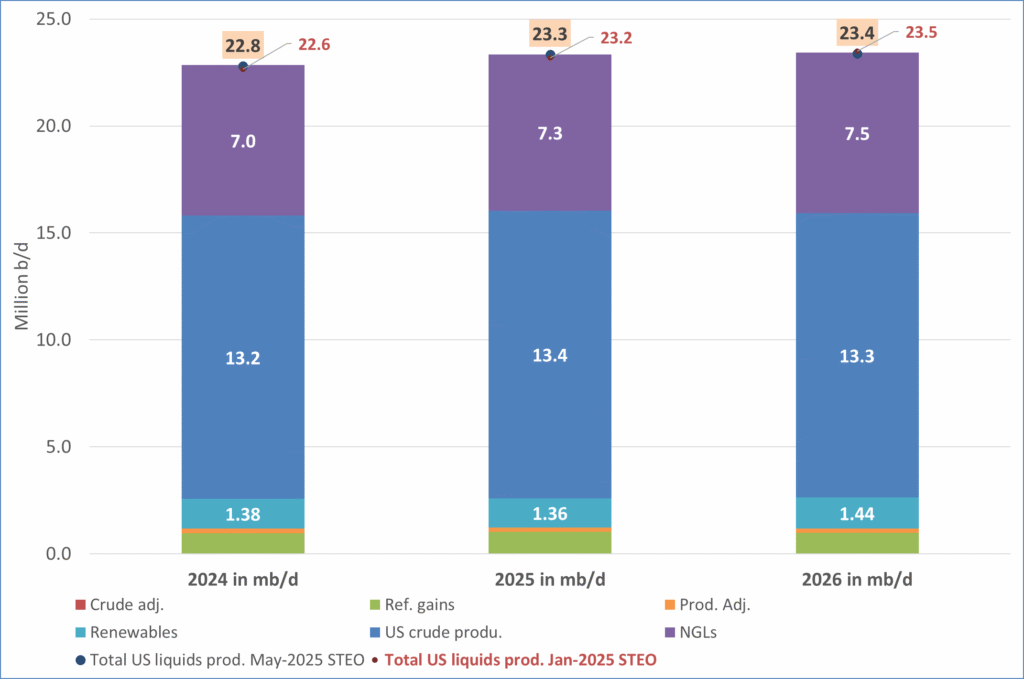
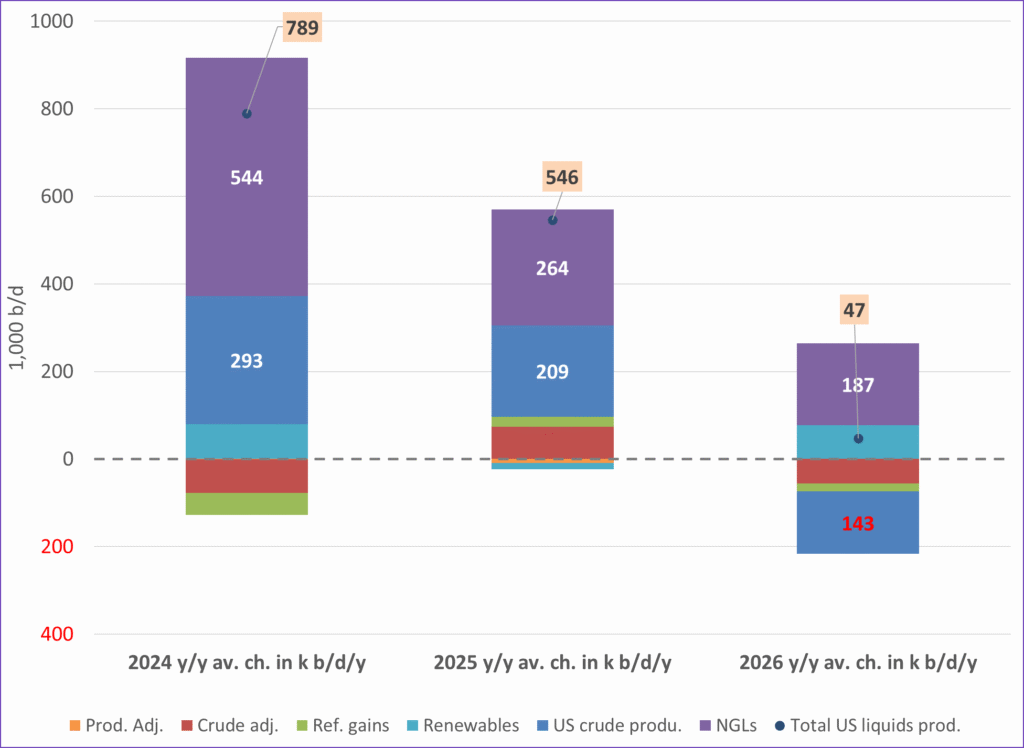
US IEA STEO September report. US crude oil production contracting in 2026, but NGLs still growing. Close to zero net liquids growth in total.
-

 Nyheter4 veckor sedan
Meta bygger ett AI-datacenter på 5 GW och 2,25 GW gaskraftverk
-

 Nyheter4 veckor sedan
Aker BP gör ett av Norges största oljefynd på ett decennium, stärker resurserna i Yggdrasilområdet
-

 Nyheter4 veckor sedan
Sommarens torka kan ge högre elpriser i höst
-

 Analys4 veckor sedan
Brent edges higher as India–Russia oil trade draws U.S. ire and Powell takes the stage at Jackson Hole
-

 Nyheter3 veckor sedan
Mahvie Minerals är verksamt i guldrikt område i Finland
-

 Analys3 veckor sedan
Increasing risk that OPEC+ will unwind the last 1.65 mb/d of cuts when they meet on 7 September
-

 Nyheter3 veckor sedan
Neil Atkinson spår att priset på olja kommer att stiga till 70 USD
-

 Analys2 veckor sedan
OPEC+ in a process of retaking market share


