Analys
SHB Råvarubrevet 14 september 2012
 Råvaror Allmänt
FED överträffade marknadens förväntningar
Amerikanska centralbanken, FED överträffade marknadens förväntningar i torsdags. Fed kommer att stödköpa 40 Mdr USD per månad i bostadsobligationer samt kommer hålla räntan låg till mitten av 2015. Så långt var allt enligt förväntansbilden. Över förväntan var däremot ”tonen” från FED som indi-kerade att återköp pågår tills dess att arbetsmarknaden återhämtat sig samt att återköp kommer fort-sätta även om BNP-tillväxt går upp mot 3-3.5%, det står klart att FED är beredd att överskjuta på inflationsmålet.
För råvaror betyder det att marknaden får stimulativt stöd under en längre tid och vi förväntar oss nu en råvarumarknad som ”glider” uppåt under de kommande månaderna. Guld och silver brukar vara det som mest gynnas av ”oortodox” penningpolitik.
Basmetallerna
Basmetallerna på fortsatt uppgång
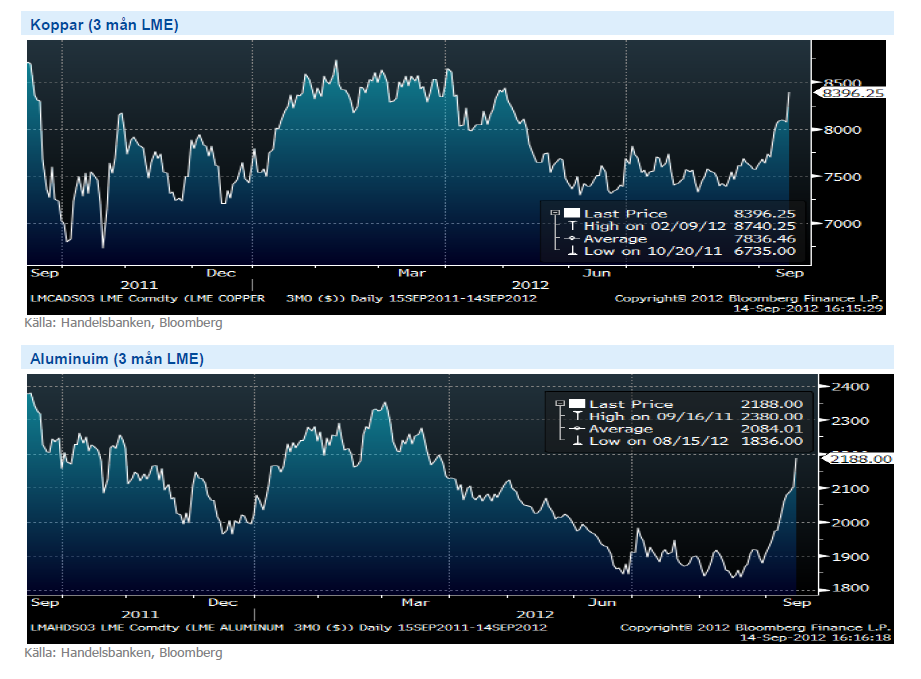
Basmetallerna fick sig en rejäl skjuts uppåt under veckan. Metallerna fick hjälp av det allmänna risksentimentet i början av veckan och fick givetvis ytterligare dragkraft när QE3 annonserades igår kväll.
Priserna är upp cirka 6 % i genomsnitt med aluminium och nickel som draglok medan koppar agerade sänke. Något som kan stödja speciellt zink- och aluminiummarknaderna framöver är rapporter om minskat utbud. Rusal, världens största aluminiumproducent, har drabbats av höga energikostnader vilket gör att de kommer dra produktionen med 3 %. Zinkproducenter i Kina har även de dragit ned produktionen till nioårslägsta. Vi är fortsatt positiva till basmetaller eftersom vi tror att stimulansåtgärderna nu kommer sprida sig i den reala ekonomin och dra upp priserna ytterligare.
Kinas makrodata har ännu inte bjudit på positiva överraskningar men Kinas dåliga konjunktur är nu inprisad i råvarorna och de faller inte när kinadata kommer ut. Vi tycker att basmetallerna, som har 50 % exponering mot Kina, handlas på attraktiva nivåer och de bjuder på en intressant uppsida när Kinas konjunkturåterhämtning kommer. Vi ser även att den positiva riskaptiten, drivet av centralbankernas stimulanser ger stöd åt prisbilden. Vi tror på: BULL BASMET H
Ädelmetaller
Rally på ädelmetaller
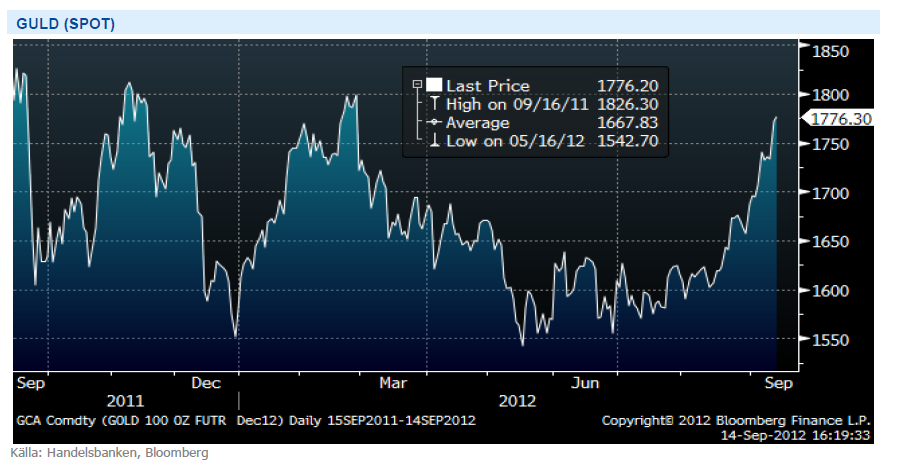
Feds besked igår kväll har – trots att marknaden handlat positivt inför det – ytterligare eldat på rallyt i ädelmetaller. Guldet handlar nu 1 775 doller per uns, mindre än 10 dollar från årshögsta noterat i februari, att jämföra med maj då det noterade 1 540 usd per uns. Sedan mitten på augusti, då Fed-protokollet antydde ytterligare kvantitativa lättnader har guldet stigit med 11 %.
Vi ser fortfarande utrymme för vidare prisstegring på ädelmetaller, dels drivet av ett allmänt metall-rally, dels av det faktum att guld och silver historiskt gynnats mest av den typ av stimulans Fed ägnar sig åt för tillfälet. Trots att vi handlat på QE-förväntningar under ganska lång tid bedömer vi att marknaden har gott om utrymme kvar på uppsidan då euro-krisen varit det genomgående temat ända sedan i våras.
Feds bekräftade stimulansåtgärder kommer att ge fortsatt stöd åt ädelmetallerna, lett av guld. Vi tror på: ADELMET H
Energi
Vått väder pressar elpriset
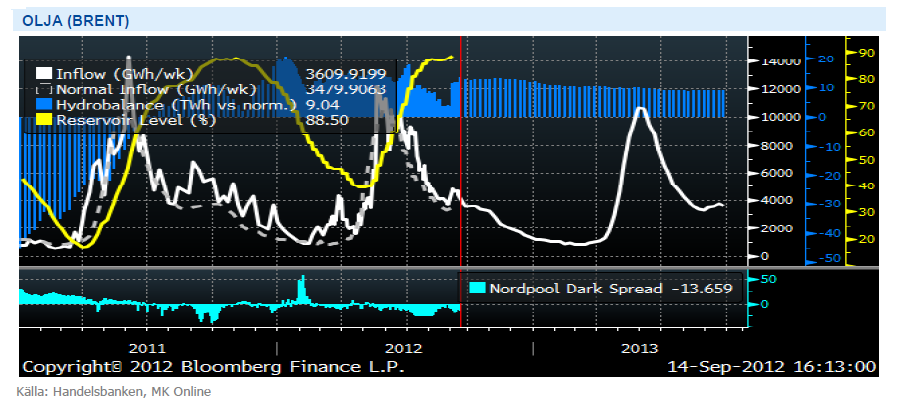
Den våta vädertrenden består och nordisk el tappar närmare 3 procent under veckan till 41.35 euro/MWh för kvartalskontraktet Q1 2013. Prognoserna pekar idag fredag på nya nederbördsmängder om 2-3 TWh över normal nivå för det kommande tio dagarna vilket i kombination med låga spotpriser, utsläppskostnader och en pressad energikolsmarknad gör att vi potentiellt kan fortsätta ned till strax under 40 nivån för Q1 2013.
Brytpriset for kolgenererad kraft, vilket brukar fungera som stöd, ligger på ca 38 euro men vi har svårt att det skall gå ändå dit eftersom vi har långt fram till vintern där man ofta söker en riskpremie för eventuell kyla och bortfall av kärnkraft. Som vi skrev i förra brevet finns det egentligen ingen faktor som pekar upp så länge vädret inte slår om till extremt torrt eller kolet finner styrka. Vi tror däremot att marknaden diskonterat för de nederbördsmängder som väntas och ligger kvar med neutral till kort position om det visar sig att hela den förväntade nederbördsmängden faller ut.
Feds tillkännagivande i kombination med politisk oro i samband med antiamerikanska protester driver Brent-oljan upp över 117 dollar mot slutet av veckan. Detta är den högsta nivån på över 4 månader. En ny omgång stödköp av räntepapper ger stöd åt oljemarknaden och vi får räkna med att oroligheterna kring Libyen, Yemen och övriga oljeproducerande länder i området kommer ge upphov till en varaktig riskpremie på marknaden. Däremot förväntas produktionen av Nordsjöolja öka med uppemot 25 procent under de kommande 4-6 veckorna till 2 miljoner fat vilket inte är så värst stora volymer men ändå tillräckligt för att reducera känsligheten för störningar på produktionssidan (och dessutom leda till att spreaden mellan wti och brent, 17.2 dollar, går ihop något. Vi förväntar oss nu att priset stabiliseras varför vi ändrar vår syn från lång till neutral.
Olja är den mest finansiellt handlade råvaran, fortsatta störningar på utbudssidan i kombination med ökad risk-vilja hos investerare efter ECBs och Feds aktioner kan driva olja ytterligare. Vi bedömer dock att det finns en finansiellt driven riskpremie i oljan på grund av oron kring Israels krigsvilja, denna kan snabbt pysa ut om situationen lugnar ner sig. Vi är därför neutrala till oljan.
Livsmedel
Torka i Brasilien – priset på kaffe stiger
Inga större rörelser på Vetemarknaden men Majs tappade däremot 2 procent under veckan efter att USDA justerat upp ingående lager säsongen 2012/2013 vilket var en följd av att den majs som skördats innan 1a september läggs till föregående säsongs skörd. Det vi reagerade mest på i rapporten var att man inte ens justerade ned siffran för Australien, de officiella Australiensiska siffrorna ligger idag på 22.5 miljoner ton medan USDA noterar 26 miljoner ton i sin rapport. Under årets Baltic Grain Exchange konferens i Köpenhamn talade vi med flertalet större aktörer som bekräftade svårigheten att finna fysiskt material på marknaden för de som måste köpa, detta kan resultera i ytterligare en prisuppgång under de kommande veckorna.
Oförändrade siffror från USDA i veckan vad gäller apelsinskörden 2011-12. Efterfrågan på apelsinjuice är fortsättningsvis låg, skördarna goda och hittills har inte odlingsområdena kring Florida drabbats av den rådande orkansäsongen. Antalet namngivna orkaner är något fler denna orkansäsong jämfört med föregående år vilket marknaden är väl medveten om och man kan de senaste veckorna se sambandet mellan priset och de kraftigare orkanernas rörelser.
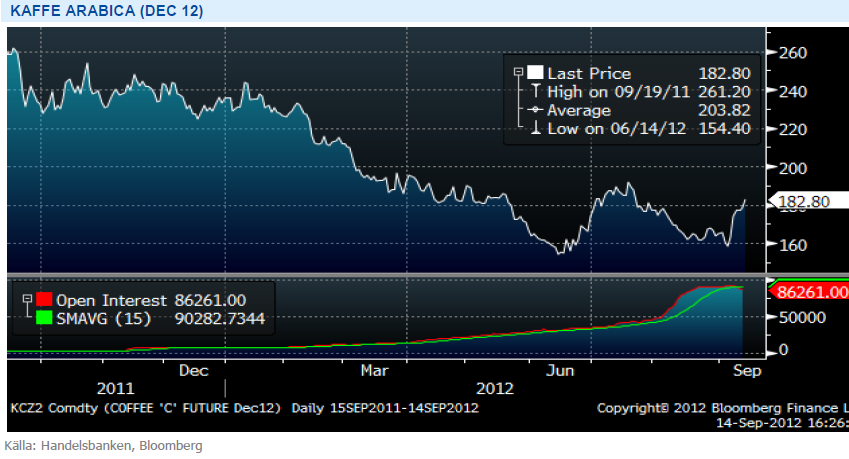
Torka i Brasilien vilket kan komma att påverka den kommande skörden negativt har fått priset på Arabica kaffe att stiga under veckan. Mer nederbörd behövs de kommande veckorna för att optimera skörden och i dagsläget ser 10dygns prognosen inte lovande ut. Man ska också komma ihåg att vi nu står inför den lägre producerande Brasilianska skörden (två års skördecykel). Colombia, näst största producent av Arabica kaffe, har drabbats av ogynnsamma väderförhållanden och dåliga skördar de senaste 4 åren. En svagare El Nino skulle kunna vara gynnsamt för den kommande skörden. Positiva siffror i juli talar för en ökning av den totala colombianska skörden som avslutas i slutet av september (jämfört med året innan som producerade färre än 8M säckar). De senaste 50 åren har den genomsnittliga skörden av arabicabönor i Colombia varit 11M 60kg säckar.
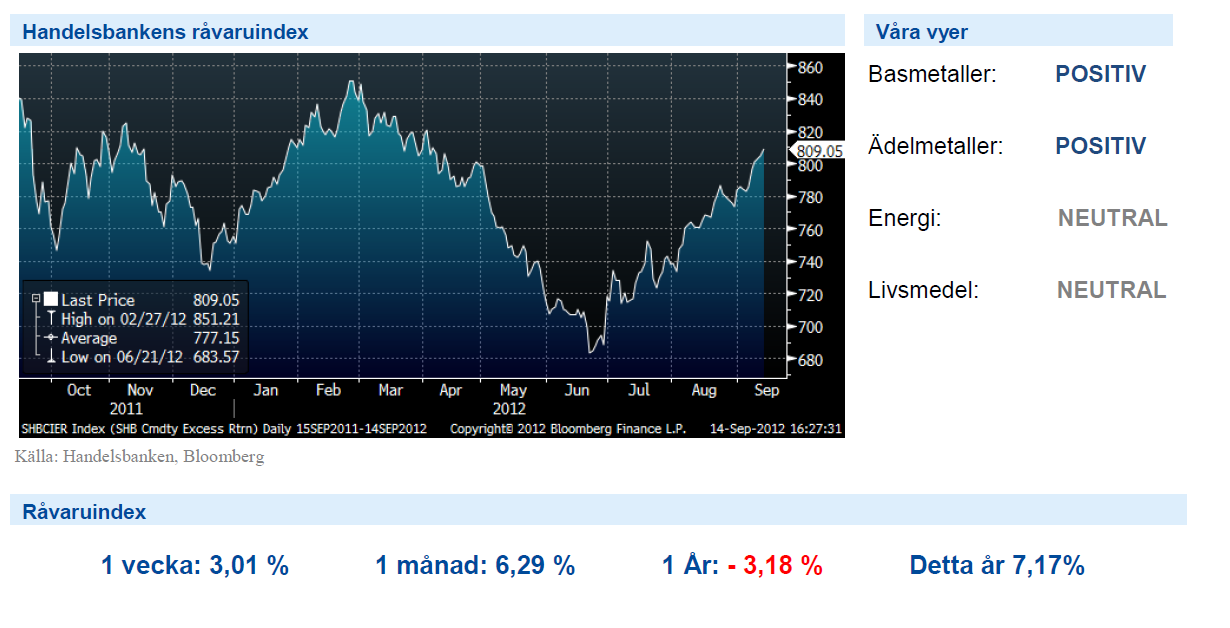
Handelsbankens Råvaruindex
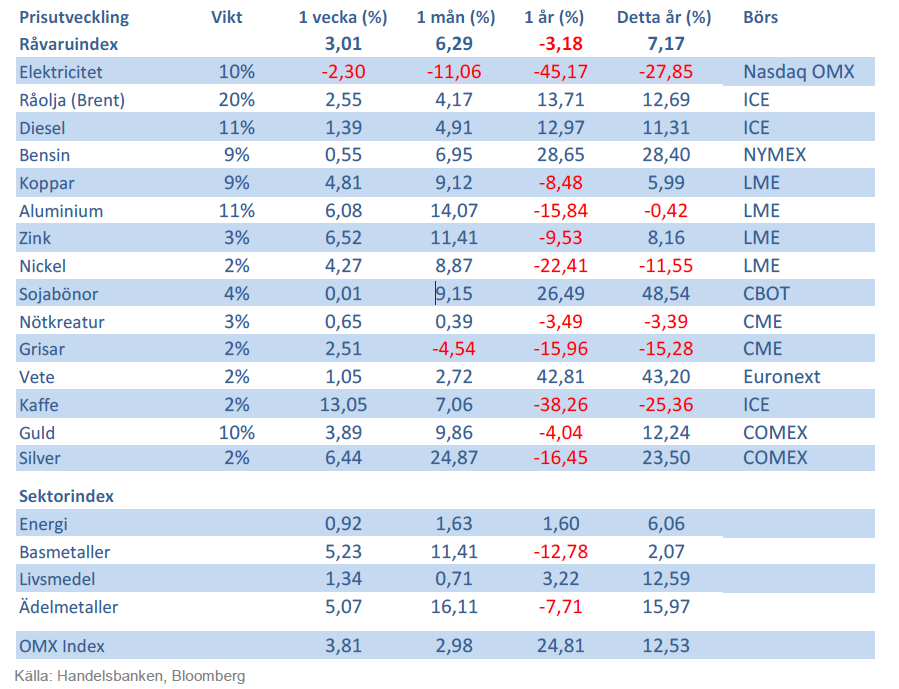
Handelsbankens råvaruindex består av de underliggande indexen för respektive råvara. Vikterna är bestämda till hälften från värdet av global produktion och till hälften från likviditeten i terminskontrakten.
[box]SHB Råvarubrevet är producerat av Handelsbanken och publiceras i samarbete och med tillstånd på Råvarumarknaden.se[/box]
Ansvarsbegränsning
Detta material är producerat av Svenska Handelsbanken AB (publ) i fortsättningen kallad Handelsbanken. De som arbetar med innehållet är inte analytiker och materialet är inte oberoende investeringsanalys. Innehållet är uteslutande avsett för kunder i Sverige. Syftet är att ge en allmän information till Handelsbankens kunder och utgör inte ett personligt investeringsråd eller en personlig rekommendation. Informationen ska inte ensamt utgöra underlag för investeringsbeslut. Kunder bör inhämta råd från sina rådgivare och basera sina investeringsbeslut utifrån egen erfarenhet.
Informationen i materialet kan ändras och också avvika från de åsikter som uttrycks i oberoende investeringsanalyser från Handelsbanken. Informationen grundar sig på allmänt tillgänglig information och är hämtad från källor som bedöms som tillförlitliga, men riktigheten kan inte garanteras och informationen kan vara ofullständig eller nedkortad. Ingen del av förslaget får reproduceras eller distribueras till någon annan person utan att Handelsbanken dessförinnan lämnat sitt skriftliga medgivande. Handelsbanken ansvarar inte för att materialet används på ett sätt som strider mot förbudet mot vidarebefordran eller offentliggörs i strid med bankens regler.
Analys
Also OPEC+ wants to get compensation for inflation

Brent crude has fallen USD 3/b since the peak of Iran-Israel concerns last week. Still lots of talk about significant Mid-East risk premium in the current oil price. But OPEC+ is in no way anywhere close to loosing control of the oil market. Thus what will really matter is what OPEC+ decides to do in June with respect to production in Q3-24 and the market knows this very well. Saudi Arabia’s social cost-break-even is estimated at USD 100/b today. Also Saudi Arabia’s purse is hurt by 21% US inflation since Jan 2020. Saudi needs more money to make ends meet. Why shouldn’t they get a higher nominal pay as everyone else. Saudi will ask for it

Brent is down USD 3/b vs. last week as the immediate risk for Iran-Israel has faded. But risk is far from over says experts. The Brent crude oil price has fallen 3% to now USD 87.3/b since it became clear that Israel was willing to restrain itself with only a muted counter attack versus Israel while Iran at the same time totally played down the counterattack by Israel. The hope now is of course that that was the end of it. The real fear has now receded for the scenario where Israeli and Iranian exchanges of rockets and drones would escalate to a point where also the US is dragged into it with Mid East oil supply being hurt in the end. Not everyone are as optimistic. Professor Meir Javedanfar who teaches Iranian-Israeli studies in Israel instead judges that ”this is just the beginning” and that they sooner or later will confront each other again according to NYT. While the the tension between Iran and Israel has faded significantly, the pain and anger spiraling out of destruction of Gaza will however close to guarantee that bombs and military strifes will take place left, right and center in the Middle East going forward.
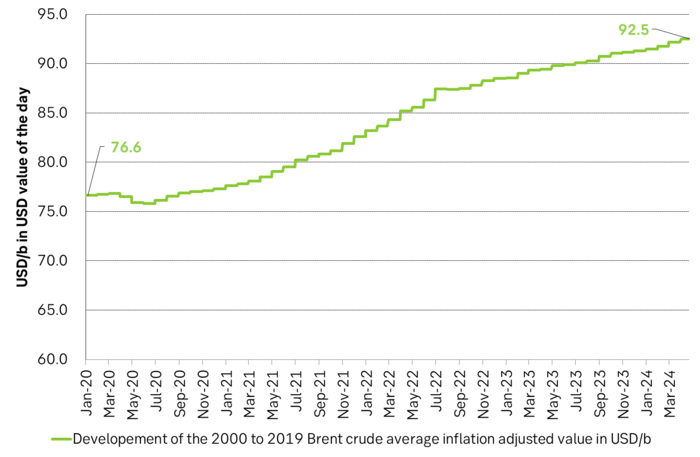
Also OPEC+ wants to get paid. At the start of 2020 the 20 year inflation adjusted average Brent crude price stood at USD 76.6/b. If we keep the averaging period fixed and move forward till today that inflation adjusted average has risen to USD 92.5/b. So when OPEC looks in its purse and income stream it today needs a 21% higher oil price than in January 2020 in order to make ends meet and OPEC(+) is working hard to get it.
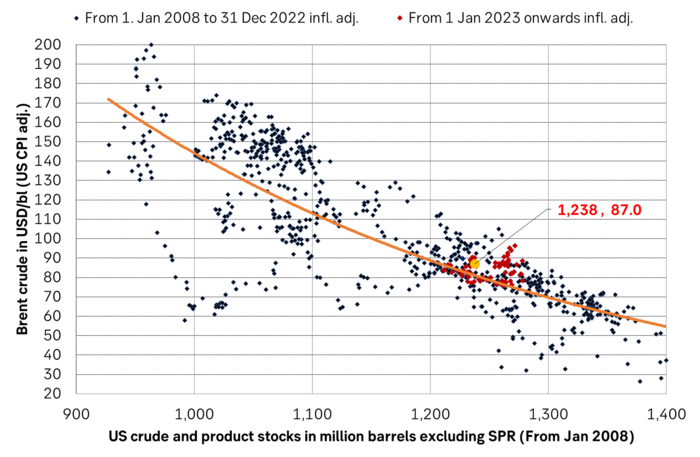
Much talk about Mid-East risk premium of USD 5-10-25/b. But OPEC+ is in control so why does it matter. There is much talk these days that there is a significant risk premium in Brent crude these days and that it could evaporate if the erratic state of the Middle East as well as Ukraine/Russia settles down. With the latest gains in US oil inventories one could maybe argue that there is a USD 5/b risk premium versus total US commercial crude and product inventories in the Brent crude oil price today. But what really matters for the oil price is what OPEC+ decides to do in June with respect to Q3-24 production. We are in no doubt that the group will steer this market to where they want it also in Q3-24. If there is a little bit too much oil in the market versus demand then they will trim supply accordingly.
Also OPEC+ wants to make ends meet. The 20-year real average Brent price from 2000 to 2019 stood at USD 76.6/b in Jan 2020. That same averaging period is today at USD 92.5/b in today’s money value. OPEC+ needs a higher nominal price to make ends meet and they will work hard to get it.
Inflation adjusted Brent crude price versus total US commercial crude and product stocks. A bit above the regression line. Maybe USD 5/b risk premium. But type of inventories matter. Latest big gains were in Propane and Other oils and not so much in crude and products
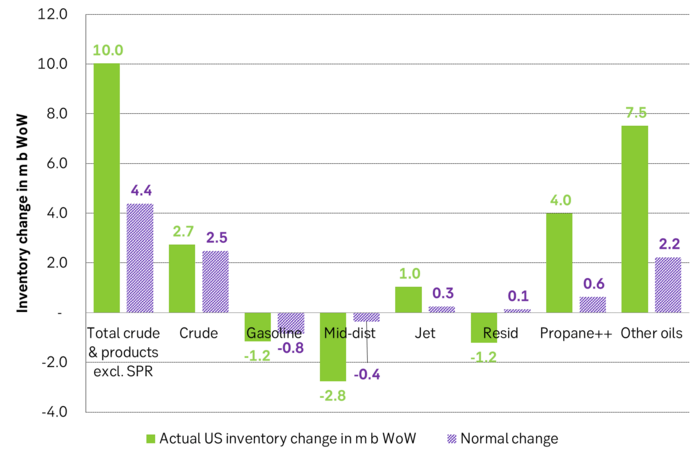
Total US commercial crude and product stocks usually rise by 4-5 m b per week this time of year. Gains have been very strong lately, but mostly in Propane and Other oils

Last week’s US inventory data. Big rise of 10 m b in commercial inventories. What really stands out is the big gains in Propane and Other oils
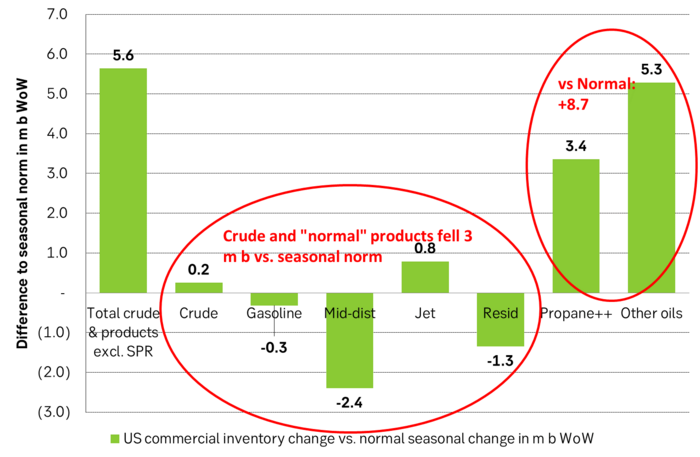
Take actual changes minus normal seasonal changes we find that US commercial crude and regular products like diesel, gasoline, jet and bunker oil actually fell 3 m b versus normal change.
Analys
Nat gas to EUA correlation will likely switch to negative in 2026/27 onward

Historically positive Nat gas to EUA correlation will likely switch to negative in 2026/27 onward

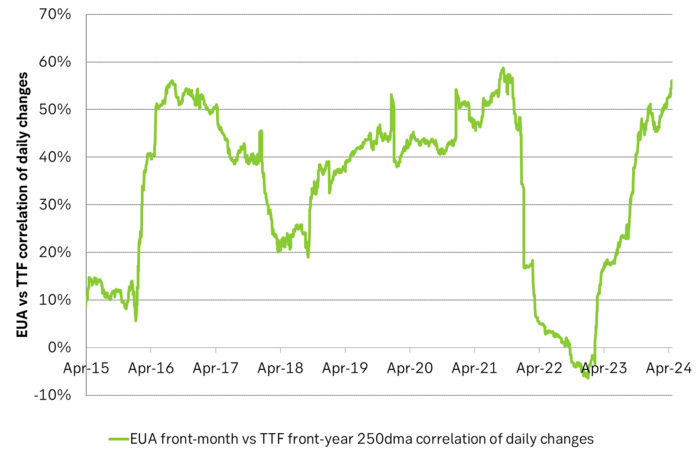
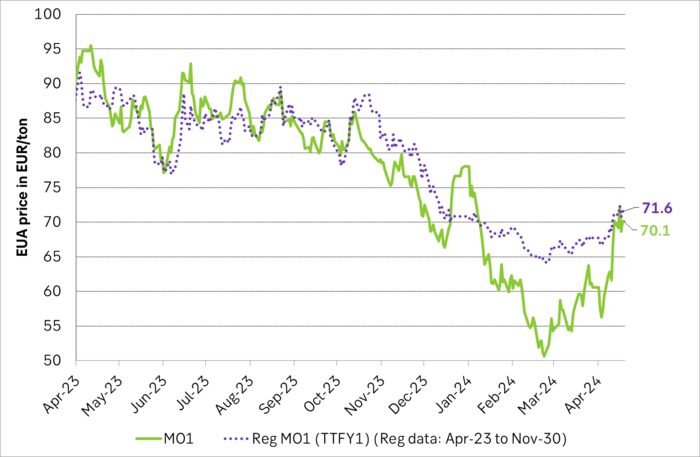
Historically there has been a strong, positive correlation between EUAs and nat gas prices. That correlation is still fully intact and possibly even stronger than ever as traders increasingly takes this correlation as a given with possible amplification through trading action.
The correlation broke down in 2022 as nat gas prices went ballistic but overall the relationship has been very strong for quite a few years.
The correlation between nat gas and EUAs should be positive as long as there is a dynamical mix of coal and gas in EU power sector and the EUA market is neither too tight nor too weak:
Nat gas price UP => ”you go black” by using more coal => higher emissions => EUA price UP
But in the future we’ll go beyond the dynamically capacity to flex between nat gas and coal. As the EUA price moves yet higher along with a tightening carbon market the dynamical coal to gas flex will max out. The EUA price will then trade significantly above where this flex technically will occur. There will still be quite a few coal fired power plants running since they are needed for grid stability and supply amid constrained local grids.
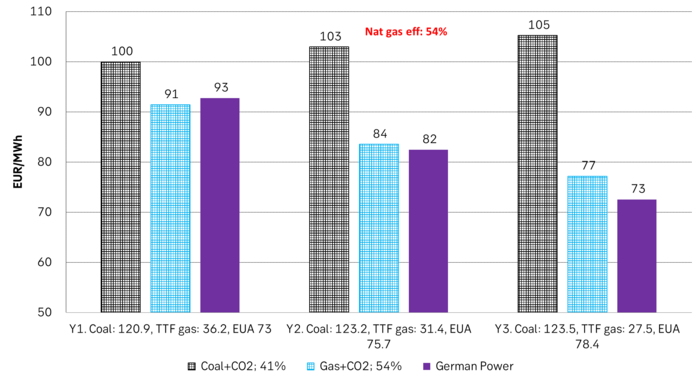
As it looks now we still have such overall coal to gas flex in 2024 and partially in 2025, but come 2026 it could be all maxed out. At least if we look at implied pricing on the forward curves where the forward EUA price for 2026 and 2027 are trading way above technical coal to gas differentials. The current forward pricing implications matches well with what we theoretically expect to see as the EUA market gets tighter and marginal abatement moves from the power sector to the industrial sector. The EUA price should then trade up and way above the technical coal to gas differentials. That is also what we see in current forward prices for 2026 and 2027.
The correlation between nat gas and EUAs should then (2026/27 onward) switch from positive to negative. What is left of coal in the power mix will then no longer be dynamically involved versus nat gas and EUAs. The overall power price will then be ruled by EUA prices, nat gas prices and renewable penetration. There will be pockets with high cost power in the geographical points where there are no other alternatives than coal.
The EUA price is an added cost of energy as long as we consume fossil energy. Thus both today and in future years we’ll have the following as long as we consume fossil energy:
EUA price UP => Pain for consumers of energy => lower energy consumption, faster implementation of energy efficiency and renewable energy => lower emissions
The whole idea with the EUA price is after all that emissions goes down when the EUA price goes up. Either due to reduced energy consumption directly, accelerated energy efficiency measures or faster switch to renewable energy etc.
Let’s say that the coal to gas flex is maxed out with an EUA price way above the technical coal to gas differentials in 2026/27 and later. If the nat gas price then goes up it will no longer be an option to ”go black” and use more coal as the distance to that is too far away price vise due to a tight carbon market and a high EUA price. We’ll then instead have that:
Nat gas higher => higher energy costs with pain for consumers => weaker nat gas / energy demand & stronger drive for energy efficiency implementation & stronger drive for more non-fossil energy => lower emissions => EUA price lower
And if nat gas prices goes down it will give an incentive to consume more nat gas and thus emit more CO2:
Cheaper nat gas => Cheaper energy costs altogether, higher energy and nat gas consumption, less energy efficiency implementations in the broader economy => emissions either goes up or falls slower than before => EUA price UP
Historical and current positive correlation between nat gas and EUA prices should thus not at all be taken for granted for ever and we do expect this correlation to switch to negative some time in 2026/27.
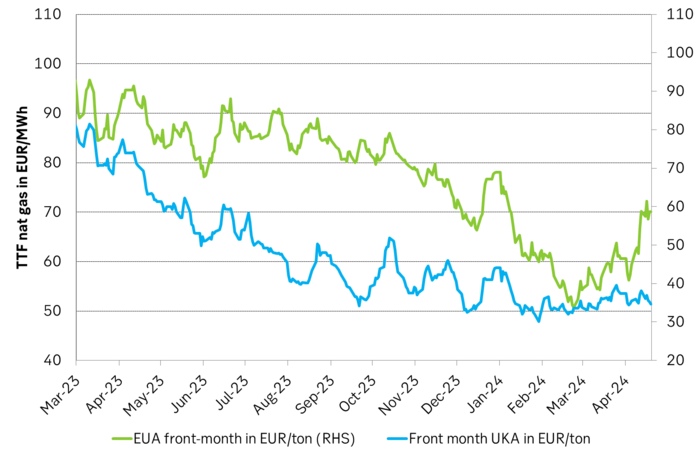
In the UK there is hardly any coal left at all in the power mix. There is thus no option to ”go black” and burn more coal if the nat gas price goes up. A higher nat gas price will instead inflict pain on consumers of energy and lead to lower energy consumption, lower nat gas consumption and lower emissions on the margin. There is still some positive correlation left between nat gas and UKAs but it is very weak and it could relate to correlations between power prices in the UK and the continent as well as some correlations between UKAs and EUAs.
Correlation of daily changes in front month EUA prices and front-year TTF nat gas prices, 250dma correlation.
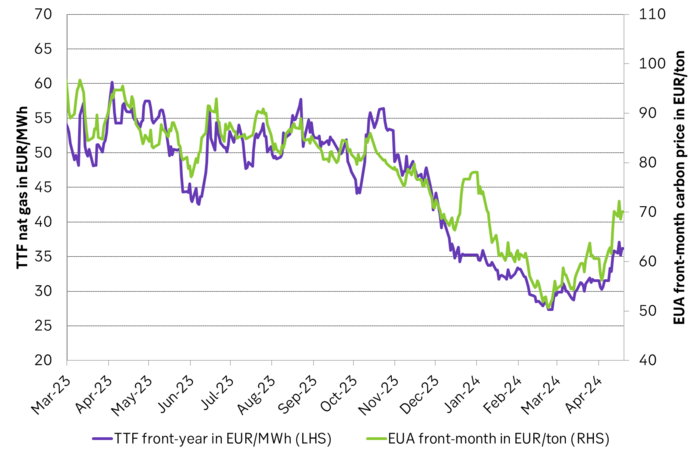
EUA price vs front-year TTF nat gas price since March 2023
Front-month EUA price vs regression function of EUA price vs. nat gas derived from data from Apr to Nov last year.
The EUA price vs the UKA price. Correlations previously, but not much any more.
Forward German power prices versus clean cost of coal and clean cost of gas power. Coal is totally priced out vs power and nat gas on a forward 2026/27 basis.
Forward price of EUAs versus technical level where dynamical coal to gas flex typically takes place. EUA price for 2026/27 is at a level where there is no longer any price dynamical interaction or flex between coal and nat gas. The EUA price should/could then start to be negatively correlated to nat gas.
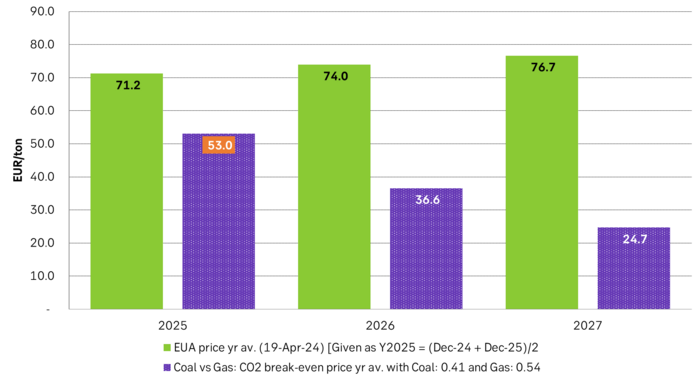
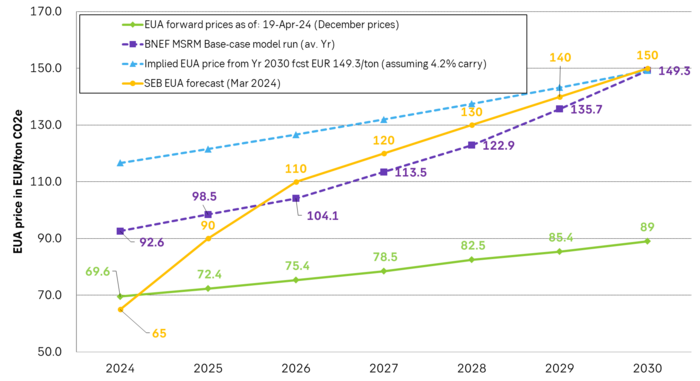
Forward EAU price vs. BNEF base model run (look for new update will come in late April), SEB’s EUA price forecast.
Analys
Fear that retaliations will escalate but hopes that they are fading in magnitude

Brent crude spikes to USD 90.75/b before falling back as Iran plays it down. Brent crude fell sharply on Wednesday following fairly bearish US oil inventory data and yesterday it fell all the way to USD 86.09/b before a close of USD 87.11/b. Quite close to where Brent traded before the 1 April attack. This morning Brent spiked back up to USD 90.75/b (+4%) on news of Israeli retaliatory attack on Iran. Since then it has quickly fallen back to USD 88.2/b, up only 1.3% vs. ydy close.

The fear is that we are on an escalating tit-for-tat retaliatory path. Following explosions in Iran this morning the immediate fear was that we now are on a tit-for-tat escalating retaliatory path which in the could end up in an uncontrollable war where the US unwillingly is pulled into an armed conflict with Iran. Iran has however largely diffused this fear as it has played down the whole thing thus signalling that the risk for yet another leg higher in retaliatory strikes from Iran towards Israel appears low.
The hope is that the retaliatory strikes will be fading in magnitude and then fizzle out. What we can hope for is that the current tit-for-tat retaliatory strikes are fading in magnitude rather than rising in magnitude. Yes, Iran may retaliate to what Israel did this morning, but the hope if it does is that it is of fading magnitude rather than escalating magnitude.
Israel is playing with ”US house money”. What is very clear is that neither the US nor Iran want to end up in an armed conflict with each other. The US concern is that it involuntary is dragged backwards into such a conflict if Israel cannot control itself. As one US official put it: ”Israel is playing with (US) house money”. One can only imagine how US diplomatic phone lines currently are running red-hot with frenetic diplomatic efforts to try to defuse the situation.
It will likely go well as neither the US nor Iran wants to end up in a military conflict with each other. The underlying position is that both the US and Iran seems to detest the though of getting involved in a direct military conflict with each other and that the US is doing its utmost to hold back Israel. This is probably going a long way to convince the market that this situation is not going to fully blow up.
The oil market is nonetheless concerned as there is too much oil supply at stake. The oil market is however still naturally concerned and uncomfortable about the whole situation as there is so much oil supply at stake if the situation actually did blow up. Reports of traders buying far out of the money call options is a witness of that.
-

 Nyheter3 veckor sedan
Guldpriset når nytt all time high och bryter igenom 2300 USD
-
 Nyheter4 veckor sedan
Lundin Mining får köprekommendation av BMO
-

 Nyheter4 veckor sedan
Vertikal prisuppgång på kakao – priset toppar nu 9000 USD
-

 Nyheter3 veckor sedan
Centralbanker fortsatte att köpa guld under februari
-

 Nyheter2 veckor sedan
USAs stigande konsumtion av naturgas
-

 Nyheter2 veckor sedan
Kakaomarknaden är extrem för tillfället
-

 Nyheter3 veckor sedan
Hur mår den svenska skogsbraschen? Två favoritaktier
-

 Nyheter3 veckor sedan
Boliden på 20 minuter


