

Analys
SEB Jordbruksprodukter, 23 september 2013


 Prisrörelserna förra veckan påverkades mycket av den amerikanska centralbanken. Först kom beskedet att det inte blir någon minskning i centralbankens (FED:s) köp av amerikanska obligationer, förrän tidigast år 2015. Anledningen är att man inte sett tillräcklig effekt på ekonomin än av de köp (och utbetalningar av pengar) som skett. Man kan fråga sig var de läst att sedelpressen någonsin skapat sysselsättning. Beslutet fick alla råvarumarknader att hoppa upp. Råvarulandet Brasliens aktiebörs blev den bästa av nästan 100 aktiebörser i världen, den dagen. I fredags gjorde så en medlem i FED ett uttalande som antydde att det ändå kan bli fråga om minskning i centralbankens återköp. Analytiker tolkade detta som en del i FED:s kommunikationsstrategi. Marknaderna föll abrupt på detta sent på fredagen. Jag ser dock detta inte som en medveten kommunikationsstrategi utan som ett tecken på oenighet i FED om fortsatt pengaproduktion är rätt väg. Det viktiga är dock att de som tycker att sedelpressen ska stå på är i majoritet och att dissidenterna är få. Vid det senaste FED-beslutet var det endast en person som var emot en förlängning till 2015. Kanske har marknaden kommit fram till samma slutsats under helgen. I så fall skulle priserna kunna gå upp i veckan
som kommer.
Inga tekniska stödnivåer bröts i under fredagens prisfall – utom för sojabönor – men ”it had it coming”. Vi är fortsatt negativa till sojabönor och raps, men neutrala till spannmål och vi har köp på socker.
I torsdags var vi på Copenhagen Grain Exchange, som besöktes av rekordmånga från branschen. När man talade med folk var den allmänna bedömningen att priset på spannmål kommer att hålla sig stabilt på den här nivån åtminstone fram till våren. Det är i sig ett observandum, att man tror att volatiliteten kommer att vara låg och att priserna kommer att vara låga. Det finns inget som tyder på det, men skulle det komma nyheter som indikerar högre priser, finns ingen psykologisk förberedelse på detta.
Vete
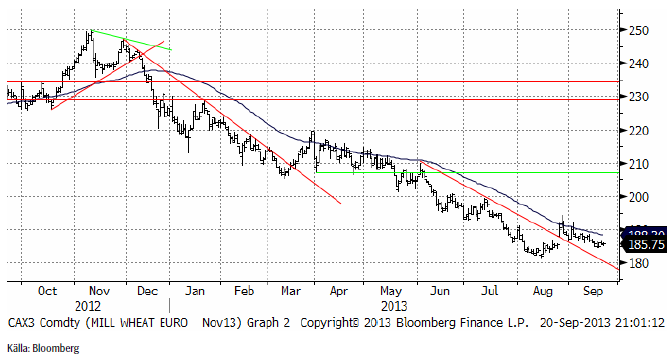
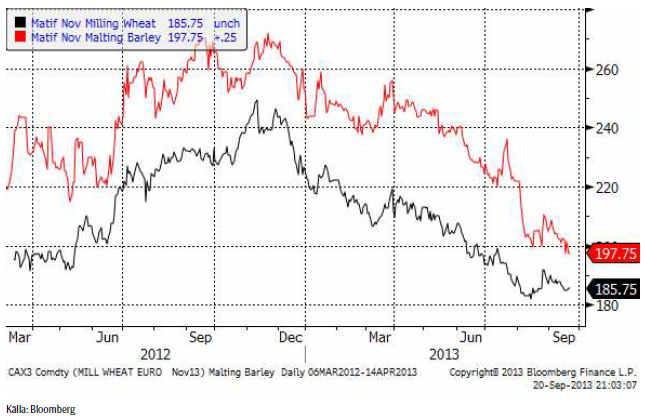
November-vetet på Matif höll sig över stödlinjen, men backade större delen av veckan. Den tekniska analystolkningen är att den huvudsakliga fallande trenden är bruten och att marknaden är i nyhetsmässig stiltje. Ett trendbrott uppåt skulle kunna komma, likväl som en fortsatt prisfall.
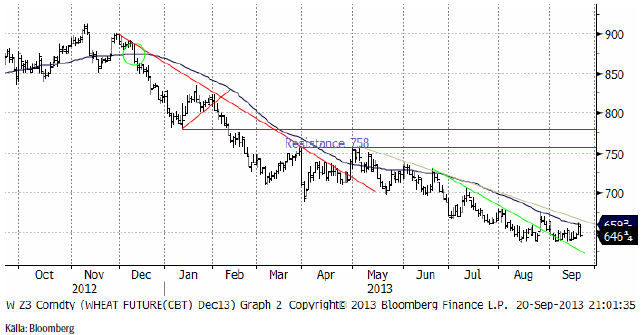
Decemberkontraktet på CBOT tycks ha ett stöd strax under dagens pris. Stödet ligger vid 640 cent ungefär.
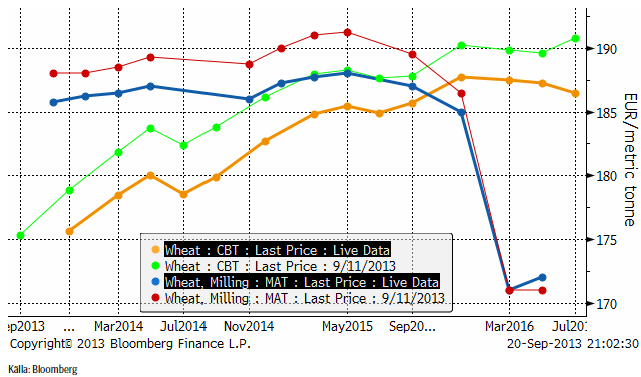
Nedan ser vi terminskurvorna för Chicagovete och Matif.
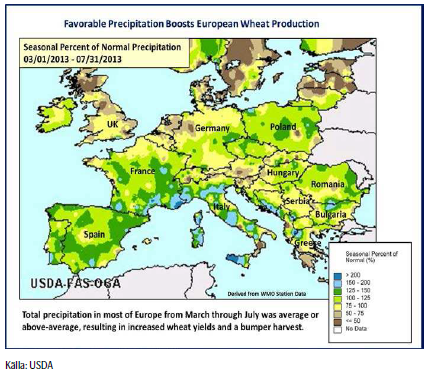
Som vi skrev om i förra veckobrevet, justerade USDA upp sin prognos för produktionen av vete i EU till 142.9 mt, en ökning med 1.5 mt från förra månadens rapport och upp 9.8 mt från förra året. Arealen lämnas oförändrad på 26 miljoner hektar medan avkastningen revideras upp från augustis 5.43 t/ha till 5.49 t/ha. Ovanligt kallt och blött väder under vården resulterade i försenad utveckling för höstvetet medan det varma och torra vädret under juli och augusti fick grödornas utveckling att ta fart i Tyskland, Polen och Storbritannien. Säsongsmässig nederbörd har också bidragit till stora skördar i Rumänien och Bulgarien. Den största förändringen från förra månadens rapport är en ökning av produktionen i Tyskland med 0.5 mt till 24.7 mt. Även produktionen i Rumänien och Bulgarien justeras upp med 0.3 mt respektive 0.2 mt till 7.4 mt och 4.8 mt. Den estimerade produktionen i Storbritannien fortsätter också att justeras upp trots en dålig start på säsongen.
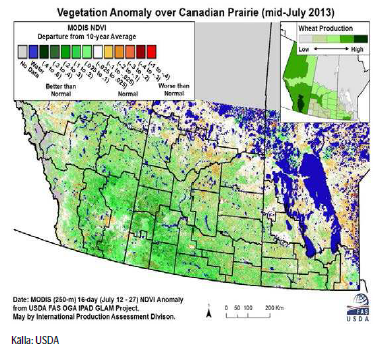
För Kanada beräknar USDA en rekordavkastning, trots en sen start av sådden pga av snötäcket som låg kvar och temperaturer under det normala som resulterade i vattendränkta fält. Bra väder under juni och juli satte dock fart på grödorna vilket kompenserade den sena starten. Den kanadensiska veteproduktionen beräknas uppgå till 31.5 mt, en ökning med 16% från förra året och upp 6.8% från förra månadens rapport.
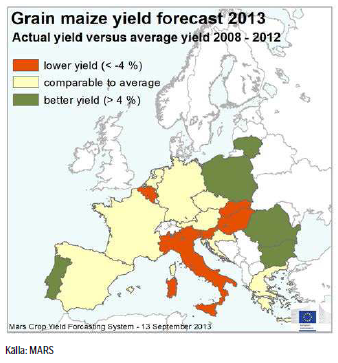
EU Kommissionens MARS-enhet kom med sin rapport i måndags och tar rygg på USDA och fortsätter att justera upp den genomsnittliga avkastningen för vete i EU-28. Avkastningen för korn justerar också upp något medan avkastningen för majs däremot justeras ner. Även raps justeras ner marginellt. Överlag så är utsikterna fortsatt gynnsamma för EU-28 och avkastningen ligger både över förra årets nivåer och det 5-
åriga genomsnittet.
Rapporteringsperioden, från början av juli till slutet av augusti, har präglats av nederbörd under det normala och temperaturer över det normala över stora delar av Europa. Däremot har mer regn än normalt fallit över de östra och södra delarna av Frankrike, norra Polen och över stora delar av Ryssland. De sydöstra delarna av Europa, bl.a Italien och västra Rumänien, drabbades av en exceptionell värmebölja i början av augusti. Under skördetid har dock vädret i allmänhet varit bra i Europa.
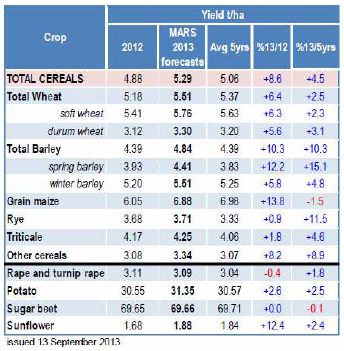
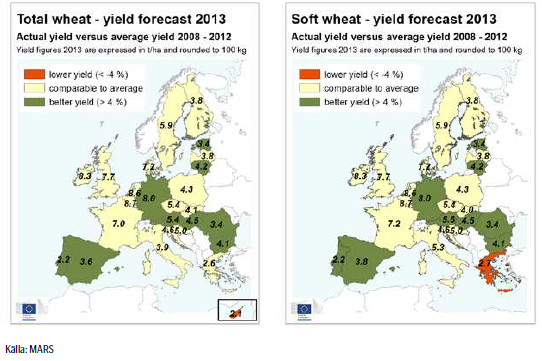
Prognosen för hektarskörden avseende vete inom EU-28 justerades upp något till 5.76 t/ha från förra månadens 5.71 t/ha, vilket är en ökning med 6.3% jämfört med förra året och över det femåriga genomsnittet på 5.63 t/ha. Revideringen återspeglar högre hektarskördar i Tyskland, Estland och Litauen.
Måndagens Crop Progress från USDA visar att skörden av amerikanskt vårvete går mot sitt slut. För de 6 stater som rapporterar så är nu 90% av skörden avklarad, en ökning från förra veckans 84%. Vid den här tiden förra året var dock skörden avklarad.
I förra veckan så började USDA också rapportera utvecklingen av den pågående sådden av amerikanskt höstvete.
12% av den förväntade arealen var avklarad per den 15 september, vilket är i linje med det 5-åriga genomsnittet.
Ukraina vill utöka sin export till Kina och den 18 september hölls det tredje mötet mellan länderna för att diskutera möjligheten att öka utbudet av jordbruksprodukter. I slutet av året väntas protokollet med fytosanitära krav undertecknas av bägge parter vilket möjliggör leveranser från Ukraina av korn och sojabönor i år, medan exporten av vete och raps beräknas starta från och med nästa år. Kina är idag en köpare av majs från Ukraina.
Argentinas produktion av vete förväntas återhämta sig från förra årets låga nivå, men mer regn behövs. Drivet av höga priser på den inhemska marknaden ökade sådd areal med nästan 8% från förra årets kraftigt reducerade nivå till 3.4 miljoner hektar. Siffran är dock lägre än förväntningarna i början på en ökning av areal med 23% pga av de torra väderförhållandena under sådden. Nederbörd i början av september har dock varit till gagn för grödorna, i synnerhet i de viktiga producentområdena runt Buenos Aires. Men fortsatt nederbörd behövs under de kommande veckorna, framförallt i de västra delarna. Förutsatt att vädret blir ”normalt” under den fortsatta växtsäsongen så indikerar FAO en preliminär prognos på 9.5 mt för 2013.
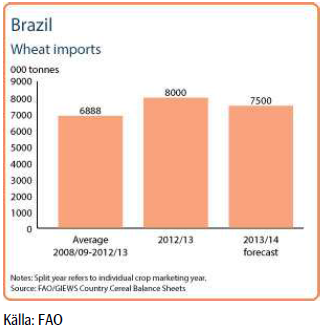
Skörden av vete i Brasilien har nu påbörjats. Hos den största producenten, Parana, som står för nästan hälften av den totala produktionen har grödorna drabbats hårt av det ovanligt kalla vädret och frost under augusti månad. Den officiella produktionsprognosen för 2013 har reviderats ner med 13% till 5.1 mt. Dock är denna nivå högre än den kraftigt minskade skörden under 2012, men fortfarande lägre än det 5-åriga genomsnittet. Den ökade produktionen beror främst på en ökning av areal med nästan 13% från förra året.
Trots skadorna på grödorna väntas produktionen att öka och importen under 2013/14 väntas minska med 6% till 7.5 mt. Under säsongen 2012/13 har ett minskat utbud, framförallt pga minskad produktion och exportrestriktioner i Argentina, fått Brasilien att istället importera vete från USA och Kanada.
Vi fortsätter att ha en neutral position i vetemarknaden.
Maltkorn
Terminspriset (november) har utvecklats väsentligt svagare än vetet den senaste tiden och bröt 200-euronivån. Det är alltså 190 som är nästa stödnivå. Dit kan priset omöjligen gå just nu, eftersom skillnaden mot Matif på 186 skulle bli för liten. Prisskillnaden mellan maltkorn och Matif-vete är ovanligt låg som den är efter veckans prisrörelser.
Majs
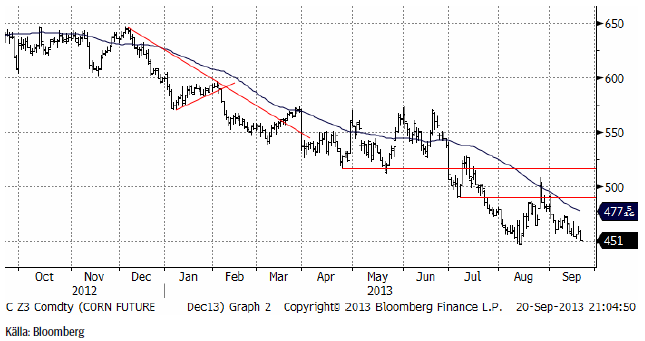
Majspriset (december 2013) föll liksom många råvaror kraftigt i pris sent i fredags och är nu strax över stödet på 450 cent.
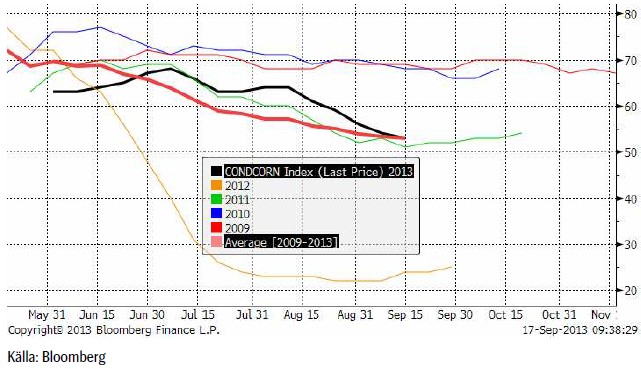
I måndags för en vecka sedan kom de senaste crop rating, som var ytterligare en nedjustering av andelen i ”good” eller ”excellent” skick (om än i något långsammare takt). För de 18 stater som rapporterar så klassas nu 53% som ”good/excellent”, ner 1% från veckan innan och nu strax under det 5-åriga genomsnittet på 55%. Omkring 56% respektive 64% av grödorna i Illinois och Indiana klassas som ”good/excellent”, vilket är en förbättring jämfört med veckan innan. Oförändrad från förra veckan är Iowa där endast 35% tillhör denna kategori.
Andelen majs som har uppnått mjölmognad uppgår till 81%, en ökning från förra veckans 64%. Förra året under torkan så hade i stort sett all majs uppnått mjölmognad vid den här tiden, men det 5-åriga genomsnittet för samma datum ligger på 86%. I Illinois har 84% nått detta utvecklingsstadium medan siffran för Indiana ligger på 82%.
Enligt USDA har nu också skörden av majs startat officiellt och per den 15 september var 4% av skörden avklarad, jämfört med 24% vid den här tiden förra året och det 5-åriga genomsnittet på 10%.
Sådden av majs pågår just nu i Argentina inför 2014, vilken dock har blivit försenad på grund av det torra vädret i augusti. Preliminära prognoser indikerar också en minskning av areal med 3% från förra årets rekordnivå. Skörden av majs (2013) var avklarad i juni. FAO’s senaste prognos uppskattar en produktion på 29 mt, en ökning med 37% från året innan och en ny rekordnivå.
BAGE säger att sådden är avklarad till 2.8%, en ökning från förra veckan 1%.
Skörden av majs, safrinha, är nu avslutad i Brasilien. Officiella uppskattningar pekar på en skörd på 45.5 mt, nästan 20% mer än förra året, vilket gör att den totala produktionen för 2013 sätter en ny rekordnivå på 80 mt till följd av ökad sådd, attraktiva höga priser och förbättrad avkastning då växtsäsongen präglats av gynnsamt väder.
EU Kommissionens MARS-enhet kom med sin rapport i måndags där de justerade ner avkastningen för majs sedan förra månadens rapport då bl.a det varma och torra vädret i Italien, med temperaturer upp till 40 grader i de norra delarna av landet, under blomningen i augusti har skadat grödorna. Den genomsnittliga avkastningen justeras ner från förra månadens 6.97 t/ha till 6.88 t/ha, vilket fortfarande är en nivå som ligger över förra årets 6.05 t/ha. Frankrike är den största producenten av majs i EU-28 och estimeras en avkastning på 9.01 t/ha i år, medan Italien under förra året tog sig upp på en 2:a plats då Rumänen – som annars är näst största producenten – drabbades av värmebölja under sommaren med en lägre produktion som följd. Italienska lantbrukare väntas skörda 8.66 t/ha, vilket är ner från förra månadens 8.92 t/ha.
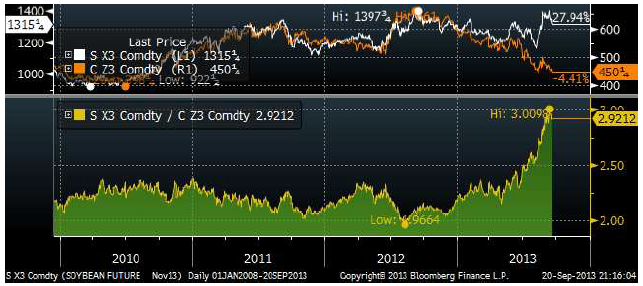
Allt fler börjar nu fråga sig hur nästa år kommer att te sig. De höga sojapriserna – och låga majspriserna har redan fått brasilianarna att överge majs och byta till soja, så att skörden väntas nå en ny rekordnivå. Kvoten mellan priserna på november-soja och december-majs har gått från 2 till 2.92 sedan samma tid förra året. Vi ser detta i diagrammet nedan.
Informa Economics publicerade en rapport i fredags på samma tema. De räknar med att sojaarealen i USA når ett nytt rekord medan sådden av majs minskar från årets rekordnivå 95.5 till 92.7 miljoner acres. 92.7 miljoner som innebär en stor minskning från årets sådd, är ändå den fjärde största arealen majs sedan det andra världskriget.
Antagligen är det av den här anledningen som urea-priserna ligger så pass lågt som de gör just nu. Detta gynnar produktionen av spannmål generellt, i norra delarna av världen, där man inte kan odla majs och soja.
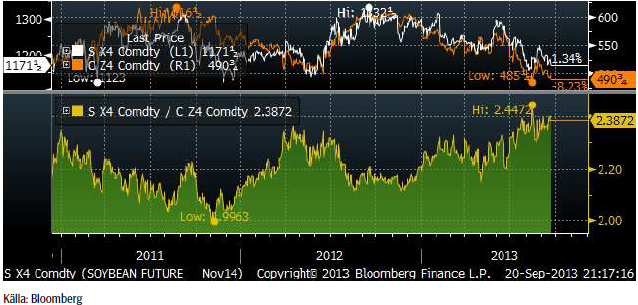
Medan sojapriset dragit i från majsen på årets kontrakt (november, december), är detta inte lika dramatiskt för 2014 års kontrakt, som vi ser nedan. Det är fortfarande så att soja har stigit i pris i förhållande till majs, men inte lika dramatiskt.
Vi behåller neutral rekommendation.
Sojabönor
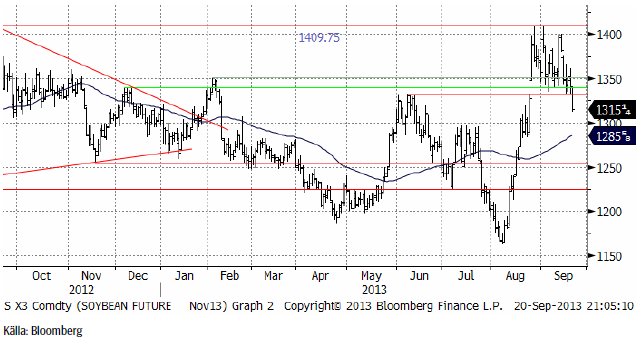
Novemberkontraktet på sojabönor sjönk successivt under veckan som gick, men fall-luckan öppnade sig i fredags och priset föll ner mot stödet på 1300 cent. Priset har potential att falla mer än så, om den nivån bryts.
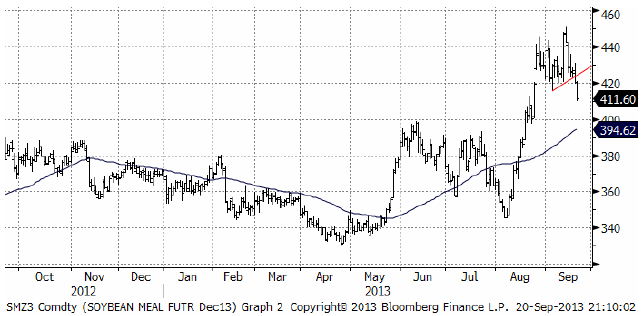
Sojamarknaden är naturligt uppdelad på sojamjöl och sojaolja och det är två helt olika världar. Vi ser prishistoriken på sojamjölet nedan. Köpsignalen på uppsidan visade sig vara ”falsk” när priset föll tillbaka. Falska köpsignaler följs ofta av ett utbrott på nedsidan och det fick vi i fredagskvällens handel. Priset kan nog gå ner till 400 dollar per short ton. Men man ska också komma ihåg att det var helgdag i Asien i fredags och att köparna därför inte var i marknaden.
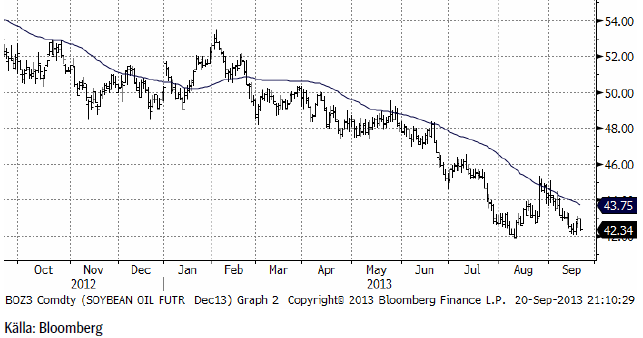
Och nedan ser vi den mycket baissigare utvecklingen på sojaoljan.
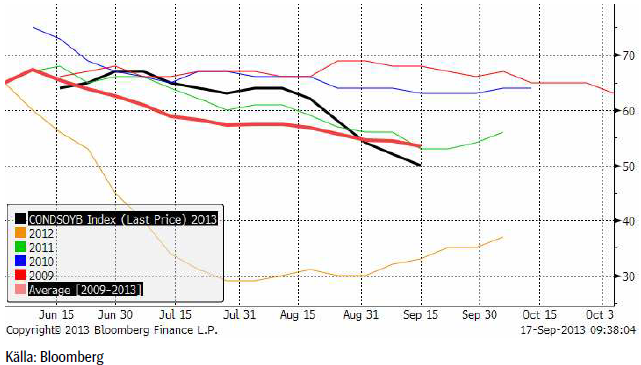
Trots spridda skurar och lägre temperaturer i USA fortsatte USDA att justera ner tillståndet för sojabönorna i måndagens Crop Progress. Andelen ”good/excellent” ligger nu på 50%, en nedjustering med 2% sedan förra veckan och under det 5-åriga genomsnittet på 55%. Hälften av grödorna i Illinois klassas som ”good/excellent”, och i Indiana ligger siffran på 56%. För bägge staterna är det en uppjustering med 1% från veckan innan. Tillståndet för sojabönorna i Iowa är oförändrat med andelen ”good/excellent” på blygsamma 33%.
Brasilianska CEPEA rapporterade i veckan att brasilianska bönder redan prissäkrat 25% av skörden till attraktiva priser, räknat i real.
Vi behåller säljrekommendation.
Raps
Rapspriset (november 2013) fortsatte sjönk hela veckan och föll slutligen kraftigt på fredagskvällen. Nyhetsmässigt talas om att Kanada kan få en skörd av canola på 17 mt, 2 mt högre än USDA:s estimat tidigare i september.
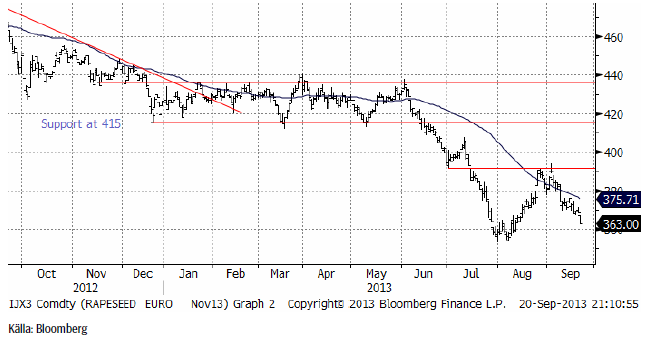
Vi behåller säljrekommendationen på raps.
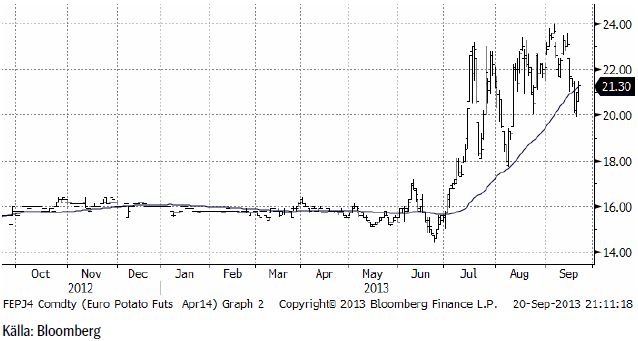
Potatis
Potatispriset var nere och rörde vid 20 euro per deciton i veckan. En stor aktör i Nordeuropa har deklarerat att priset ”ska vara” 21 euro.
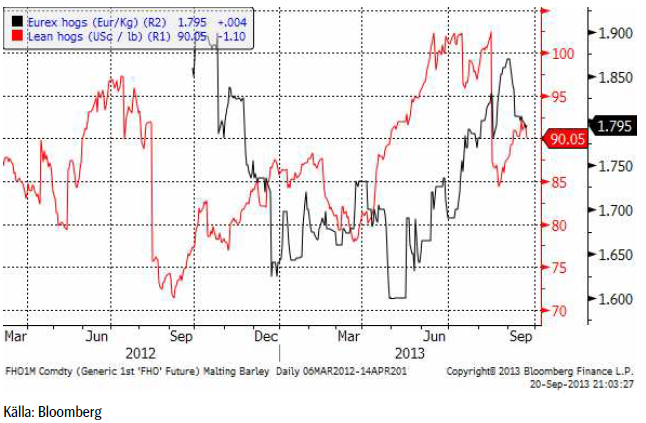
Gris
Eurexpriset fortsatte falla i veckan – och CME:s pris fortsatte stiga.
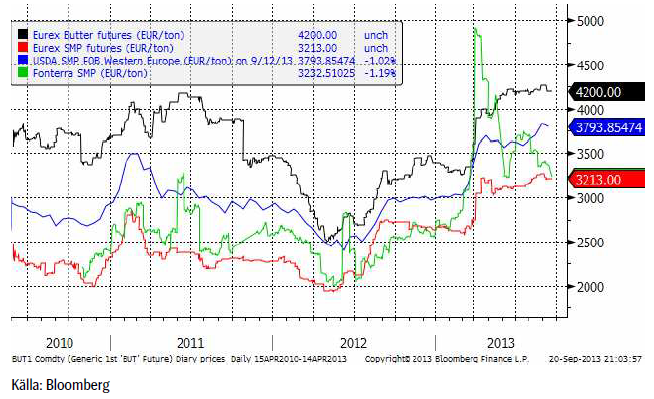
Mjölk
Terminerna på smör och skummjölkspulver vid Eurex-börsen var lite försiktigare i veckan som gick. Som vi har påpekat tidigare har den stigande trenden tappat kraft den senaste tiden. Fonterras notering har varit fallande i flera veckor.
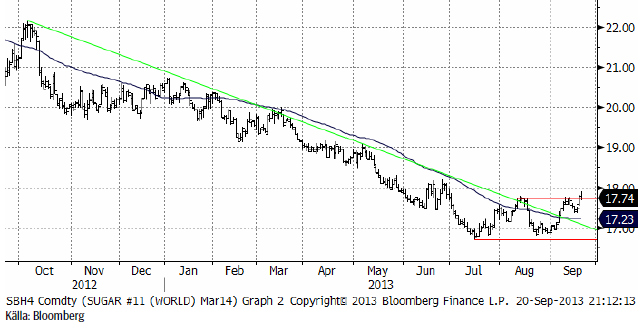
Socker
Marskontraktet på råsocker bröt det tekniska motståndet och vi har nu alltså köpsignal även tekniskt. Marknadsaktörer i Europa, som vi talat med är inställda på fortsatt överskott i sockermarknaden och inställda på fallande pris framöver. Min reflektion är att när branschen är så grundmurat negativ, är det god jordmån för en prisuppgång.
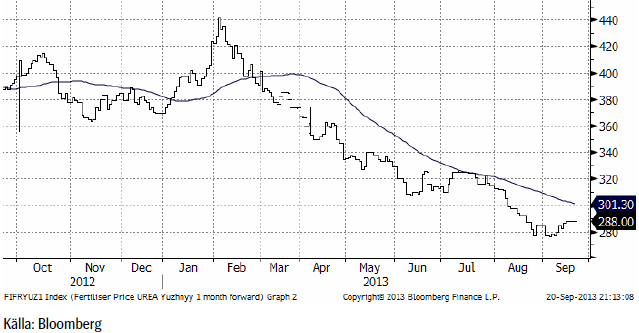
Gödsel
Priset på kväve / urea steg 1 dollar på veckan til 288 dollar per ton. Kanske kan det låga priset tolkas som att amerikanska lantbrukare sänker så mer sojabönor och mindre majs nästa år?
[box]SEB Veckobrev Jordbruksprodukter är producerat av SEB Merchant Banking och publiceras i samarbete och med tillstånd på Råvarumarknaden.se[/box]
Disclaimer
The information in this document has been compiled by SEB Merchant Banking, a division within Skandinaviska Enskilda Banken AB (publ) (“SEB”).
Opinions contained in this report represent the bank’s present opinion only and are subject to change without notice. All information contained in this report has been compiled in good faith from sources believed to be reliable. However, no representation or warranty, expressed or implied, is made with respect to the completeness or accuracy of its contents and the information is not to be relied upon as authoritative. Anyone considering taking actions based upon the content of this document is urged to base his or her investment decisions upon such investigations as he or she deems necessary. This document is being provided as information only, and no specific actions are being solicited as a result of it; to the extent permitted by law, no liability whatsoever is accepted for any direct or consequential loss arising from use of this document or its contents.
About SEB
SEB is a public company incorporated in Stockholm, Sweden, with limited liability. It is a participant at major Nordic and other European Regulated Markets and Multilateral Trading Facilities (as well as some non-European equivalent markets) for trading in financial instruments, such as markets operated by NASDAQ OMX, NYSE Euronext, London Stock Exchange, Deutsche Börse, Swiss Exchanges, Turquoise and Chi-X. SEB is authorized and regulated by Finansinspektionen in Sweden; it is authorized and subject to limited regulation by the Financial Services Authority for the conduct of designated investment business in the UK, and is subject to the provisions of relevant regulators in all other jurisdictions where SEB conducts operations. SEB Merchant Banking. All rights reserved.

Down on Friday. Up on Monday. The Brent June crude oil contract traded down 5.1% last week to a close of $90.38/b. It reached a high of $103.87/b last Monday and a low of $86.09/b on Friday as Iran announced that the Strait of Hormuz was fully open for transit. That quickly changed over the weekend as the US upheld its blockade of Iranian oil exports while Iran naturally responded by closing the SoH again. The US blew a hole in the engine room of the Iranian ship TOUSKA and took custody of the ship on Sunday. Brent crude is up 5.6% this morning to $95.4/b.

The cease-fire is expiring tomorrow. The US has said it will send a delegation for a second round of negotiations in Islamabad in Pakistan. But Iran has for now rejected a second round of talks as it views US demands as unrealistic and excessive while the US is also blocking the Strait of Hormuz.
While Brent is up 5% this morning, the financial market is still very optimistic that progress will be made. That talks will continue and that the SoH will fully open by the start of May which is consistent with a rest-of-year average Brent crude oil price of around $90/b with the market now trading that balance at around $88/b.
Financial optimism vs. physical deterioration. We have a divergence where the financial market is trading negotiations, improvements and resolution while at the same time the physical market is deteriorating day by day. Physical oil flows remain constrained by disrupted flows, longer voyage times and elevated freight and insurance costs.
Financial markets are betting that a US/Iranian resolution will save us in time from violent shortages down the road. But every day that the SoH remains closed is bringing us closer to a potentially very painful point of shortages and much higher prices.
The US blockade is also a weapon of leverage against its European and Asian allies. When Iran closed the SoH it held the world economy as a hostage against the US. The US blockade of the SoH is of course blocking Iranian oil exports. But it is also an action of disruption directed towards Europe and Asia. The US has called for the rest of the world to engaged in the war with Iran: ”If you want oil from the Persian Gulf, then go and get it”. A risk is that the US plays brinkmanship with the global oil market directed towards its European and Asian allies and maybe even towards China to force them to engage and take part. Maybe unthinkable. But unthinkable has become the norm with Trump in the White House.
Wild moves yesterday. Brent crude traded to a high of $114.43/b and a low of $96.0/b and closed at $99.94/b yesterday.
US – Iran negotiations ongoing or not? What a day. Donald Trump announced that good talks were ongoing between Iran and the US and that the 48 hour deadline before bombing Iranian power plants and energy infrastructure was postponed by five days subject to success of ongoing meetings. Iranian media meanwhile stated that no meetings were ongoing at all.
Today we are scratching our heads trying to figure out what yesterday was all about.
Friends and family playing the market? Was it just Trump and his friends and family who were playing with oil and equity markets with $580m and $1.46bn in bets being placed by someone in oil and equity markets just 15 minutes before Trump’s announcement?
Was Trump pulling a TACO as he reached his political and economic pain point: Brent at $112/b, US Gas at $4/gal, SPX below 200dma and US 10yr above 4.4%?
Different Iranian factions with Trump talking with one of them? Are there real negotiations going on but with the US talking to one faction in Iran while another, the hardliners, are not involved and are denying any such negotiations going on?
Extending the ultimatum to attack and invade Kharg island next weekend? Or, is the five day delay of the deadline a tactical decision to allow US amphibious assault ships and marines to arrive in the Gulf in the upcoming weekend while US and Israeli continues to degrade Iranian military targets till then. And then next weekend a move by the US/Israel to attack and conquer for example the Kharg island?
We do not really know which it is or maybe a combination of these.
We did get some kind of TACO ydy. But markets have been waiting for some kind of TACO to happen and yesterday we got some kind of TACO. And Brent crude is now trading at $101.5/b as a result rather than at $112-114/b as it did no the high yesterday.
But what really matters in our view is the political situation on the ground in Iran. Will hardliners continue to hold power or will a more pragmatic faction gain power?
If the hardliners remain in power then oil pain should extend all the way to US midterm elections. The hardliners were apparently still in charge as of last week. Iran immediately retaliated and damaged LNG infrastructure in Qatar after Israel hit Iranian South Pars. The SoH was still closed and all messages coming out of Iran indicated defiance. Hardliners continues in power has a huge consequence for oil prices going forward. The regime has played its ’oil-weapon’ (closing or chocking the Strait of Hormuz). It is using it to achieve political goals. Deterrence: it needs to be so politically and economically expensive to attack Iran that it won’t happen again in the future. Or at least that the US/Israel thinks 10-times over before they attack again. The highest Brent crude oil closing price since the start of the war is $112.19/b last Friday. In comparison the 20-year inflation adjusted Brent price is $103/b. So Brent crude last Friday at $112.19/b isn’t a shockingly high price. And it is still far below the nominal high of $148/b from 2008 which is $220/b if inflation adjusted. So once in a lifetime Iran activates its most powerful weapon. The oil weapon. It needs to show the power of this weapon and it needs to reap political gains. Getting Brent to $112/b and intraday high of $119.5/b (9 March) isn’t a display of the power of that weapon. And it is not a deterrence against future attacks.
So if the hardliners remain in power in Iran, then the SoH will likely remain chocked all the way to US midterm elections and Brent crude will at a minimum go above the historical nominal high of $148/b from 2008.
Thus the outlook for the oil price for the rest of the year doesn’t depend all that much of whether Trump pulls a TACO or not. Stops bombing or not. It depends more on who is in charge in Iran. If it is the hardliners, then deterrence against future attacks via chocking of the SoH and high oil prices is the likely line of action. It is impacting the world but the Iranian ’oil-weapon’ is directed towards the US president and the the US midterm elections.
If a pragmatic faction gets to power in Iran, then a very prosperous future is possible. However, if power is shifting towards a more pragmatic faction in Iran then a completely different direction could evolve. Such a faction could possibly be open for cooperation with the US and the GCC and possibly put its issues versus Israel aside. Then the prosperity we have seen evolving in Dubai could be a possible future also for Iran.
So far it looks like the hardliners are fully in charge. As far as we can see, the hardliners are still fully in control in Iran. That points towards continued chocking of the SoH and oil prices ticking higher as global inventories (the oil market buffers) are drawn lower. And not just for a few more weeks, but possibly all the way to the US midterm elections.
A brief sigh of relief yesterday as oil infra at Kharg wasn’t damaged. But higher today. Brent crude dabbled around a bit yesterday in relief that oil infrastructure at Iran’s Kharg island wasn’t damaged. It traded briefly below the 100-line and in a range of $99.54 – 106.5/b. Its close was near the low at $100.21/b.
No easy victorious way out for Trump. So no end in sight yet. Brent is up 3.2% today to $103.4/b with no signs that the war will end anytime soon. Trump has no easy way to declare victory and mission accomplished as long as Iran is in full control of the Strait of Hormuz while also holding some 440 kg of uranium enriched to 60% and not far from weapons grade at 90%. As long as these two factors are unresolved it is difficult for Trump to pull out of the Middle East. Naturally he gets increasingly frustrated over the situation as the oil price and US retail gas prices keeps ticking higher while the US is tied into the mess in the Middle East. Trying to drag NATO members into his mess but not much luck there.
When commodity prices spike they spike 2x, 3x, 4x or 5x. Supply and demand for commodities are notoriously inflexible. When either of them shifts sharply, the the price can easily go to zero (April 2022) or multiply 2x, 3x, or even 5x of normal. Examples in case cobalt in 2025 where Kongo restricted supply and the price doubled. Global LNG in 2022 where the price went 5x normal for the full year average. Demand for tungsten in ammunition is up strongly along with full war in the middle east. And its price? Up 537%.
Why hasn’t the Brent crude oil price gone 2x, 3x, 4x or 5x versus its normal of $68/b given close to full stop in the flow of oil of the Strait of Hormuz? We are after all talking about close to 20% of global supply being disrupted. The reason is the buffers. It is fairly easy to store oil. Commercial operators only hold stocks for logistical variations. It is a lot of oil in commercial stocks, but that is predominantly because the whole oil system is so huge. In addition we have Strategic Petroleum Reserves (SPRs) of close to 2500 mb of crude and 1000 mb of oil products. The IEA last week decided to release 400 mb from global SPR. Equal to 20 days of full closure of the Strait of Hormuz. Thus oil in commercial stocks on land, commercial oil in transit at sea and release of oil from SPRs is currently buffering the situation.
But we are running the buffers down day by day. As a result we see gradually increasing stress here and there in the global oil market. Asia is feeling the pinch the most. It has very low self sufficiency of oil and most of the exports from the Gulf normally head to Asia. Availability of propane and butane many places in India (LPG) has dried up very quickly. Local prices have tripled as a result. Local availability of crude, bunker oil, fuel oil, jet fuel, naphtha and other oil products is quickly running down to critical levels many places in Asia with prices shooting up. Oman crude oil is marked at $153/b. Jet fuel in Singapore is marked at $191/b.
Oil at sea originating from Strait of Hormuz from before 28 Feb is rapidly emptied. Oil at sea is a large pool of commercial oil. An inventory of oil in constant move. If we assume that the average journey from the Persian Gulf to its destinations has a volume weighted average of 13.5 days then the amount of oil at sea originating from the Persian Gulf when the the US/Israel attacked on 28 Feb was 13.5 days * 20 mb/d = 269 mb. Since the strait closed, this oil has increasingly been delivered at its destinations. Those closest to the Strait, like Pakistan, felt the emptying of this supply chain the fastest. Propane prices shooting to 3x normal there already last week and restaurants serving cold food this week is a result of that. Some 50-60% of Asia’s imports of Naphtha normally originates from the Persian Gulf. So naphtha is a natural pain point for Asia. The Gulf also a large and important exporter of Jet fuel. That shut in has lifted jet prices above $200/b.
To simplify our calculations we assume that no oil has left the Strait since that date and that there is no increase in Saudi exports from Yanbu. Then the draining of this inventory at sea originated from the Persian Gulf will essentially look like this:
The supply chain of oil at sea originating from the Strait of Hormuz is soon empty. Except for oil allowed through the Strait of Hormuz by Iran and increased exports from Yanbu in the Red Sea. Not included here.

Oil at sea is falling fast as oil is delivered without any new refill in the Persian Gulf. Waivers for Russian crude is also shifting Russian crude to consumers. Brent crude will likely start to feel the pinch much more forcefully when oil at sea is drawn down another 200 mb to around 1000 mb. That is not much more than 10 days from here.

Oil and oil products are starting to become very pricy many places. Brent crude has still been shielded from spiking like the others.


Market Still Betting on Timely Resolution, But Each Day Raises Shortage Risk

Christian Kopfer om läget för oljan

Marknaden måste börja betrakta de höga kopparpriserna som det nya normala

Det fysiska spotpriset på brentolja har slagit nytt rekord

40 minuter med Javier Blas om hur världen verkligen påverkas av energikrisen
40 minuter med Javier Blas om hur världen verkligen påverkas av energikrisen

Elpriserna fördubblas, stor osäkerhet inför sommaren

MP Materials, USA:s svar på Kinas dominans över sällsynta jordartsmetaller
Det fysiska spotpriset på brentolja har slagit nytt rekord

Studsvik har idag ansökt om att få bygga 1200-1600 MW kärnkraft i Valdemarsvik
-
 Nyheter3 veckor sedan
40 minuter med Javier Blas om hur världen verkligen påverkas av energikrisen
-
 Nyheter4 veckor sedan
Elpriserna fördubblas, stor osäkerhet inför sommaren
-
 Nyheter4 veckor sedan
MP Materials, USA:s svar på Kinas dominans över sällsynta jordartsmetaller
-
 Nyheter3 veckor sedan
Det fysiska spotpriset på brentolja har slagit nytt rekord
-
 Nyheter4 veckor sedan
Studsvik har idag ansökt om att få bygga 1200-1600 MW kärnkraft i Valdemarsvik
-
 Nyheter2 veckor sedan
Marknaden måste börja betrakta de höga kopparpriserna som det nya normala
-
Analys4 veckor sedan
TACO (or Whatever It Was) Sends Oil Lower — Iran Keeps Choking Hormuz
-

 Nyheter4 veckor sedan
Matproduktion är beroende av gödsel, Gulfkriget skapar brist