

Analys
SEB Jordbruksprodukter, 16 september 2013


 Torsdagskvällens WASDE-rapport visade högre utgående lager för vete och majs men sojabönslager enligt förväntan. Priset på vete och majs föll direkt. Handlare i marknaden tittade dock med misstro på siffrorna på sojabönor och valde att handla upp dem.
Efter ett litet tag handlades de nästan ”limit-up”, men marknaden sansade sig och priset föll sedan tillbaka. Detta visar skillnaden i psykologin i vete och majsmarknaden å ena sidan och den till bristningsgränsen spända situationen i sojamarknaden. Det är uppenbarligen flera aktörer som har en rejäl oro för prisuppgångar och av allt att döma befinner sig dessa i Asien. Vi har tidigare sett hur prisrusningar skett på småtimmarna svensk tid, som är kontorstid i Asien. Antagligen finns det handelshus eller foderproducenter som ligger kort marknaden och hoppas att priset ska komma ner. Fundamentalt tyder mycket på lägre pris framöver.
Odlingsväder
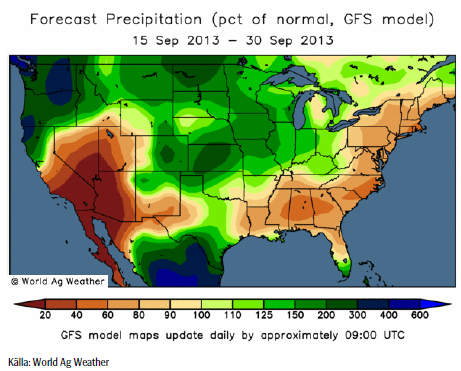
USA väntas få god nederbörd över viktiga odlingsområden under den kommande tvåveckorsperioden.
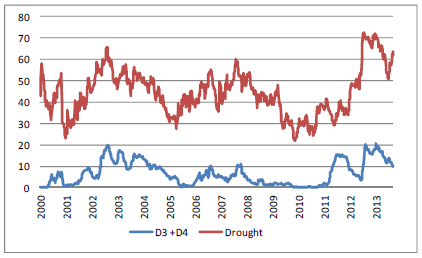
Sedan den 20 augusti har den andel av USA som är torrare än normalt ökat från 60% till nästan 64%. Andelen som är drabbad av de mest extrema formerna av torka har dock minskat marginellt. Den trenden fortsätter alltså.
Argentina är väsentligt mycket torrare än normalt och väntas vara det resten av månaden. Detta kan påverka veteskörden ännu mer negativt. Det torra vädret har redan påverkat skördeestimaten från USDA.
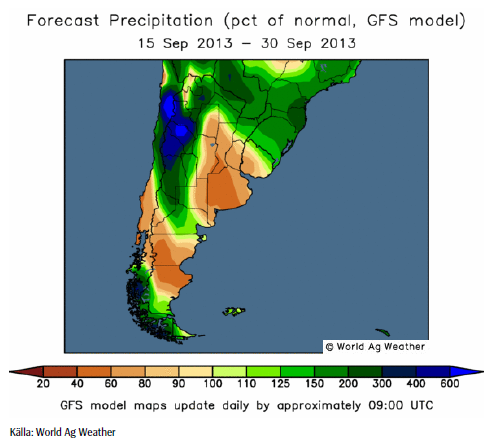
Brasilien har utmärkt väder. Det är något mer nederbörd i prognosen än normalt.
Vete
November vetet på Matif höll sig över stödlinjen, men backade större delen av veckan. I EU trycker fortfarande lantbrukarna på sin fysiska spannmål.
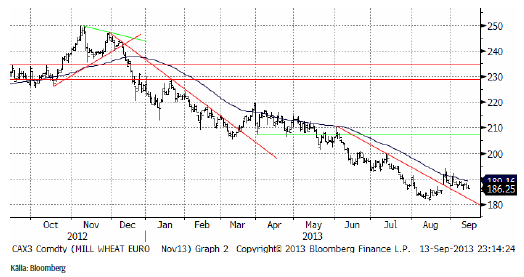
Decemberkontraktet på CBOT tycks ha ett stöd strax under dagens pris. Stödet ligger vid 640 cent ungefär.
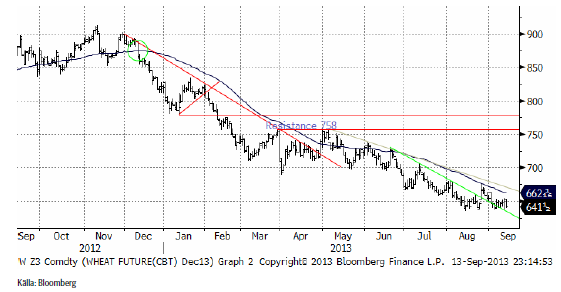
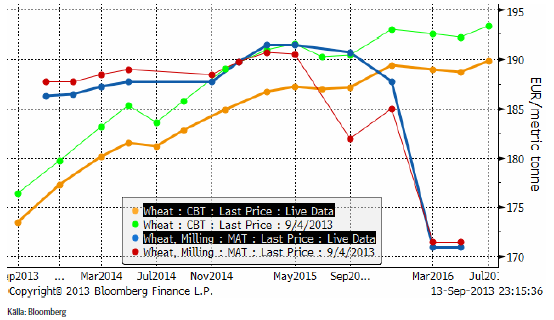
Nedan ser vi terminskurvorna för Chicagovete och Matif. Vi ser att priset föll ordentligt i USA men knappt hälften så mycket i Europa.
Måndagens Crop Progress från USDA visar att skörden av amerikanskt vårvete fortsätter att avancera i raskt takt. För de 6 stater som rapporterar är nu 80% av skörden avklarad, en ökning från förra veckans 64% och för första gången över det 5-åriga genomsnittet på 79%, men fortfarande under förra årets 97% vid den här tiden.
Från och med nu börjar USDA också rapportera den pågående sådden av amerikanskt höstvete. Per den 8 september så var 5% av sådden avklarad, vilket är i linje med det 5-åriga genomsnittet och marginellt högre än förra årets 4% vid samma tidpunkt.
Egypten fortsätter att rumstera i den internationella marknaden och slog till på ytterligare ett köp av vete, denna gång 235 000 ton för leverans i november. I stort sett samma uppställning som tidigare med 60 000 t från Rumänien, 60 000 t från Ryssland och resten från Ukraina. Det franska vete som offererades låg ca 10 usd högre (C&F) medan amerikanskt vete lyste med sin frånvaro.
I WASDE-rapporten gjordes ingen förändring för skörd per acre i USA. Den lämnades oförändrad på 46.2 bushels per acre. Inte heller gjordes något åt arealen på 45.7 miljoner acres.
På global basis ser vi som väntat högre produktionsestimat för Kanada, EU och före-detta Sovjetunionen. De gjorde ingen förändring för Australien och inte heller för Kina, trots att vi vet att det varit stora översämningar där som borde motsvara minst 2 mt. Däremot gjorde de en sänkning med 1 mt i Iran, av alla ställen, till 14.5 mt.
De höjde importestimaten för Egypten och Iran. För Iran höjde de till 4.5 mt, trots att Iran i onsdags rapporterade om ett importbehov på 7.5 mt. Importestimatet för Saudiarabien sänktes.
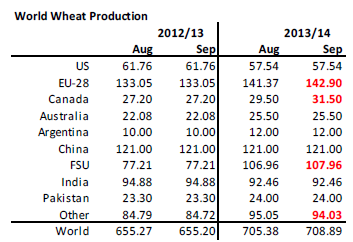
Utgående lager höjdes på global basis och därmed saknas därför anledning att handla upp priset på vete. Utgående lager för EU-28 på 11 mt motsvarar 22 dagars konsumtion.
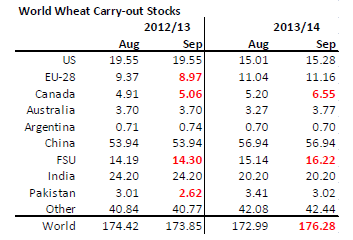
Ingen hade förväntat sig någon ”action” från vete-balanserna och det blev det inte heller. Efter ett stort prisfall sedan den 17 december förra året, gav den här rapporten ”mer av samma sak”. De som hoppas på en trendvändning uppåt i priset fick här ytterligare anledning att ändra sin ståndpunkt.
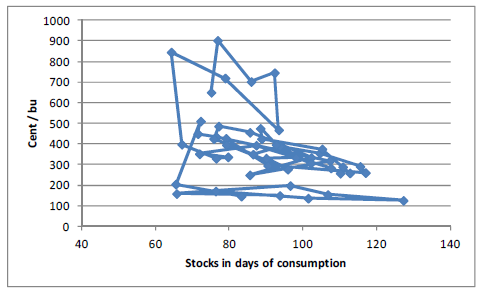
I diagrammet nedan ser vi pris i förhållande till utgående lager 50 år bakåt i tiden. Varje punkt representerar ett år. Punkterna är förbundna tidsmässigt med linjer. Vi ser att dagens förhållande mellan pris och förväntat utgående lager enligt den senaste WASDE-rapporten, avviker något från den historiska relationen. Priset är just nu möjligtvis väl lågt i förhållande till den historiska relationen de senaste åren, men inte om man jämför med relationen innan 00-talets boom.
ABARES justerar ner sin prognos för Australiens veteproduktion efter att torka har påverkat grödorna negativ hos de största producentstaterna. Lantbrukarna förväntas skörda 24.5 mt vete 2013/14 , vilket är en minskning från tidigare estimat i juni på 25.4 mt men en ökning med 11% från 2012/13. Sådd areal justeras upp från 13.68 mha till 13.71 mha. USDA håller dock kvar vid sitt estimat på 25.5 mt.
Trots detta räknar man med att exporten kan uppgå till 19.5 mt under säsongen med start 1 oktober, vilket endast är en nedjustering med 100 000 ton från prognosen i juni.
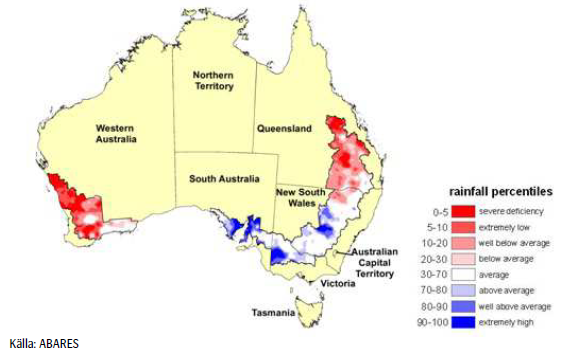
Västra Australien har drabbats av torka över stora delar och lantbrukare där beräknas skörda 7.3 mt, vilket är lägre än de 8.8 mt som estimerades i juni men fortfarande en ökning med 6% jämfört med förra året då torka drabbade produktionen. Skörden av vete beräknas börja nästa månad.
Produktionen av canola beräknas till 3.3 mt, en ökning från tidigare estimat på 3.2 mt i juni men en minskning med 18% jämfört med förra året.
Under perioden 1 juni till 31 augusti har nederbörden i södra Australien har varit normal / över det normala, medan nederbörden i västra Australien har varit långt under det normala. Under den kommande ”våren” krävs dock mer nederbörd.
Som nämnt ovan, behåller vi vår neutrala vy på vetet.
Maltkorn
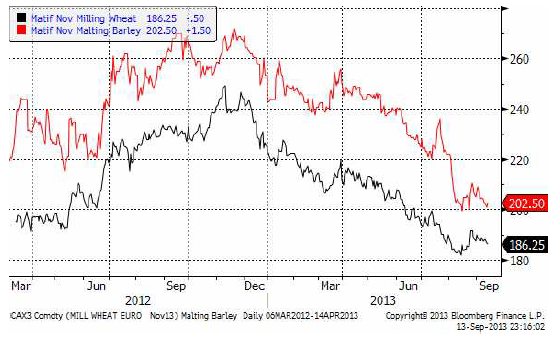
Terminspriset (november) är som vi tidigare nämnt understött av att köpare uppenbarligen tycker att ”200 euro” är ett praktiskt pris att köpa på. Om priset skulle gå under 200 euro kommer man antagligen att tycka att 190 euro är ett bättre alternativ.
Majs
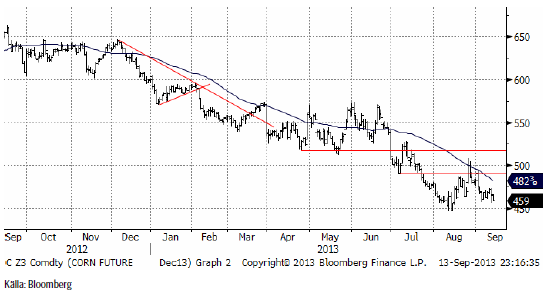
Majspriset (december 2013) rörde sig mer än normalt i torsdags på WASDE-rapportens dag, men det var inte större dramatik än en normal dag under augusti. Trenden är nedåtriktad och det finns inget som tyder på att marknaden inte skulle gå ner oh testa 450 cent igen.
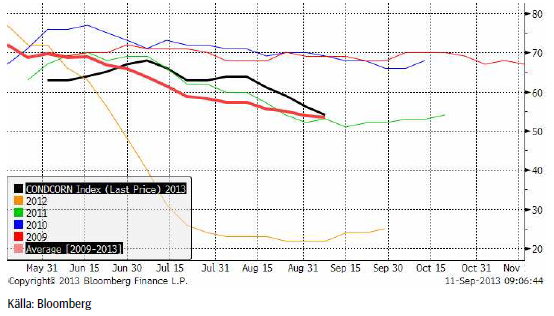
Tillståndet för den amerikanska majsen fortsätter att försämras enligt måndagens Crop Progress från USDA. För de 18 stater som rapporterar så klassas nu 54% som ”good/excellent”, ner 2% från veckan innan och nu strax under det 5-åriga genomsnittet på 55%. Omkring 55% respektive 61% av grödorna i Illinois och Indiana klassas som ”good/excellent”. I Iowa är det bara 35% som tillhör denna kategori.
Andelen majs som har uppnått mjölmognad uppgår till 64%, en ökning från förra veckans 42%. Förra året under torkan så låg siffran på 92% vid den här tiden, men det 5-åriga genomsnittet för samma datum ligger på 75%. Runt 69% av grödorna i Illinois har nått detta utvecklingsstadium, en ökning från 46%, medan siffran för Indiana ligger på 67%, upp från 47% veckan innan.
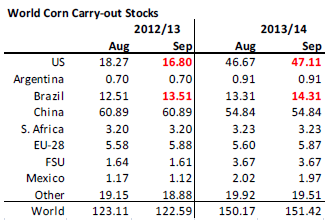
I WASDE-rapporten höjdes den väntade skörden per acre från att ha legat på 154.5 bushels per acre i augustirapporten, till 155.3 nu. Då arealen lämnades oförändrad, ökade därför produktionsestimatet till 13,843 miljoner bushels. Carry out stocks ökade också från 1837 till 1855 miljoner bushels, jämfört med augusti månads rapport.
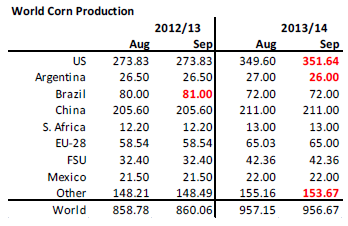
Om vi tittar på global produktion, ser vi att USA justeras upp med 2 mt. Brasiliens skörd i våras justeras upp med 1 mt till 81 mt. Argentinas skörd lämnas oförändrad, trots att jordbruksdepartementet i Argentina estimerat skörden till 32.5 mt och inte 26.5 som USDA har.
För det kommande året har USDA sänkt skördeestimatet för Argentina pga det torra vädret som landet har.
Utgående lager väntas sjunka marginellt med 0.5 mt för 2012/13. USDA höjer inlagringen i USA och i Brasilien. Om Argentinas regering har mer rätt än USDA finns också möjligheten att det finns betydande lager där.
För 2012/13 höjs utgående lager i USA och i Brasilien, vilket är en konsekvens av högre utgående lager från 2012/13.
I diagrammet nedan ser vi förhållandet mellan pris och lager. Vi ser att dagens pris på strax under 500 cent är väl motiverat med tanke på de senaste årens relation mellan lager och pris. Vi ser ingen anledning att handla priset varken uppåt eller nedåt från den här nivån.
I veckan som kommer, publicerar USDA en rapport om arealen i USA, vilket kan ge marknaden något (litet) att handla på.
Vi behåller neutral rekommendation.
Sojabönor
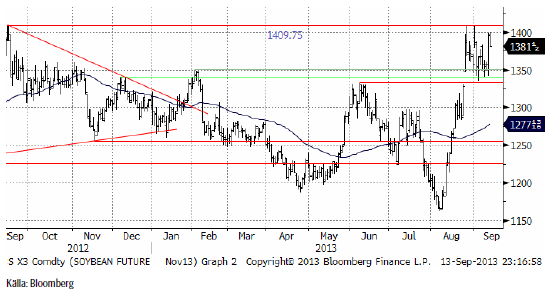
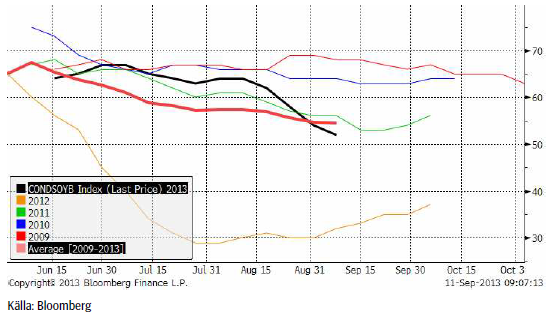
Novemberkontraktet på sojabönor sjönk successivt i pris under veckan, fram till WASDE-rapporten.
Intressant nog började priset stiga 30 minuter innan rapporten – ett tydligt tecken på hur orolig marknaden var för att rapporten skulle bli dålig och föranleda en prisuppgång. Det säger oss att väldigt svaga aktörer ligger alldeles för kort marknaden. Vi ska återkomma till detta nedan i ett resonemang om optionsmarknaden prisar in den här oron och om det finns möjligheter i optionsmarknaden.
WASDE-rapporten om sojabönor var något av en ickehändelse. Siffrorna visade faktiskt på högre utgående lager på global basis, men eftersom det varit sådant fokus på torkan i USA de senaste veckorna, hade handlare svårt att riktigt tro på siffrorna. I det oroliga läget gjorde man det som föreföll psykologiskt rätt, och man handla upp priset. När rädslan tyglats lite över natten, föll priset tillbaka på fredagen.
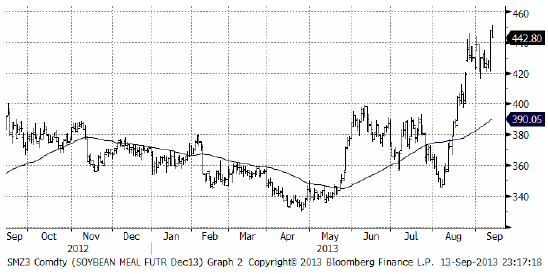
Sojamarknaden är naturligt uppdelad på sojamjöl och sojaolja och det är två helt olika världar. Vi ser prishistoriken på sojamjölet nedan och där har vi faktiskt en teknisk köpsignal efter torsdagens hausse. Priset steg till en nivå över den det prisintervall som priset legat inom den senaste månaden.
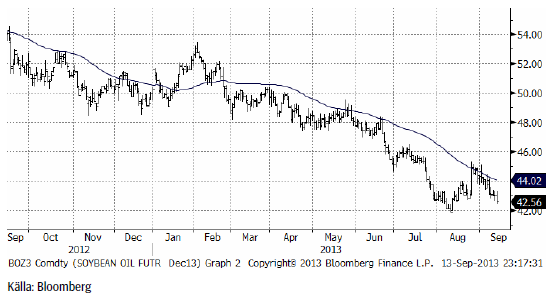
Och nedan ser vi den mycket baissigare utvecklingen på sojaoljan.
Det torra och varma vädret i USA fortsätter att påverka sojabönorna negativt, något som syntes i måndagens Crop Progress från USDA. 52% av sojabönorna klassas nu som ”good/excellent”, ner från förra veckans 54% men fortfarande över förra årets 32%. Däremot lägre än genomsnittet på 55%. Omkring 55% respektive 49% av sojabönorna i Indiana och Illinois klassas som ”good/excellent”, medan endast 33% av sojabönorna i Iowa klassas som denna kategori. I Iowa och Indiana föll andelen ”good/excellent” med 6-8% under förra veckan, med liknande nedgångar veckan dessförinnan.
97% av sojabönorna har uppnått stadiet baljsättning, en liten ökning från förra veckans 92%. Förra året vid den här tiden låg siffran på 99% och det 5-åriga genomsnittet ligger på 98%.
I WASDE-rapporten sänktes skörden per acre från 42.6 bushels per acre i augusti månads rapport, till 41.2 bushels per acre nu. Arealen lämnades oförändrad. Detta innebär att USA:s skörd sänktes från 1,675 miljoner bushels till 1,655 miljoner. En lägre export på 15 miljoner bushels till 1,370 mbu sänkte estimatet för utgående lager från 220 mbu till 150 mbu.
På global basis gjordes som ovan nämnt ingen förändring av ”bottom line”. Det väntade produktionsbortfallet i USA kompenseras fullt ut av Brasiliens väntade produktionsökning. USDA gör hela den höjning som indikerats från brasilianska analysfirmor och som vi skrivit om tidigare.
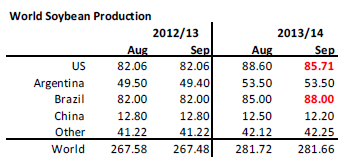
Utgående lager justeras ner i USA, med nästan 2 mt. Det är ytterligt lite att ha i utgående lager. Skulle skörden per acre sjunka ytterligare med 1 bushel / acre blir det mindre än 1 mt kvar i USA.
På global basis väntas lagren stiga, men det är ytterst marginellt. Varför Brasilien skulle öka utgående lager från 16 mt till 27.7 mt är något oklart.
Det höga priset på sojamjöl vi har nu, borde, om man man antar att det blir bestående, leda till ransonering, på samma sätt som det lett till ökad produktion i Brasilien. Detta borde gälla även USA. I WASDE-rapporten står också om minskad produktion av gris och detta borde slå igenom i lägre inhemsk efterfrågan på sojamjöl.
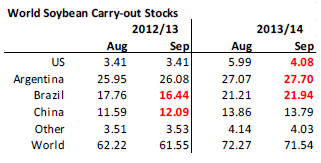
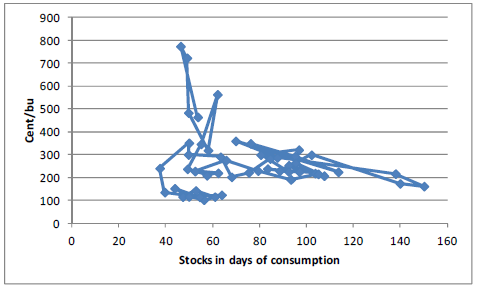
Nedan ser vi de senaste 50 årens förhållande mellan lager och pris, där varje punkt är ett år, förbundna tidsmässigt med en linje. Vi ser att den senaste punkten ligger över de senaste årens samband, dvs priset ligger för högt.
För två år sedan var priset exakt detsamma som idag, men lagernivån var väsentligt lägre än den väntas bli 2013/14. Om priset anpassade sig till det historiska sambandet, skulle det ligga på 1200 cent eller kanske 1250 cent.
Detta gör att allt annat lika, tror vi att priset kommer att falla och därmed behåller vi vår säljrekommendation.
Raps
Rapspriset (november 2013) fortsatte ner i veckan som gick. WASDE-rapporten hade ingen påverkan alls på priset. Trenden är nedåtriktad och vi har en negativ vy på prisutvecklingen.
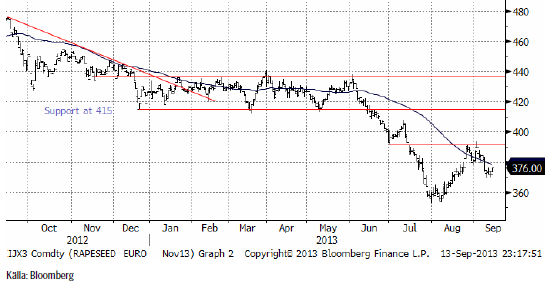
Vi behåller säljrekommendationen på raps.
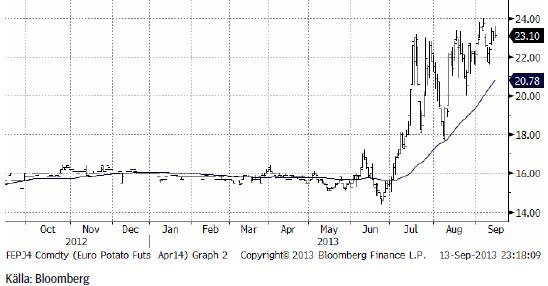
Potatis
Potatispriset steg i veckan med 1 euro från 22 till 23 euro. Sedan juni har priset gått upp från 16 till 23 euro.
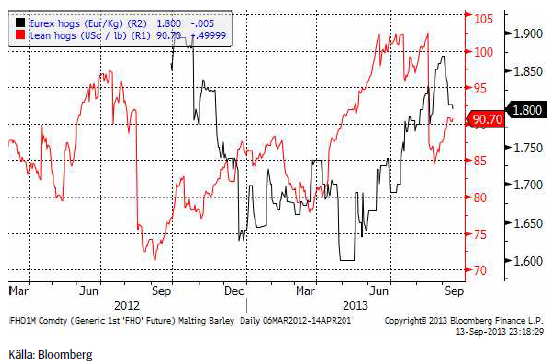
Gris
Eurexpriset föll i veckan som gick, medan lean hogs steg. WASDE-rapporten beskrev en situation med lägre produktion av gris i USA. Återigen har vi en vecka, där priserna på amerikanska grisar och europeiska går åt olika håll.
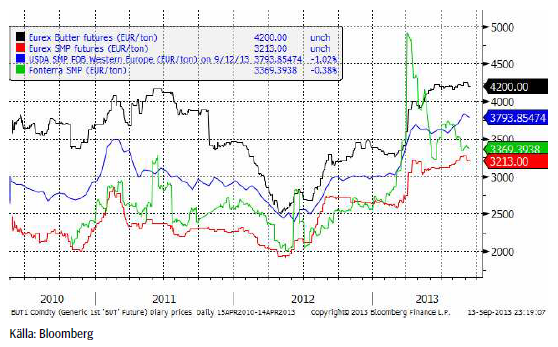
Mjölk
Terminerna på smör och skummjölkspulver vid Eurex-börsen var i princip oförändrade i veckan som gick. Den stigande trenden har rappat mycket av den kraft och övertygelse den hade under andra halvan av förra året och början av det här. Kanske är priserna nära toppen.
Socker
Oktoberkontraktet på råsocker bröt den nedåtgående trendlinjen i veckan som gick. Det är i sig inte en teknisk köpsignal. Däremot är det en signal om att den fallande trenden är över. För att få en bekräftelse från den tekniska analysen att marknaden har gått över till en stigande trend skulle vi behöva se priset gå över pristoppen i augusti och helst även över 17.52 cent, toppen i juni.
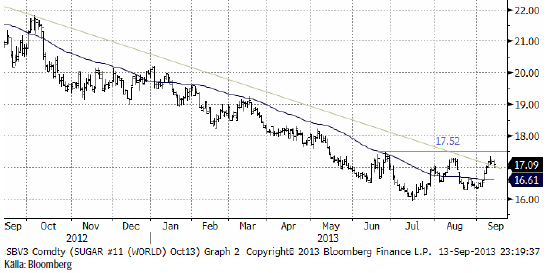
Förra veckan gick vi ut med en tidig köprekommendation på en rapport från en engelsk handelsfirma som prognosticerade ett väsentligt mindre överskott under marknadsföringsåret 2013/14.
Kritik mot den prognosen har kommit från två håll: Först från Indiens sockerproducenter och sedan från konsultfirman Kingsman.
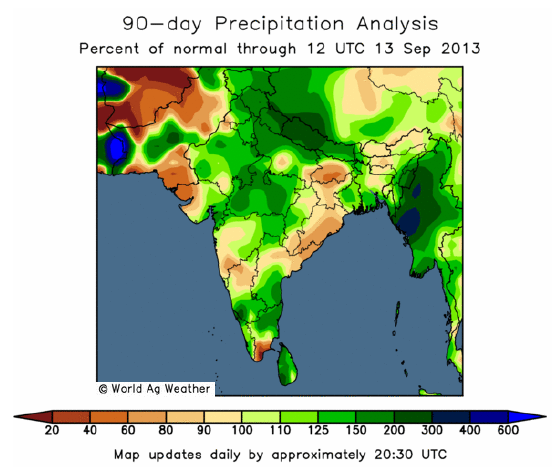
Indien har haft en bra monsun. Monsunen börjar i juni och pågår till september, ungefär och är en synonym för regnperiod. Socker odlas över hela Indien. Den delstat som producerar mest är Uttar Pradesh som ligger öster om New Delhi. Även delstaterna ungefär vi Goa är stora sockerproducenter. Kartbilden nedan visar avvikelsen från det normala för den ackumulerade nederbörden de senaste tre månaderna. Vi ser att det varit någorlunda normal nederbörd i dessa områden och om något, lite mer än normalt. Detta återspeglar sig i Indiens produktion. Indien, som är världens näst största producentland efter Brasilien, konsumerar normalt sett allt sitt socker inom landet, men pga monsunen, flaggar sockerproducentföreningen att landet kan ha en del över för export. Istället för 23.5 mt produktion 2013/14 (startar 1 oktober), tror Indian Sugar Mills Association nu på 24 mt produktion.
Den schweiziska konsultfirman Kingsman publicerade en uppdatering av deras estimat för sockermarknaden. De höjde produktionsestimatet 2013/14 med +1mt till 178 mt. De höjde också estimatet för global konsumtion något, men inte lika mycket som Czarnikow förra veckan. Slutresultatet blev en liten sänkning av produktionsöverskottet från 4.59 mt som var Kingsmans estimat i maj, till 4.45 mt nu. Czarnikow publicerade förra veckan ett estimat på att produktionsöverskottet ska bli endast 1.9 mt.
Kingsman menar att konsumtionsökningar inte sker gradvis, utan stegvis. När priset når ner till en nivå där konsumenter hellre väljer socker som input-råvara instället för andra substitut, ökar efterfrågan abrupt. Det kan vara ett byte från stärkelsesirap till socker, t ex, men detta har inte inträffat än, menar Kingsman.
Man kan tolka detta som en storm i ett vattenglas mellan konsultfirmor, men det Czarnikow och Kingsman har gemensamt är att de sänker estimatet för produktionsöverskottet nästa år.
USDA har även publicerat estimat för socker i sin senaste WASDE-rapport. Ser vi till estimerade utgående lager 2013/14 och priset, som för råsocker anges i cent per pund har vi nedanstående diagram.
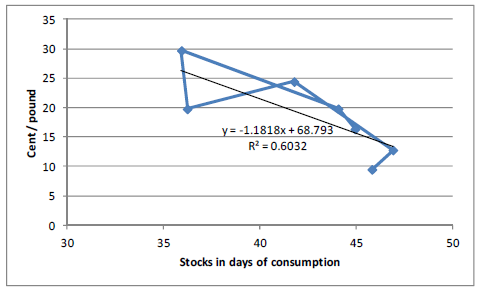
Vi ser att ett i ett linjärt samband mellan lager och pris, förklaras 60% av priset av estimatet för utgående lager vid respektive tillfälle. Vi ser att lagren är ovanligt höga nu efter att ha ökat fyra år. Vi vet också att detta är på väg att ta slut. Vi kan alltså förvänta oss högre priser på socker framöver.
Vi fortsätter att rekommendera köp, men med varningen att vi ännu inte fått en bekräftelse från den tekniska analysen.
Kaffe
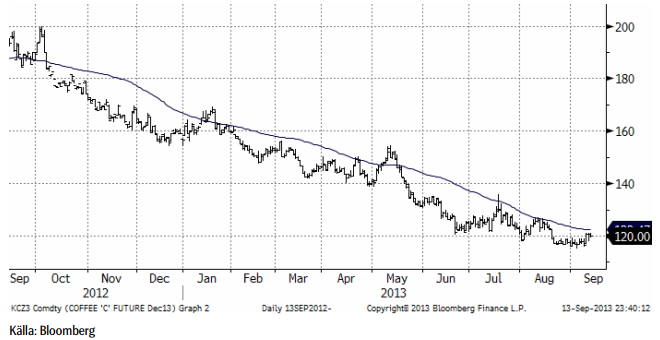
Medan den fallande trenden i socker ser ut att vara på sluttampen, ser vi ännu inte det i kaffemarknaden. Prisfallet har varit stort. Nedan ser vi prisutvecklingen på decemberkontraktet det senaste året.
Lagernivån på robusta har fortsatt att gå ner, samtidigt som lagernivån på arabica har planat ut. Minskad tillgång på billigare robusta kan möjligen få rosterier att återgå till arabica. Lagernivåerna är angivna i ton.
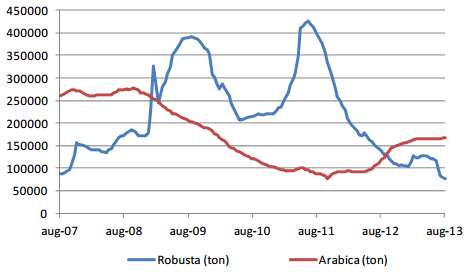
Vi behåller tills vidare neutral rekommendation, tills vi ser tecken på ett trendbrott.
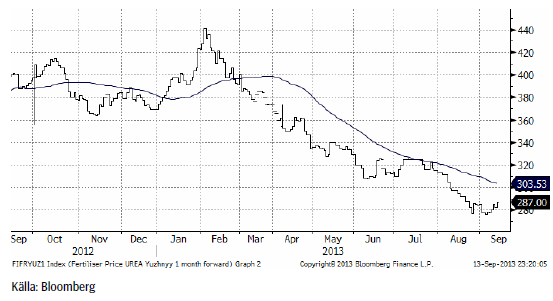
Gödsel
Priset på kväve / urea steg förra veckan från nivåer under 280 dollar per ton till 287 dollar.
[box]SEB Veckobrev Jordbruksprodukter är producerat av SEB Merchant Banking och publiceras i samarbete och med tillstånd på Råvarumarknaden.se[/box]
Disclaimer
The information in this document has been compiled by SEB Merchant Banking, a division within Skandinaviska Enskilda Banken AB (publ) (“SEB”).
Opinions contained in this report represent the bank’s present opinion only and are subject to change without notice. All information contained in this report has been compiled in good faith from sources believed to be reliable. However, no representation or warranty, expressed or implied, is made with respect to the completeness or accuracy of its contents and the information is not to be relied upon as authoritative. Anyone considering taking actions based upon the content of this document is urged to base his or her investment decisions upon such investigations as he or she deems necessary. This document is being provided as information only, and no specific actions are being solicited as a result of it; to the extent permitted by law, no liability whatsoever is accepted for any direct or consequential loss arising from use of this document or its contents.
About SEB
SEB is a public company incorporated in Stockholm, Sweden, with limited liability. It is a participant at major Nordic and other European Regulated Markets and Multilateral Trading Facilities (as well as some non-European equivalent markets) for trading in financial instruments, such as markets operated by NASDAQ OMX, NYSE Euronext, London Stock Exchange, Deutsche Börse, Swiss Exchanges, Turquoise and Chi-X. SEB is authorized and regulated by Finansinspektionen in Sweden; it is authorized and subject to limited regulation by the Financial Services Authority for the conduct of designated investment business in the UK, and is subject to the provisions of relevant regulators in all other jurisdictions where SEB conducts operations. SEB Merchant Banking. All rights reserved.

Selling down on a ”deal”. Brent crude fell 6.2% last week with accelerated weakness towards the end of the week. Close of the week at $87.33/b and low of the week (and on Friday) of $85.8/b. Brent is falling another 4% this morning to $83.7/b on confirmation by Iran that a MoU text has been reached and that it will be signed on Friday this week.

So what is this ”deal” worth? Talk on the desk here this morning is that it is much like ”putting lipstick on a pig” where Trump has to sell this at home as a victory where ”the SoH has reopened”, the nuclear issue will be ironed out over the coming 60 days (or maybe 600 days?) and US consumers are getting a lower gasoline price and maybe US republicans survives the midterm elections.
The importance for Iran is that it emerges as the defacto winner of this war in the eyes of the non-US public world. That Iran now onwards is the ”ruler of the SoH” (combo of geography and new weapons systems like drones) or more softer: ”the guarantor of safe passage through the SoH”.
Iran doesn’t need nuclear weapons any more. Nuclear deterrence doesn’t work any more. Ukraine has made many attacks deep into Russia without being nuked in return. Plenty of Iranian ballistic rockets blasts over Israel but Iran wasn’t nuked in return.
There is no trust between the US and Iran. We don’t know all the details yet of the MoU. But what we do know is that there is no trust between the US and Iran what so ever. This is probably more like a descriptive text on how they can cooperate in a way where both sides keeps tactical leverage. Neither side makes irreversible concessions. Violations can be punished quickly. Cooperation produces immediate benefits.
This is a fragile structure. It can easily break down. There may be details which cannot be overcome. To be seen on Friday. The US has to show that it is willing put enough force behind managing and restraining Israel versus Hezbollah in Lebanon. We have seen that Netanyahu hasn’t listened all that much to Trump’s directives and wishes. This could be a major obstacle.
A gradual reopening is tactically preferable for Iran. A tactical leverage for Iran right now is that global oil stocks have been drawn down towards painful and increasingly dangerous levels with increasing risks for oil price spikes in mid-July to August. This together with US midterm elections on 3 November gives tactical leverage to Iran. Iran probably doesn’t want to fully give up on that leverage. A rapid, full reopening where global stocks are able to refill over the coming 60 days will significantly erode that leverage. If Iran reinstates a closure of the SoH after 60 days (if talks break down again), then the effect won’t be that impactful in terms of prices and the US midterm elections.
So a gradual and partial reopening where global markets gets the oil they need while they are unable to rebuild stocks could be a practical middle way for both parties. Trump can sell it as ”the SoH has reopened” and get affordable gasoline for US consumers. Iran can sell it as ”the SoH has fully reopened, but there is some friction” so flow is only 60-80% of normal.
Not much real demand destruction below $100/b. What we do know is that there is not much real price pain demand destruction for oil globally at an oil price below $100/b. A lot of demand-shock destruction. Fear. But demand should now come roaring back towards normal with fear for exceptionally high prices now is rapidly receding.
Sudden China demand destruction due to EVs? Bullocks. EV share of total Chinese carpool now around 13%. Share of new sales of EVs has reached 50%. This is a very gradual process. It doesn’t make oil demand fall like a rock over night. When EV new sales share reaches 100%, then the gasoline car pool will contract by some 5-10% per year. But that is only gasoline. Sudden reduction in Chinese oil demand is more about shock and risk.
Chinese crude oil imports will come roaring back. At what price? Today’s ”neutral” oil price is $70/b. That is the five year price which has steadily traded around the $70/b mark over the past 3-4 years. With still a risky picture one would think that China and the rest of the world will be big buyers of oil in the range of $70-85/b.
Global demand will likely snap back towards normal, forecasted demand and growth at such prices.
Physical reopening is a gradual process. The physical and practical reopening of the SoH will likely be gradual rather than sudden. And that probably suites Iran tactically as well.
Brent M1 price versus the Brent 5-yr (today’s ”normal” price)

Market is starting to take US/Iran headlines with a pinch of salt. Brent crude rose $2.8/b yesterday to an official close of $112.1/b. But after that it traded as low as $108.05/b before ending late night at around $109.7/b. Through the day it traded in a range of $106.87 – 112.72/b amid a flurry of news or rumors from Iran and the US. ”US temporary sanctions during negotiations” (falls alarm). ”We will bomb Iran” (not anyhow),… etc. While the market is still fluctuating to this kind of news flow, it is starting to take such headlines with a pinch of salt.
We’ll see. Maybe, maybe not. The Brent M1 contract is trading at $110.2/b this morning which very close to the average ticks through yesterday of $110.4/b.
Trump with bearish, verbal intervention whenever Brent trades above $110/b it seems. What seems to be a pattern is that Trump states something like ”very good negotiations going on with Iran”, ”New leaders in Iran are great,..”, ”Great progress in negotiations,…”, ”Deal in sight,..” etc whenever the Brent M1 contract trades above $110/b. An effort to cool the market. These hot air verbal interventions from Trump used to have a heavy bearish impact on prices, but they now seems to have less and less effect unless they are backed by reality.
As far as we can see there has been no real progress in the negotiations between the US and Iran with both sides still standing by their previous demands.
Iran is getting stronger while the cease fire lasts making a return to war for Trump yet harder. Iran is naturally in constant preparation for a return to war given Trump’s steady threats of bombing Iran again. Iran is naturally doing what ever is possible to prepare for a return to war. And every day the cease fire lasts it is better prepared. This naturally makes it more and more difficult and dangerous for the US to return to warring activity versus Iran as the consequences for energy infrastructure in the Persian Gulf will be more and more severe the longer the cease fire lasts. Israel seems to see it this way as well. That the war is not won and that current frozen state of a cease fire gives Iran opportunity to rebuild military and politically.
Global inventories are drawing down day by day. How much? In the meantime the Strait of Hormuz stays closed. There is varying measures and estimates of how much global inventories are drawing down. Our rough estimate, back of the envelope, is that global inventories are drawing down by at least some 10 mb/d or about 300 mb/d in a balance between loss of supply versus demand destruction. Other estimates we see are a monthly draw of 250-270 mb/d. The IEA only ’measured’ a draw in global observable stocks of 117 mb in April with oil on water rising 53 mb while on shore stocks fell 170 mb. But global stocks are hard to measure with large invisible, unmeasured stocks. As such a back of the envelope approach may be better.
Oil products is what the world is consuming. Oil product prices likely to rise while product stocks fall. Strategic Petroleum Reserves (SPR) are predominantly crude oil. Discharging oil from OECD SPR stocks, a sharp reduction in Chinese crude imports and a reduction in global refinery throughput of 6-7 mb/d has helped to keep crude oil markets satisfactorily supplied. But global inventories are drawing down none the less. And oil products is really what the world is consuming. So if global refinery throughput stays subdued, then demand will eventually have to match the supply of oil products. The likely path forward this summer is a steady draw down in jet fuel, diesel and gasoline. Higher prices for these. Then, if possible, higher refinery throughput and higher usage of crude in response to very profitable refinery margins. And lastly sharper draw in crude stocks and higher prices for these. But some 6 mb/d of oil products used to be exported through the Strait of Hormuz. And it may not be so easy to ramp up refinery activity across the world to compensate. Especially as Ukraine continues to damage Russian refineries as well as Russian crude production and export facilities.
Watch oil product stocks and prices as well as Brent calendar 2027. What to watch for this summer is thus oil product inventories falling and oil product premiums to crude rising. Another measure to watch is the Brent crude 2027 contract as it rises steadily day by day as the Strait of Hormuz stays closed and global oil inventories decline. The latter is close to the highest level since the start of the war and keeps rising.
The Brent M1 contract and the Brent 2027 prices and current price of jet fuel in Europe (ARA). All in USD/b

Our back of the envelope calculation of the global shortage created by the closure of the Strait of Hormuz. Note that 3.5 mb/d of discharge from SPR is also a draw. Note also that ’Forced demand loss’ of 2.5 mb/d is probably temporary and will fall back towards zero as logistics are sorted out leaving ’Price demand loss’ to do the job of balancing the market. Thus a shortfall of at least 9 mb/d created by the closure. More if SPR discharge is included and more if Forced demand loss recedes.

Brent is climbing higher. Front-month is at USD 106.3/bl this morning, close to a weekly high and a USD 9/bl jump from Mondays open. This is the move we flagged as a risk earlier in the week: the market shifting from ”a deal is around the corner” to ”this is going to take longer than we thought”.

Analyst Commodities, SEB
During April, rest-of-year Brent remained remarkably stable around USD 90/bl. A stability which rested on one single assumption: the SoH reopens around 1 May. That assumption is now slowly falling apart.
As we highlighted yesterday: every week of delay beyond 1 May adds (theoretically) ish USD 5/bl to the rest-of-year average, as global inventories draw 100 million barrels per week. i.e., a mid-May reopening implies rest-of-year Brent closer to USD 100/bl, and anything pushing into June or July takes us meaningfully higher.
What’s changed in the last 48 hours:
#1: The US military has formally warned that clearing suspected sea mines from SoH could take up to six months. That is a completely different timescale from what the financial market is pricing. Even a political deal tomorrow does not immediately reopen the strait.
#2: Trump has shifted his tone from urgency to ”strategic patience”. In yesterday’s press conference: ”Don’t rush me… I want a great deal.” The market is reading this as a president no longer feeling pressured by timelines, with the naval blockade running in the background.
#3: So far, the military activity is escalating, not de-escalating. Axios reports Iran is laying more mines in SoH. The US 3rd carrier strike group (USS George H.W. Bush) is arriving with two countermine vessels. Trump yesterday ordered the US Navy to destroy any Iranian boats caught laying mines. While CNN reports that the Pentagon is actively drawing up plans to strike Iranian SoH capabilities and individual Iranian military leaders if the ceasefire collapses. i.e., NOT a attitude consistent with an imminent deal!
Spot crude and product prices eased off the early-April highs on a combination of system rerouting and deal optimism. Both now weakening. Goldman estimates April Gulf output is reduced by 14.5 mbl/d, or 57% of pre-war supply, a number that keeps getting worse the longer this drags on.
Demand-side adaptation is ongoing: S. Korea has cut its Middle East crude dependence from 69% to 56% by pulling more from the Americas and Africa, and Japan is kicking off a second round of SPR releases from 1 May. But SPRs are finite.
Ref. to the negotiations, we should not bet on speed. The current Iranian leadership is dominated by genuine hardliners willing to absorb economic pain and run the clock to extract concessions. That is not a setup for a rapid resolution. US/Israeli media briefings keep framing the delay as ”internal Iranian divisions”, the reality is more complicated and points toward weeks and months, not days.
Our point is that the complexity is large, and higher prices have only just started (given a scenario where the negotiations drag out in time). The market spent April leaning on the USD 90/bl rest-of-year assumption; that case is diminishing by the hour. If ”early May reopening” is replaced by ”June, July or later” over the next week or two, both crude and products have meaningful room to reprice higher from here. There is a high risk being short energy and betting on any immediate political resolution(!).


Vattenfalls och Industrikrafts kärnkraftsbolag Videberg Kraft har valt Rolls-Royce SMR
Selling down on a ”deal”

Sommarväder skapar prisrally på elbörsen
Oil product price pain is set to rise as the Strait of Hormuz stays closed into summer

Solkraften pressar elpriserna dagtid
Oil product price pain is set to rise as the Strait of Hormuz stays closed into summer
Sommarväder skapar prisrally på elbörsen
Vattenfalls och Industrikrafts kärnkraftsbolag Videberg Kraft har valt Rolls-Royce SMR
Selling down on a ”deal”
-
Analys4 veckor sedan
Oil product price pain is set to rise as the Strait of Hormuz stays closed into summer
-
Nyheter2 veckor sedan
Sommarväder skapar prisrally på elbörsen
-
 Nyheter2 dagar sedan
Vattenfalls och Industrikrafts kärnkraftsbolag Videberg Kraft har valt Rolls-Royce SMR
-
Analys2 dagar sedan
Selling down on a ”deal”