

Analys
SEB Jordbruksprodukter, 1 september 2014


 Vetepriserna på termin var oförändrade i veckan som gick både i Chicago och i Paris, jämfört med veckan innan. Majs och sojabönor gick ner i pris, soja mer än majs. Smör och skummjölkspulver fortsatte falla i pris i Frankfurt, medan de steg i Chicago. Smörpriset nådde faktiskt en ny rekordnivå i Chicago. Grispriset rekylerade uppåt i USA, men höll sig stabilt i Frankfurt. IGC rapporterade i fredags och det tyngde marknaden mot slutet av veckan.
Rysslands invasion av Ukraina oroar och påverkar marknaderna: stödjande för spannmål och negativt för de varor som Ryssland bojkottar. EU har fått en ny ordförande i Polens president, Tusk, och en nyskapad utrikestaleskvinna. Taleskvinnan är en rysslandsvän medan Tusk är betydligt mer vaksam. Både USA och Storbritannien har föreslagit nya, upptrappade sanktioner mot Ryssland efter deras aggression mot Ukraina. Frankrike och Tyskland håller dock emot.
Nu på måndag är det stängt i USA.
Odlingsväder
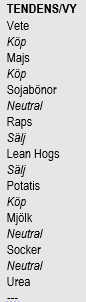
Det ihållande regnet som varit och som just nu faller extra mycket över södra Sverige, väntas som vi ser av prognosbilden nedan, vändas i motsatsen. Det fortsätter att regna endast längs gränsen mellan Tyskland och Polen, i Tjeckien, Österrike och i Italien. Italien har fått ovanligt mycket regn i år.
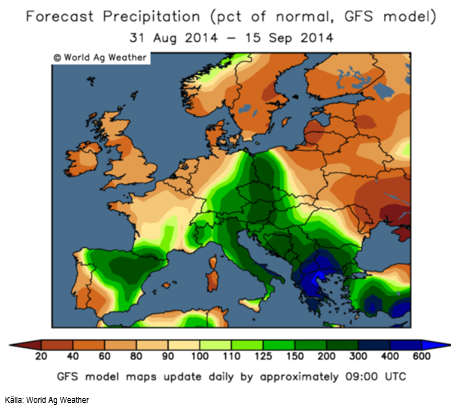
Prognoskartan för nederbörden i USA de kommande två veckorna ser fortsatt ”bearish” ut för majs och sojabönor: Det allra mest ihållande regnet på norra Prärien väntas lugna sig, men fortfarande väntas mer nederbörd än normalt. Det har varit torrt och detta är välkommet.
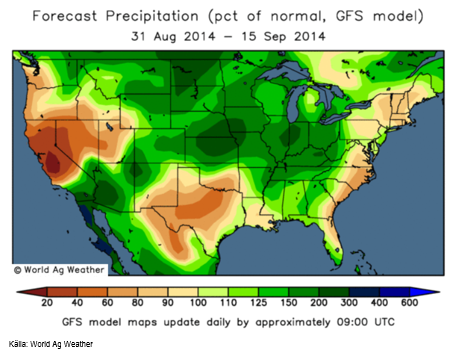
Prognosen för Ryssland och Ukraina har svängt om och visar nu onormalt lite regn de kommande två veckorna. Det kan bli ett problem för majsen där.
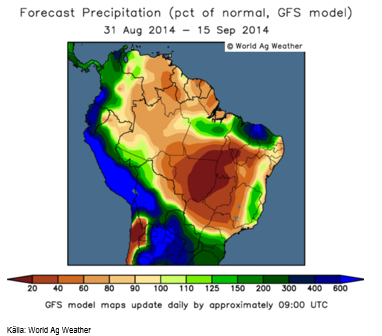
Torkan i centrala Brasilien tilltar enligt den senaste prognoskartan. Stora delar av Mato Grosso väntas få mindre än 1/5 av normal nederbörd de kommande två veckorna. Detta kommer efter en lång period av nästan lika lite nederbörd.
I Argentina väntas dock mer än normal nederbörd och det är ovälkommet. Det talas om översvämningar där.
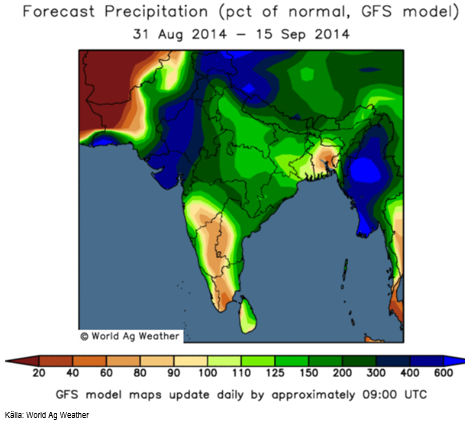
Indiens monsun väntas ge betydligt mycket mer än normal nederbörd de kommande två veckorna, som vi ser av prognoskartan nedan. Nu får även den nordvästra delen av landet mer nederbörd än normalt.
Vete
Vetepriset var väl understött hela veckan och mest i torsdags, pga oro för hur Rysslands invasion av Ukraina och hotfulla beteende mot andra Europeiska länder ska utveckla sig. På fredagen föll dock priserna tillbaka efter IGC:s rapport flyttat fokus till den stora skörden globalt.
International Grains Council rapporterade i fredags. De höjde sitt estimat för veteskörden till rekordhöga 713.4 mt för 2014/15 mot 712.5 estimerat för en månad sedan. IGC pekar på högre skörd i EU, Kina och i Ryssland. Den totala spannmålsskörden hamnar nära rekordnivån på 1976 mt enligt IGC. Utgående lager av vete justeras dock bara upp marginellt, till 195 mt (+2 mt).
Ryska Grain Union väntar sig att Ryssland får den största skörden sedan Sovjetunionen föll ihop för drygt nästan 23 år sedan. De väntar sig en spannmålsskörd på 104 mt och en export på över 30 mt. Förra året var produktionen 92.4 mt. Veteskörden i Sibirien sker huvudsakligen i september och majsskörden i södra Ryssland likaså. Vi har sett att det varit torrt i södra Ryssland i juli, men regn kan nu reparera en del av skadan.
Produktionen fördelar sig på bland annat 59.5 mt vete, 20 mt korn och 12 mt majs.
Spannmålsexporten väntas fördela sig på bland annat 23 mt vete, 4 mt majs och 3 mt korn.
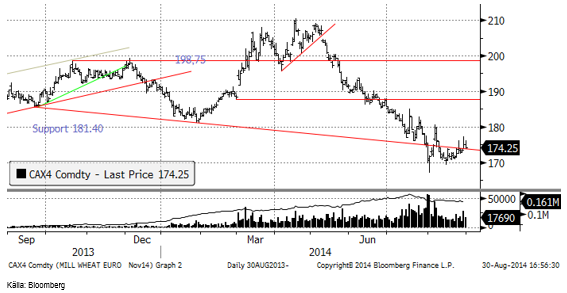
Skillnaden mellan ”London-vete” (foder) och Matif (kvarnvete) har ökat minskade faktiskt med 1% till 13% sedan förra veckan.
Chicagovetet (december) steg i torsdags och större delen av fredagen efter att det stått klart att Ryssland de facto invaderar Ukraina och Storbritannien föreslagit att Ryssland ska kopplas bort från SWIFT-systemet. SWIFT-systemet är själva infrastukturen för (internationella betalningar).

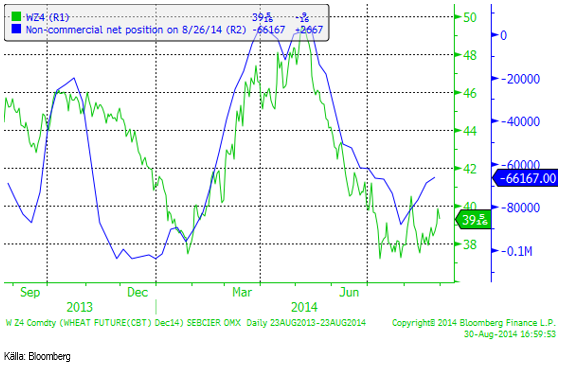
Non-commercials i CFTC:s rapport har köpt tillbaka ytterligare 2000 kontrakt och är nu nettosålda 66167 kontrakt.
Som vi ser det har läget inte förändrats sedan förra veckan. Vi tror att det på kort sikt finns en uppenbar uppsidesrisk i vetepriset. Regnen minskar i EU och enligt prognosen kommer Indien att få mer än normal monsun. Däremot oroar den upptrappning som Ryssland gör i sitt krig med Ukraina. Igår, söndag, sänkte ryskt stridsflyg två ukrainska kustbevakningsfartyg och en separatistledare sade att Ryssland ska skapa en korridor till Odessa (på frågan om det var till Mariupol man ville skapa en korridor). Detta hände efter att EU fattat beslut om att införa nya sanktioner mot Rysssland. Det är dock oklart vad dessa ska bestå av och flera EU-länder är helt beroende av rysk gas till vintern. Möjligtvis förbereder Ryssland en landstigning i södra Ukraina och om detta sker är exporten från Ukraina och i förlängningen från Ryssland i fara. Det kommer då bara att gå att exportera via Östersjön. Ett scenario där globala balanser beräknas utan rysk och ukrainsk export har inte noll i sannolikhet.
Majs
IGC höjde i torsdagens rapport sitt estimat för majsproduktionen från 969 mt till 973 mt (982 mt förra året enligt IGC). Utgående lager stiger till 190 mt för 2014/15. Det är en höjning med 3 mt sedan deras juli-rapport.
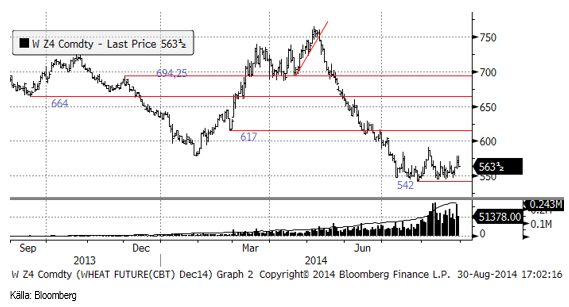
Tekniskt är priset på majs (CZ4) i en konsolideringsfas med golv på 542 cent. Motståndsnivåer finns vid ca 580 cent, vid 600 cent och vid 617 cent.
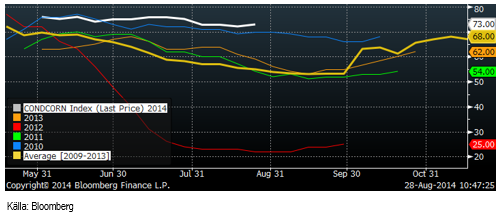
Crop condition steg 1% till 73% good/excellent i måndags.
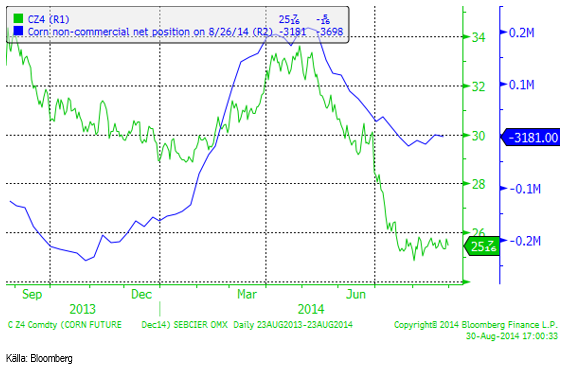
Non-commercials ökade oväntat på den korta positionen i veckan som slutade i tisdags förra veckan. Det var dock inte mycket och positionen är fortfarande mycket nära nollan, netto.
Etanolproduktionen i USA minskade från 937,000 fat per dag till 913,000 fat per dag i veckans rapport från US DOE.
Liksom för vetet tror vi att risken är på uppsidan på kort sikt, pga att vi inte tror att Rysslands aggression mot Ukraina kommer att minska och inte påverkas av EU:s och USA:s kommande sanktioner.
Sojabönor
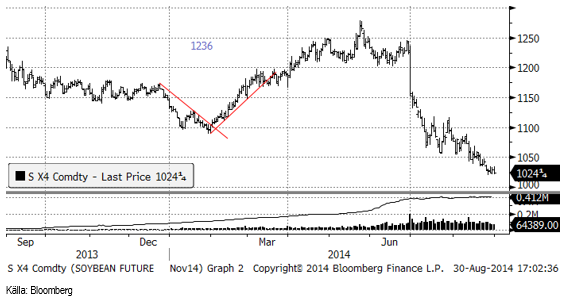
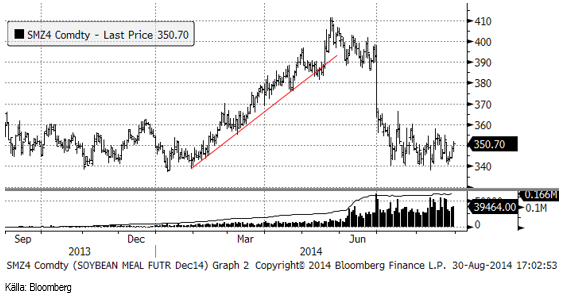
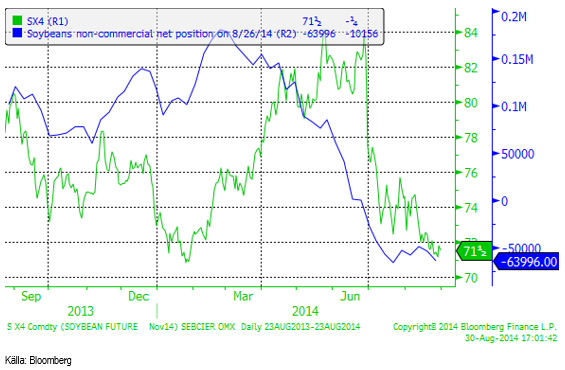
Sojabönorna gick ner 1% i veckan. Det var återigen sojaoljan som tyngde. Sojamjölet (SX4) håller sig fortfarande över den tekniska stödnivån.
Priset på sojamjöl steg kraftigt i fredags på Rysslands-oro (igen). Det börjar bli förutsägbart med prisuppgång på rysslandsoro mot slutet av veckan. Det verkar som om Ryssland gör nya drag inför varje helg och det är inte svårt att tänka sig att detta är en medveten strategi. Under helgen är det färre som följer nyhetsflödet.
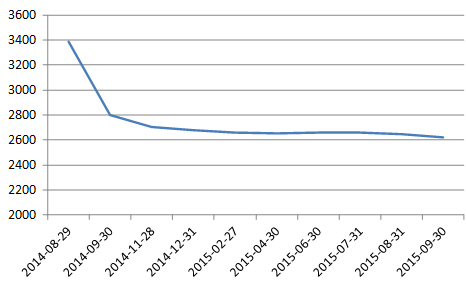
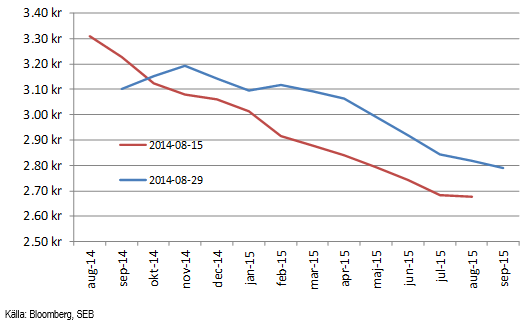
Terminskurvan för sojamjöl kan vara bra att känna till. Nedan ser vi priset i kronor per ton för sojamjöl, enligt CBOT:s terminskurva. Givet att inget händer, kommer priset att vara väsentligt lägre efter skörden i USA, än det är nu. Kilopriset faller från dagens 3.40 Kr / Kg till 2.70 Kr / Kg.
Sojaoljan föll ytterligare i fredags och nådde nu ner till 32, som vi skrev om härom veckan. Målkursen för rörelsen ser ur tekniskt perspektiv ut att vara 30 dollar.
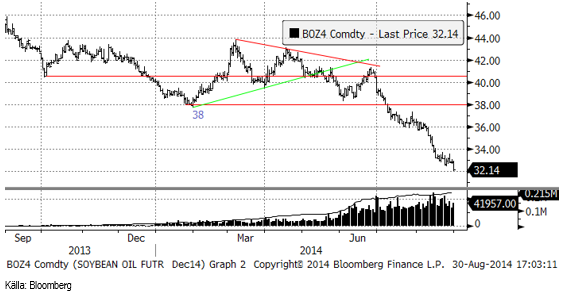
Svagheten i sojaoljan hänger ihop med svagheten för palmoljan, utan att för den skull säga något om vad det är som driver på prisfallet på vegetabilisk olja. Sannolikt är det ett allmänt överskott på vegetabilisk olja. I förhållande till sojaoljan är palmoljan fortfarande förhållandevis dyr. Sojaoljan och palmoljan har som vi ser rasat kraftigt i pris, men palmoljan har potential att rasa ännu mer!
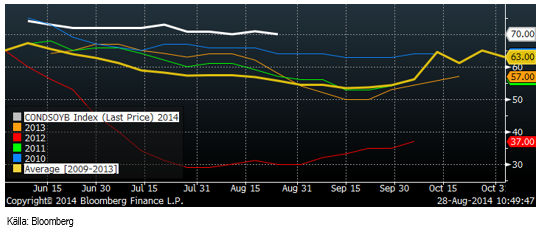
Crop condition för sojabönor sjönk 1% till 70% good/excellent i måndagens rapport.
Non-commmercials sålde återigen terminer ,10,000 kontrakt, enligt fredagens rapport, som visar ställningen per i tisdags. De är nu sålda netto 63,996 kontrakt.
Vi fortsätter med neutral rekommendation tills vidare.
Raps
Novemberkontraktet på raps steg under hela veckan, men föll i fredags. Priset har hållit sig över 320 euro per ton.
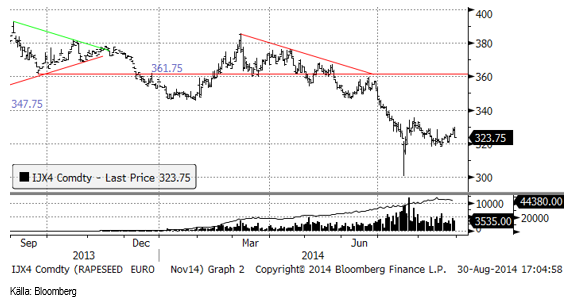
Vi behåller säljrekommendationen på rapsfröterminer.
Potatis
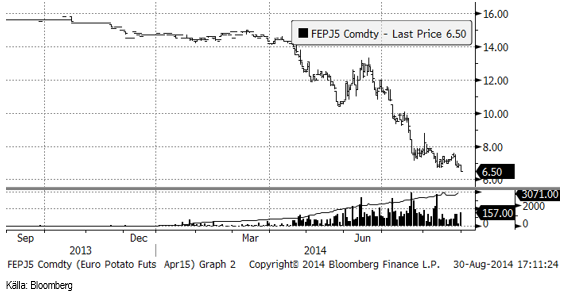
Potatispriset inledde veckan med en nedgång. När den tidigare lägstanoteringen passerades i fredags föll priset till en ny botten på 6.50 euro, där priset stannade.
Gris
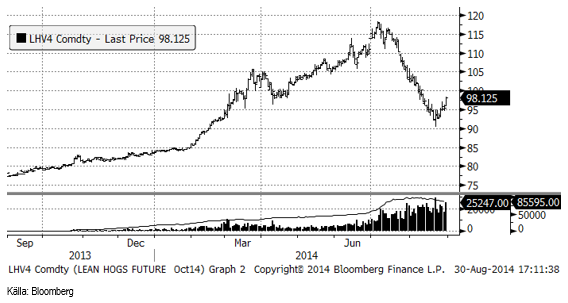
Lean hogs fortsatte upp efter att nästan ha rört vid 90 cent per pund för två veckor sedan. Priset på oktoberkontraktet stängde i fredags på 98.125 cent. Nästa motstånd ligger vid 100 cent och det är möjligt att säljarna kommer att tycka att det är ett tillräckligt bra pris och att det ska räcka för att hejda rekylen uppåt.
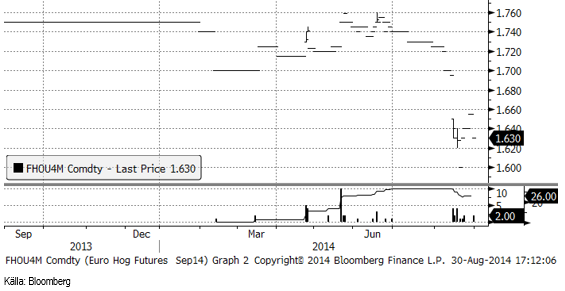
Septemberkontraktet på EUREX Hogs har efter kursfallet efter Rysslands importembargo pendlat mellan 1.60 som lägst och 1.65 som högst. Sedan förra veckan har priset sjunkit med 1 cent till 1.63.
Mjölk
I torsdags meddelade EU Kommissionen att man inför stöd för privat lagring av smör, SMP och vissa ostsorter. Stödet består av ersättning för lagringskostnaden och ska vara i drift i 90 till 120 dagar. Jordbrukskommissionären Dacian Ciolos meddelade också att han kommer att förse medlemsländerna och MEPs med en fullständig analys av de kort- och medellångsiktiga effekterna av Rysslands importembargo.
Priset på smör vände ner på EUREX i veckan, efter en liten rekyl uppåt. SMP föll också, för korta löptider, båda.
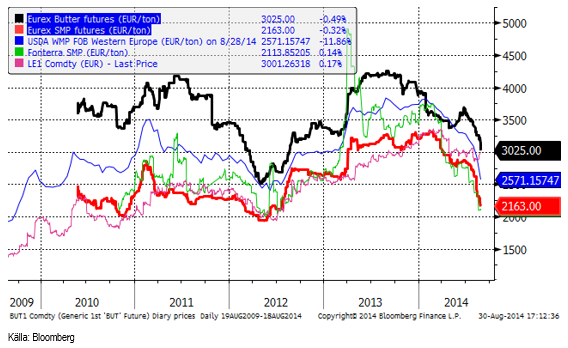
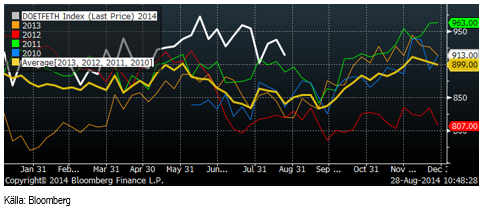
I USA noterar smörterminer all-time-high, paradoxalt nog. Priset har stigit med 62% i år. Efterfrågan på smör har ökat fem år i rad, samtidigt som efterfrågan på margarin har fallit lika länge. Enligt USDA var lagret av smör i USA hela 42% lägre i år än samma månad förra året.
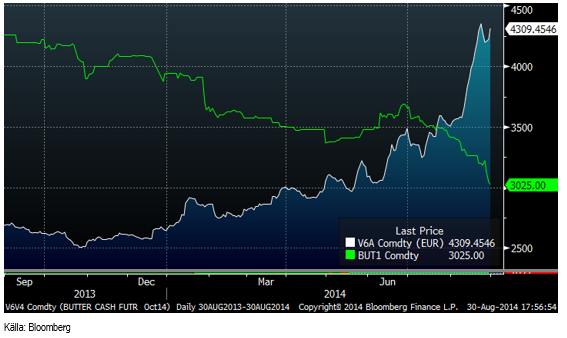
Nedan ser vi terminspriset på smör i Chicago (blå kurva) omräknat till euro per ton. Grön kurva är terminspriset på EUREX i euro per ton. USA har varit en betydande exportör av smör. Det borde gå att exportera smör från EU till de länder som köpt amerikanskt smör.
Arla sänkte aktuellt pris till 3.166 Kr / Kg för september, jämfört med 3.296 Kr / Kg i augusti, en sänkning med nästan 4% på en månad. Med normal skillnad mot EUREX-marknaden borde avräkningspriset ligga under 3 kr och om det inte blir en tvärvändning uppåt i EU-marknaden kommer prissänkningen dit att komma de närmaste månaderna.
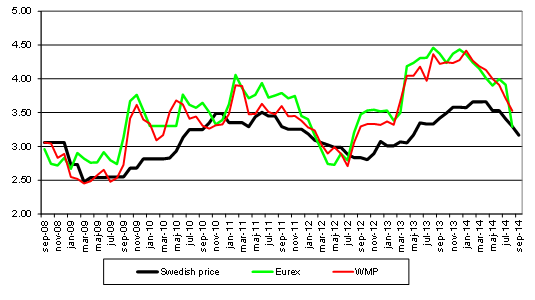
Nedan ser vi terminspriserna för mjölkråvara basis köpkurserna på terminerna för smör och SMP på EUREX, omräknat till kronor per kilo. Spotkontrakten har fallit ner till motsvarande 3.10 kr / Kg, medan de lägre faktiskt stigit lite sedan förra veckan.
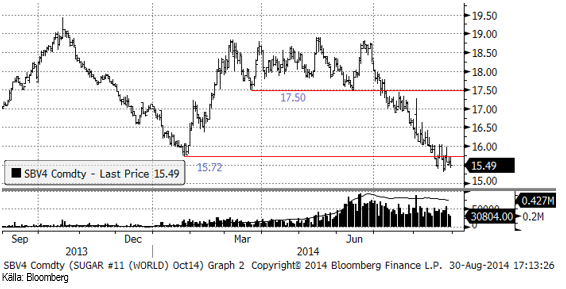
Socker
Priset på socker fortsatte falla i veckan och är nu nere på bottennivåerna som registrerades i början av året. De senaste två veckorna har priset legat mellan 15.50 och 16, i princip. Det är i nivå med botten från januari och en nivå som det är svårt att långsiktigt nå lönsamhet vid.
[box]SEB Veckobrev Jordbruksprodukter är producerat av SEB Commodities Sales desk och publiceras i samarbete och med tillstånd på Råvarumarknaden.se[/box]
Detta marknadsföringsmaterial, framtaget av SEB’s Commodities Sales desk, har upprättats enbart i informationssyfte.
Även om innehållet är baserat på källor som SEB bedömt som tillförlitliga ansvarar SEB inte för fel eller brister i informationen. Den utgör inte oberoende, objektiv investeringsanalys och skyddas därför inte av de bestämmelser som SEB har infört för att förebygga potentiella intressekonflikter. Yttranden från SEB’s Commodities Sales desk kan vara oförenliga med tidigare publicerat material från SEB, då den senare hänvisas uppmanas du att läsa den fullständiga rapporten innan någon åtgärd vidtas.
Dokumentationen utgör inte någon investeringsrådgivning och tillhandahålls till dig utan hänsyn till dina investeringsmål. Du uppmanas att självständigt bedöma och komplettera uppgifterna i denna dokumentation och att basera dina investeringsbeslut på material som bedöms erforderligt. Alla framåtblickande uttalanden, åsikter och förväntningar är föremål för risker, osäkerheter och andra faktorer och kan orsaka att det faktiska resultatet avviker väsentligt från det förväntade. Historisk avkastning är ingen garanti för framtida resultat. Detta dokument utgör inte ett erbjudande att teckna några värdepapper eller andra finansiella instrument. SEB svarar inte för förlust eller skada – direkt eller indirekt, eller av vad slag det vara må – som kan uppkomma till följd av användandet av detta material eller dess innehåll.
Observera att det kan förekomma att SEB, dess ledamöter, dess anställda eller dess moder- och/eller dotterbolag vid olika tillfällen innehar, har innehaft eller kommer att inneha aktier, positioner, rådgivningsuppdrag i samband med corporate finance-transaktioner, investment- eller merchantbankinguppdrag och/eller lån i de bolag/finansiella instrument som nämns i materialet.
Materialet är avsett för mottagaren, all spridning, distribuering mångfaldigande eller annan användning av detta meddelande får inte ske utan SEB:s medgivande. Oaktat detta får SEB tillåta omfördelning av materialet till utvald tredje part i enlighet med gällande avtal. Materialet får inte spridas till fysiska eller juridiska personer som är medborgare eller har hemvist i ett land där sådan spridning är otillåten enligt tillämplig lag eller annan bestämmelse.
Skandinaviska Enskilda Banken AB (publ) är ett [publikt] aktiebolag och står under tillsyn av Finansinspektionen samt de lokala finansiella tillsynsmyndigheter i varje jurisdiktionen där SEB har filial eller dotterbolag.

Market is starting to take US/Iran headlines with a pinch of salt. Brent crude rose $2.8/b yesterday to an official close of $112.1/b. But after that it traded as low as $108.05/b before ending late night at around $109.7/b. Through the day it traded in a range of $106.87 – 112.72/b amid a flurry of news or rumors from Iran and the US. ”US temporary sanctions during negotiations” (falls alarm). ”We will bomb Iran” (not anyhow),… etc. While the market is still fluctuating to this kind of news flow, it is starting to take such headlines with a pinch of salt.

We’ll see. Maybe, maybe not. The Brent M1 contract is trading at $110.2/b this morning which very close to the average ticks through yesterday of $110.4/b.
Trump with bearish, verbal intervention whenever Brent trades above $110/b it seems. What seems to be a pattern is that Trump states something like ”very good negotiations going on with Iran”, ”New leaders in Iran are great,..”, ”Great progress in negotiations,…”, ”Deal in sight,..” etc whenever the Brent M1 contract trades above $110/b. An effort to cool the market. These hot air verbal interventions from Trump used to have a heavy bearish impact on prices, but they now seems to have less and less effect unless they are backed by reality.
As far as we can see there has been no real progress in the negotiations between the US and Iran with both sides still standing by their previous demands.
Iran is getting stronger while the cease fire lasts making a return to war for Trump yet harder. Iran is naturally in constant preparation for a return to war given Trump’s steady threats of bombing Iran again. Iran is naturally doing what ever is possible to prepare for a return to war. And every day the cease fire lasts it is better prepared. This naturally makes it more and more difficult and dangerous for the US to return to warring activity versus Iran as the consequences for energy infrastructure in the Persian Gulf will be more and more severe the longer the cease fire lasts. Israel seems to see it this way as well. That the war is not won and that current frozen state of a cease fire gives Iran opportunity to rebuild military and politically.
Global inventories are drawing down day by day. How much? In the meantime the Strait of Hormuz stays closed. There is varying measures and estimates of how much global inventories are drawing down. Our rough estimate, back of the envelope, is that global inventories are drawing down by at least some 10 mb/d or about 300 mb/d in a balance between loss of supply versus demand destruction. Other estimates we see are a monthly draw of 250-270 mb/d. The IEA only ’measured’ a draw in global observable stocks of 117 mb in April with oil on water rising 53 mb while on shore stocks fell 170 mb. But global stocks are hard to measure with large invisible, unmeasured stocks. As such a back of the envelope approach may be better.
Oil products is what the world is consuming. Oil product prices likely to rise while product stocks fall. Strategic Petroleum Reserves (SPR) are predominantly crude oil. Discharging oil from OECD SPR stocks, a sharp reduction in Chinese crude imports and a reduction in global refinery throughput of 6-7 mb/d has helped to keep crude oil markets satisfactorily supplied. But global inventories are drawing down none the less. And oil products is really what the world is consuming. So if global refinery throughput stays subdued, then demand will eventually have to match the supply of oil products. The likely path forward this summer is a steady draw down in jet fuel, diesel and gasoline. Higher prices for these. Then, if possible, higher refinery throughput and higher usage of crude in response to very profitable refinery margins. And lastly sharper draw in crude stocks and higher prices for these. But some 6 mb/d of oil products used to be exported through the Strait of Hormuz. And it may not be so easy to ramp up refinery activity across the world to compensate. Especially as Ukraine continues to damage Russian refineries as well as Russian crude production and export facilities.
Watch oil product stocks and prices as well as Brent calendar 2027. What to watch for this summer is thus oil product inventories falling and oil product premiums to crude rising. Another measure to watch is the Brent crude 2027 contract as it rises steadily day by day as the Strait of Hormuz stays closed and global oil inventories decline. The latter is close to the highest level since the start of the war and keeps rising.
The Brent M1 contract and the Brent 2027 prices and current price of jet fuel in Europe (ARA). All in USD/b

Our back of the envelope calculation of the global shortage created by the closure of the Strait of Hormuz. Note that 3.5 mb/d of discharge from SPR is also a draw. Note also that ’Forced demand loss’ of 2.5 mb/d is probably temporary and will fall back towards zero as logistics are sorted out leaving ’Price demand loss’ to do the job of balancing the market. Thus a shortfall of at least 9 mb/d created by the closure. More if SPR discharge is included and more if Forced demand loss recedes.

Brent is climbing higher. Front-month is at USD 106.3/bl this morning, close to a weekly high and a USD 9/bl jump from Mondays open. This is the move we flagged as a risk earlier in the week: the market shifting from ”a deal is around the corner” to ”this is going to take longer than we thought”.

Analyst Commodities, SEB
During April, rest-of-year Brent remained remarkably stable around USD 90/bl. A stability which rested on one single assumption: the SoH reopens around 1 May. That assumption is now slowly falling apart.
As we highlighted yesterday: every week of delay beyond 1 May adds (theoretically) ish USD 5/bl to the rest-of-year average, as global inventories draw 100 million barrels per week. i.e., a mid-May reopening implies rest-of-year Brent closer to USD 100/bl, and anything pushing into June or July takes us meaningfully higher.
What’s changed in the last 48 hours:
#1: The US military has formally warned that clearing suspected sea mines from SoH could take up to six months. That is a completely different timescale from what the financial market is pricing. Even a political deal tomorrow does not immediately reopen the strait.
#2: Trump has shifted his tone from urgency to ”strategic patience”. In yesterday’s press conference: ”Don’t rush me… I want a great deal.” The market is reading this as a president no longer feeling pressured by timelines, with the naval blockade running in the background.
#3: So far, the military activity is escalating, not de-escalating. Axios reports Iran is laying more mines in SoH. The US 3rd carrier strike group (USS George H.W. Bush) is arriving with two countermine vessels. Trump yesterday ordered the US Navy to destroy any Iranian boats caught laying mines. While CNN reports that the Pentagon is actively drawing up plans to strike Iranian SoH capabilities and individual Iranian military leaders if the ceasefire collapses. i.e., NOT a attitude consistent with an imminent deal!
Spot crude and product prices eased off the early-April highs on a combination of system rerouting and deal optimism. Both now weakening. Goldman estimates April Gulf output is reduced by 14.5 mbl/d, or 57% of pre-war supply, a number that keeps getting worse the longer this drags on.
Demand-side adaptation is ongoing: S. Korea has cut its Middle East crude dependence from 69% to 56% by pulling more from the Americas and Africa, and Japan is kicking off a second round of SPR releases from 1 May. But SPRs are finite.
Ref. to the negotiations, we should not bet on speed. The current Iranian leadership is dominated by genuine hardliners willing to absorb economic pain and run the clock to extract concessions. That is not a setup for a rapid resolution. US/Israeli media briefings keep framing the delay as ”internal Iranian divisions”, the reality is more complicated and points toward weeks and months, not days.
Our point is that the complexity is large, and higher prices have only just started (given a scenario where the negotiations drag out in time). The market spent April leaning on the USD 90/bl rest-of-year assumption; that case is diminishing by the hour. If ”early May reopening” is replaced by ”June, July or later” over the next week or two, both crude and products have meaningful room to reprice higher from here. There is a high risk being short energy and betting on any immediate political resolution(!).
Down on Friday. Up on Monday. The Brent June crude oil contract traded down 5.1% last week to a close of $90.38/b. It reached a high of $103.87/b last Monday and a low of $86.09/b on Friday as Iran announced that the Strait of Hormuz was fully open for transit. That quickly changed over the weekend as the US upheld its blockade of Iranian oil exports while Iran naturally responded by closing the SoH again. The US blew a hole in the engine room of the Iranian ship TOUSKA and took custody of the ship on Sunday. Brent crude is up 5.6% this morning to $95.4/b.
The cease-fire is expiring tomorrow. The US has said it will send a delegation for a second round of negotiations in Islamabad in Pakistan. But Iran has for now rejected a second round of talks as it views US demands as unrealistic and excessive while the US is also blocking the Strait of Hormuz.
While Brent is up 5% this morning, the financial market is still very optimistic that progress will be made. That talks will continue and that the SoH will fully open by the start of May which is consistent with a rest-of-year average Brent crude oil price of around $90/b with the market now trading that balance at around $88/b.
Financial optimism vs. physical deterioration. We have a divergence where the financial market is trading negotiations, improvements and resolution while at the same time the physical market is deteriorating day by day. Physical oil flows remain constrained by disrupted flows, longer voyage times and elevated freight and insurance costs.
Financial markets are betting that a US/Iranian resolution will save us in time from violent shortages down the road. But every day that the SoH remains closed is bringing us closer to a potentially very painful point of shortages and much higher prices.
The US blockade is also a weapon of leverage against its European and Asian allies. When Iran closed the SoH it held the world economy as a hostage against the US. The US blockade of the SoH is of course blocking Iranian oil exports. But it is also an action of disruption directed towards Europe and Asia. The US has called for the rest of the world to engaged in the war with Iran: ”If you want oil from the Persian Gulf, then go and get it”. A risk is that the US plays brinkmanship with the global oil market directed towards its European and Asian allies and maybe even towards China to force them to engage and take part. Maybe unthinkable. But unthinkable has become the norm with Trump in the White House.


Sommarväder skapar prisrally på elbörsen
Oil product price pain is set to rise as the Strait of Hormuz stays closed into summer

Solkraften pressar elpriserna dagtid

Michel Gubel ger sin syn på oljemarknaden