

Analys
Råvaruplanket – Lägre priser driver lägre priser

![]() Oljan sätter tonen
Oljan sätter tonen
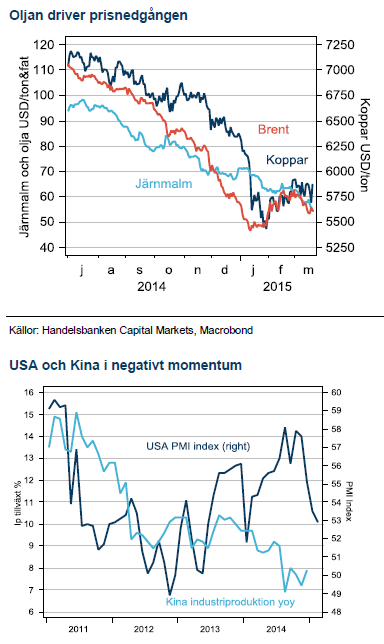
Februari månads kraftiga uppgång på 25% i oljepriset fick ett abrupt slut i mars när marknadens fokus återvände till underliggande fundamenta som i våra ögon inte förbättrats trots att snart nio månader passerat sedan oljeraset startade i juli 2014. Olja är inte bara centralt för världsekonomin, det är också den råvara med störst inflytande på produktionskostnaden för andra råvaror. Det är därför svårt att se stora prisuppgångar i metaller eller elpriser när de lägre oljepriserna fortsätter att äta sig in i produktionskostnaden för råvaror.
 Kina sänker basmetallerna…
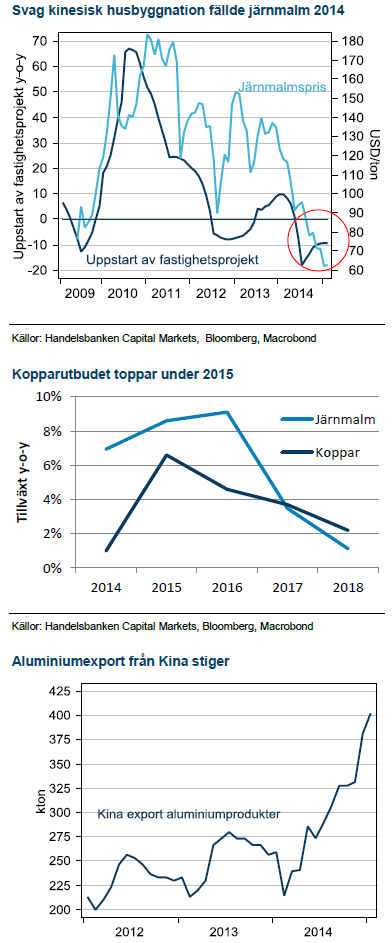
Kinas makrodata är inne i en svår period med nyårsledigheten som störande moment. Fastighetspriserna visade dock rekordfall i februari och de är just nu drivkraften nummer ett, via mindre nybyggnation, till lägre priser på basmetaller.
…och USA sänker ädelmetallerna
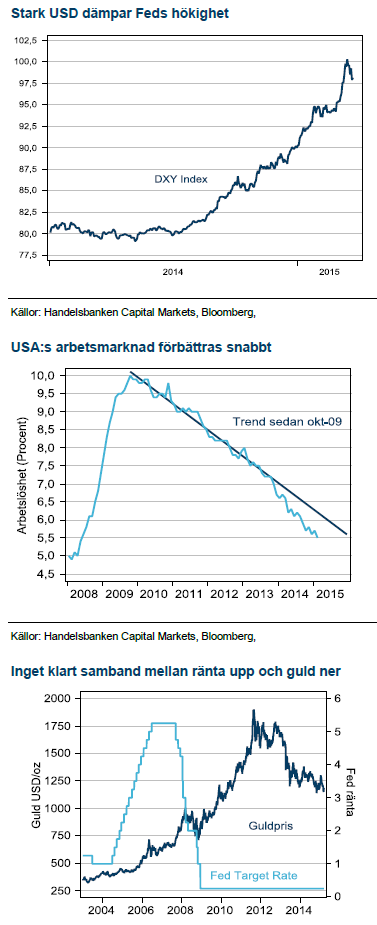
Förra veckans besked från Fed var oväntat mjukt. Det fick guld att handlas upp med 2 %. Det visar att guldets känslighet för Feds kommande höjning finns kvar och Feds anträdande av höjningscykeln kommer pressa guldpriset som bubblat under sju års expansiv penningpolitik.
Vete stiger med USD
En stark USD minskar efterfrågan på amerikanskt vete. Istället vänder sig köparna till Europa och det har drivit upp vete i Paris under mars. Goda förutsättningar för en ny bra global skörd får oss dock att tro på lägre priser.
Basmetaller
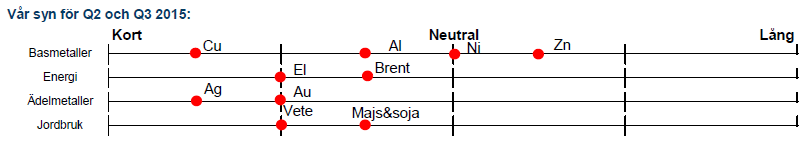
 Inget nickelrally i sikte
Våra förhoppningar på stigande nickelpriser under 2015 var höga. För höga. Under vår resa till Indonesien framkom att Kina inte lider av Indonesiens exportförbud på nickelmalm såsom marknaden förväntat sig. Bristen på Indonesisk malm har i stor utsträckning kompenserats av ökad export från Filipinerna. Kinas efterfrågan på rostfritt stål har också fallit och i en sådan marknad räcker inte Indonesiens exportförbud till för att driva priset.
Koppar från 6000 till USD 5000
Vi har länge haft tron att kopparpriset ska falla. Utbudsvågen som var aviserad till 2014 har i stor utsträckning flyttats fram till 2015. Ett välbekant tema i kopparindustrin är utbudsstörningar. Även i år har dessa gjort sig påminda och senast är det världens näst största koppargruva, Grasberg som strängt produktionen efter blockad av gruvarbetare. Utbudsstörningarna i koppar är en av faktorerna som gör att koppar inte strukturellt går att likna vid järnmalm och därför tro vi inte att nedgången blir lika dramatisk. Lägre efterfrågan i Kina parat med högre tillväxt i gruvproduktionen är dock fortfarande en missmatch som vi tror får ner priset till 5500 USD/ton under första halvåret och handel ner till USD 5000 under andra halvåret.
Aluminium fallit ur sin kanal
Kina har under en flerårig process skapat överkapacitet när nya aluminiumsmältverk etablerats när kolfälten i de västra provinserna samtidigt som de gamla, kustnära inte stängts ned i den omfattning man tänkt sig. Kina har en lång tradition av svårighet att få bukt med överkapacitet då ledarna värnar om arbetsmarknaden under stundande inbromsning i tillväxten. Export av aluminium är belagd med en skatt men export av bearbetade aluminiumkomponenter stiger nu kraftigt och pressar priserna i Väst. Marknadsbalansen i Väst brukar anses vara i balans men kommer fortsätta pressas av kinesisk export i våra ögon.
Energi
Opec ska inte sänka
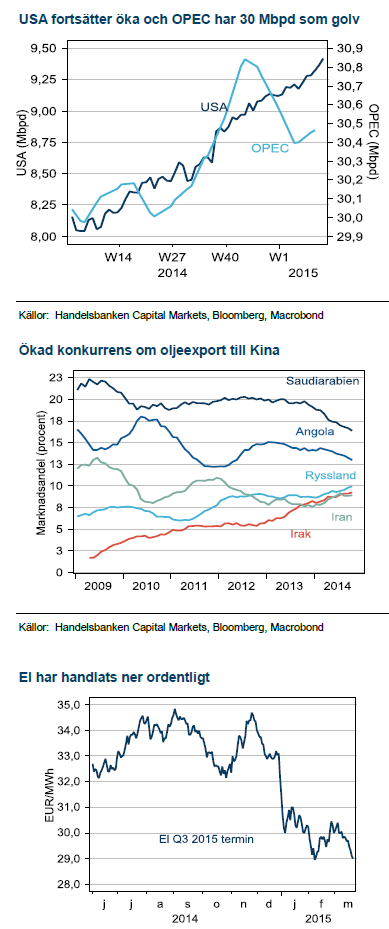 Med drygt två månader kvar till OPEC:s möte den 5:e juni i Wien har det åter börjat byggas upp förhoppningar om att kartellen ska strama upp marknaden och reglera överproduktionen som pressat priset. Vi sätter ingen tilltro till de förhoppningarna. Om OPEC skulle minska produktionen nu har hela prisnedgången varit för gäves och USA skifferproducenter kommer åter öka produktionen i samma takt som förut.
Riggräkning inte central
Marknaden har haft ett starkt fokus på rekordfallet i antalet aktiva borriggar i USA under februari. Ett flertal mekanismer gör att antalet borrade hål inte är proportionell mot oljeproduktionen i skifferfälten i det kortare perspektivet. Kostnadsfokus bland producenterna pågår i storleksordningen 30-50% under 2015 och ökar livskraften i Amerikanska skifferfält.
Iranfrågan på bordet
USA har indikerat att häv av sanktionerna mot Irans export av olja kan vara nära förestående. Förhandlingarna med Iran som hålls i Genève har en deadline i slutet av mars, ännu kvarstår flera viktiga detaljer enligt talesmän men USA:s uttalande har väkt förhoppningar som fått oljepriset på nytt fall. Iran har sagt sig kunna växla upp sin export mer eller mindre omedelbart, även om vi tror att USA kommer häva sanktionerna successivt för att behålla kontrollmedel över Irans kärnvapenaktivitet och inte dra undan mattan för skifferproducenterna. Kommer Iran tillbaka med 1 miljon fat per dag i export neutraliseras hela den förväntade nedgången i tillväxt i USA:s skifferfält. I det scenariot ser vi Brent omkring USD 40, men sannolikheten är lägre än 30%. Iranframsteg har följts av bakslag enligt historien.
Nedgång på elmarknaden
Vår syn är fortsatt negativ på elprisutvecklingen kommande halvår. Förra veckan rullade SHB elcertifikat till Q3 terminen som underliggande, där vi ser en nedsida på 2 EUR från dagens 24,4 EUR förutsatt att inte nuvarande vädertrender bryts fram till SHB rullar ur Q3 och in i Q4 under första veckan i juni. God tillrinning i vattenmagasinen från gynnsamma snölägen är en faktor som sänker prisbilden. Jämförelser med fjolårets prisnivå är förvirrande eftersom fjolåret hade en extremt varm och torr sommar som gav låg vindkraftsproduktion och dålig tillrinning samtidigt som Tyskland export av solkraft var låg med mycket ruskväder.
Ädelmetaller
 Fed har mjuknat
Vi har tidigare haft för högt ställda förväntningar på hur snart Fed ska genomföra sin första räntehöjning. Efter senaste beskedet från Fed den 18:e mars signalerades en långsammare räntehöjning efter att framförallt USD har stärkts markant. Guld steg 2 % på Feds avvaktande tonläge och den stora prisrörelsen visar att det fortfarande finns mycket prispåverkan kvar i guld beroende på hur Fed agerar. I dagsläget prisas en räntehöjning in fullt ut i september av räntemarknaden.
Feds supermjuka penningpolitik var den främsta drivkraften till guldprisuppgången efter finanskrisen. När Fed nu ska börja på åtstramningscykeln kommer det ha negativ inverkan på guldpriset. En stor del av nedgången har sannolikt redan kommit när Fed först började prata om åtstramning under 2013. Med Feds svåranalyserade start av räntehöjningscykeln är det dock rimligt att mer finns kvar.
Silver årets vinnare
Silver har oväntat dykt upp som årets bästa råvara, upp 6 % efter ett rally på 17% efter att Schweiz centralbank beslutade att överge golvet för växelkursen mot EUR samtidigt som Grexit oron eskalerade. Februari månads starka USA data och en allt starkare dollar lade sorti på årets starka inledning.
Vårt tema är att silver följer guld och årets Fed-höjning bör få silverpriset på fall. Silver har åter visat sig följa guldets rörelser men med en klart högre volatilitet. Kort silver är därför en av de bästa positionerna för en Fedhöjning.
Jordbruk
 Normaliseringen fortsätter
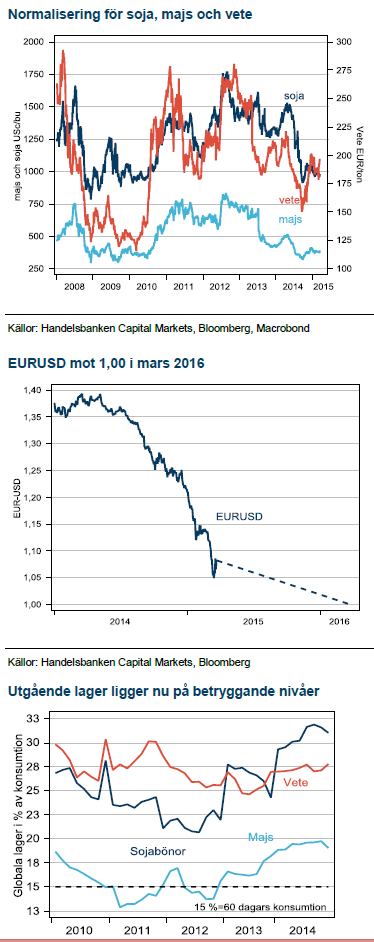
Vi har ändrat mycket lite i vår syn på soja, vete och majs. Det stora temat där priserna håller på att normalisera sig efter torkan i USA 2012 är fortfarande aktuellt. Det tar flera år att återställa globala säkerhetslager och i den processen finns alltid ett inslag av riskpremie i priserna som successivt handlas ut. I det spelet är majs och soja de två av de tre stora grödorna som kommit närmst sina gamla prisnivåer och produktionskostnad. Ett nytt år av stigande globala lager kan dock pressa även dessa grödor ytterligare.
Vete stiger på starkare USD
Till skillnad från USD-noterade råvaror så stiger det europeiska vetet handlat i EUR när USD blir allt starkare. De stora lagren i USA avsedda för exportmarknaden blir allt mindre attraktiva med en högre värderad USD då så gott som alla importörer inte är USD-lännä, kanske inte men det blir lite konstigt om vi der. Det dyra USD-noterade USA-vetet ökar attraktionen i europeisk EUR-noterat vete och har lett till en prisuppgång i år. Trenden har förstärkts av torrt väder i USA just under den känsliga perioden på våren.
Inte ett givet säljläge i vete
Även om vi tror att riskpremien för torrt väder kommer gå ner fram till skörd så är trenden med starkare USD mot EUR här för att stanna detta år. SHB har en prognos där växelkursen ska gå mot paritet på 12 månaders sikt. Det betyder att efterfrågan på Europeisk vete kan komma att överraska och det kan komma bättre säljlägen i vete närmre sommaren.
[box]SHB Råvaruplanket är producerat av Handelsbanken och publiceras i samarbete och med tillstånd på Råvarumarknaden.se[/box]
Ansvarsbegränsning
Detta material är producerat av Svenska Handelsbanken AB (publ) i fortsättningen kallad Handelsbanken. De som arbetar med innehållet är inte analytiker och materialet är inte oberoende investeringsanalys. Innehållet är uteslutande avsett för kunder i Sverige. Syftet är att ge en allmän information till Handelsbankens kunder och utgör inte ett personligt investeringsråd eller en personlig rekommendation. Informationen ska inte ensamt utgöra underlag för investeringsbeslut. Kunder bör inhämta råd från sina rådgivare och basera sina investeringsbeslut utifrån egen erfarenhet.
Informationen i materialet kan ändras och också avvika från de åsikter som uttrycks i oberoende investeringsanalyser från Handelsbanken. Informationen grundar sig på allmänt tillgänglig information och är hämtad från källor som bedöms som tillförlitliga, men riktigheten kan inte garanteras och informationen kan vara ofullständig eller nedkortad. Ingen del av förslaget får reproduceras eller distribueras till någon annan person utan att Handelsbanken dessförinnan lämnat sitt skriftliga medgivande. Handelsbanken ansvarar inte för att materialet används på ett sätt som strider mot förbudet mot vidarebefordran eller offentliggörs i strid med bankens regler.


Brent is climbing higher. Front-month is at USD 106.3/bl this morning, close to a weekly high and a USD 9/bl jump from Mondays open. This is the move we flagged as a risk earlier in the week: the market shifting from ”a deal is around the corner” to ”this is going to take longer than we thought”.

Analyst Commodities, SEB
During April, rest-of-year Brent remained remarkably stable around USD 90/bl. A stability which rested on one single assumption: the SoH reopens around 1 May. That assumption is now slowly falling apart.
As we highlighted yesterday: every week of delay beyond 1 May adds (theoretically) ish USD 5/bl to the rest-of-year average, as global inventories draw 100 million barrels per week. i.e., a mid-May reopening implies rest-of-year Brent closer to USD 100/bl, and anything pushing into June or July takes us meaningfully higher.
What’s changed in the last 48 hours:
#1: The US military has formally warned that clearing suspected sea mines from SoH could take up to six months. That is a completely different timescale from what the financial market is pricing. Even a political deal tomorrow does not immediately reopen the strait.
#2: Trump has shifted his tone from urgency to ”strategic patience”. In yesterday’s press conference: ”Don’t rush me… I want a great deal.” The market is reading this as a president no longer feeling pressured by timelines, with the naval blockade running in the background.
#3: So far, the military activity is escalating, not de-escalating. Axios reports Iran is laying more mines in SoH. The US 3rd carrier strike group (USS George H.W. Bush) is arriving with two countermine vessels. Trump yesterday ordered the US Navy to destroy any Iranian boats caught laying mines. While CNN reports that the Pentagon is actively drawing up plans to strike Iranian SoH capabilities and individual Iranian military leaders if the ceasefire collapses. i.e., NOT a attitude consistent with an imminent deal!
Spot crude and product prices eased off the early-April highs on a combination of system rerouting and deal optimism. Both now weakening. Goldman estimates April Gulf output is reduced by 14.5 mbl/d, or 57% of pre-war supply, a number that keeps getting worse the longer this drags on.
Demand-side adaptation is ongoing: S. Korea has cut its Middle East crude dependence from 69% to 56% by pulling more from the Americas and Africa, and Japan is kicking off a second round of SPR releases from 1 May. But SPRs are finite.
Ref. to the negotiations, we should not bet on speed. The current Iranian leadership is dominated by genuine hardliners willing to absorb economic pain and run the clock to extract concessions. That is not a setup for a rapid resolution. US/Israeli media briefings keep framing the delay as ”internal Iranian divisions”, the reality is more complicated and points toward weeks and months, not days.
Our point is that the complexity is large, and higher prices have only just started (given a scenario where the negotiations drag out in time). The market spent April leaning on the USD 90/bl rest-of-year assumption; that case is diminishing by the hour. If ”early May reopening” is replaced by ”June, July or later” over the next week or two, both crude and products have meaningful room to reprice higher from here. There is a high risk being short energy and betting on any immediate political resolution(!).
Down on Friday. Up on Monday. The Brent June crude oil contract traded down 5.1% last week to a close of $90.38/b. It reached a high of $103.87/b last Monday and a low of $86.09/b on Friday as Iran announced that the Strait of Hormuz was fully open for transit. That quickly changed over the weekend as the US upheld its blockade of Iranian oil exports while Iran naturally responded by closing the SoH again. The US blew a hole in the engine room of the Iranian ship TOUSKA and took custody of the ship on Sunday. Brent crude is up 5.6% this morning to $95.4/b.

The cease-fire is expiring tomorrow. The US has said it will send a delegation for a second round of negotiations in Islamabad in Pakistan. But Iran has for now rejected a second round of talks as it views US demands as unrealistic and excessive while the US is also blocking the Strait of Hormuz.
While Brent is up 5% this morning, the financial market is still very optimistic that progress will be made. That talks will continue and that the SoH will fully open by the start of May which is consistent with a rest-of-year average Brent crude oil price of around $90/b with the market now trading that balance at around $88/b.
Financial optimism vs. physical deterioration. We have a divergence where the financial market is trading negotiations, improvements and resolution while at the same time the physical market is deteriorating day by day. Physical oil flows remain constrained by disrupted flows, longer voyage times and elevated freight and insurance costs.
Financial markets are betting that a US/Iranian resolution will save us in time from violent shortages down the road. But every day that the SoH remains closed is bringing us closer to a potentially very painful point of shortages and much higher prices.
The US blockade is also a weapon of leverage against its European and Asian allies. When Iran closed the SoH it held the world economy as a hostage against the US. The US blockade of the SoH is of course blocking Iranian oil exports. But it is also an action of disruption directed towards Europe and Asia. The US has called for the rest of the world to engaged in the war with Iran: ”If you want oil from the Persian Gulf, then go and get it”. A risk is that the US plays brinkmanship with the global oil market directed towards its European and Asian allies and maybe even towards China to force them to engage and take part. Maybe unthinkable. But unthinkable has become the norm with Trump in the White House.
Wild moves yesterday. Brent crude traded to a high of $114.43/b and a low of $96.0/b and closed at $99.94/b yesterday.
US – Iran negotiations ongoing or not? What a day. Donald Trump announced that good talks were ongoing between Iran and the US and that the 48 hour deadline before bombing Iranian power plants and energy infrastructure was postponed by five days subject to success of ongoing meetings. Iranian media meanwhile stated that no meetings were ongoing at all.
Today we are scratching our heads trying to figure out what yesterday was all about.
Friends and family playing the market? Was it just Trump and his friends and family who were playing with oil and equity markets with $580m and $1.46bn in bets being placed by someone in oil and equity markets just 15 minutes before Trump’s announcement?
Was Trump pulling a TACO as he reached his political and economic pain point: Brent at $112/b, US Gas at $4/gal, SPX below 200dma and US 10yr above 4.4%?
Different Iranian factions with Trump talking with one of them? Are there real negotiations going on but with the US talking to one faction in Iran while another, the hardliners, are not involved and are denying any such negotiations going on?
Extending the ultimatum to attack and invade Kharg island next weekend? Or, is the five day delay of the deadline a tactical decision to allow US amphibious assault ships and marines to arrive in the Gulf in the upcoming weekend while US and Israeli continues to degrade Iranian military targets till then. And then next weekend a move by the US/Israel to attack and conquer for example the Kharg island?
We do not really know which it is or maybe a combination of these.
We did get some kind of TACO ydy. But markets have been waiting for some kind of TACO to happen and yesterday we got some kind of TACO. And Brent crude is now trading at $101.5/b as a result rather than at $112-114/b as it did no the high yesterday.
But what really matters in our view is the political situation on the ground in Iran. Will hardliners continue to hold power or will a more pragmatic faction gain power?
If the hardliners remain in power then oil pain should extend all the way to US midterm elections. The hardliners were apparently still in charge as of last week. Iran immediately retaliated and damaged LNG infrastructure in Qatar after Israel hit Iranian South Pars. The SoH was still closed and all messages coming out of Iran indicated defiance. Hardliners continues in power has a huge consequence for oil prices going forward. The regime has played its ’oil-weapon’ (closing or chocking the Strait of Hormuz). It is using it to achieve political goals. Deterrence: it needs to be so politically and economically expensive to attack Iran that it won’t happen again in the future. Or at least that the US/Israel thinks 10-times over before they attack again. The highest Brent crude oil closing price since the start of the war is $112.19/b last Friday. In comparison the 20-year inflation adjusted Brent price is $103/b. So Brent crude last Friday at $112.19/b isn’t a shockingly high price. And it is still far below the nominal high of $148/b from 2008 which is $220/b if inflation adjusted. So once in a lifetime Iran activates its most powerful weapon. The oil weapon. It needs to show the power of this weapon and it needs to reap political gains. Getting Brent to $112/b and intraday high of $119.5/b (9 March) isn’t a display of the power of that weapon. And it is not a deterrence against future attacks.
So if the hardliners remain in power in Iran, then the SoH will likely remain chocked all the way to US midterm elections and Brent crude will at a minimum go above the historical nominal high of $148/b from 2008.
Thus the outlook for the oil price for the rest of the year doesn’t depend all that much of whether Trump pulls a TACO or not. Stops bombing or not. It depends more on who is in charge in Iran. If it is the hardliners, then deterrence against future attacks via chocking of the SoH and high oil prices is the likely line of action. It is impacting the world but the Iranian ’oil-weapon’ is directed towards the US president and the the US midterm elections.
If a pragmatic faction gets to power in Iran, then a very prosperous future is possible. However, if power is shifting towards a more pragmatic faction in Iran then a completely different direction could evolve. Such a faction could possibly be open for cooperation with the US and the GCC and possibly put its issues versus Israel aside. Then the prosperity we have seen evolving in Dubai could be a possible future also for Iran.
So far it looks like the hardliners are fully in charge. As far as we can see, the hardliners are still fully in control in Iran. That points towards continued chocking of the SoH and oil prices ticking higher as global inventories (the oil market buffers) are drawn lower. And not just for a few more weeks, but possibly all the way to the US midterm elections.


Brent crude up USD 9/bl on the week… ”deal around the corner” narrative fades
Market Still Betting on Timely Resolution, But Each Day Raises Shortage Risk

Christian Kopfer om läget för oljan

Marknaden måste börja betrakta de höga kopparpriserna som det nya normala

Det fysiska spotpriset på brentolja har slagit nytt rekord

40 minuter med Javier Blas om hur världen verkligen påverkas av energikrisen

Elpriserna fördubblas, stor osäkerhet inför sommaren
Det fysiska spotpriset på brentolja har slagit nytt rekord
Marknaden måste börja betrakta de höga kopparpriserna som det nya normala
Christian Kopfer om läget för oljan
-
 Nyheter3 veckor sedan
40 minuter med Javier Blas om hur världen verkligen påverkas av energikrisen
-
 Nyheter4 veckor sedan
Elpriserna fördubblas, stor osäkerhet inför sommaren
-
 Nyheter3 veckor sedan
Det fysiska spotpriset på brentolja har slagit nytt rekord
-
 Nyheter2 veckor sedan
Marknaden måste börja betrakta de höga kopparpriserna som det nya normala
-
 Nyheter2 veckor sedan
Christian Kopfer om läget för oljan
-

 Nyheter3 veckor sedan
Efter tillväxten: Guldbrev satsar på expansion i Europa
-
Analys4 dagar sedan
Market Still Betting on Timely Resolution, But Each Day Raises Shortage Risk
-
Analys7 timmar sedan
Brent crude up USD 9/bl on the week… ”deal around the corner” narrative fades