

Analys
Oil hurt by trade war concerns but fundamentals are bullish

 Oil demand growth is super strong, inventories are declining, oil production in Venezuela is collapsing, renewed disturbances in Libya, OPEC+ is all in on production cuts, high probability for renewed Iran sanctions in May and booming US shale oil production recently hit a wall as there are not enough pipelines to get oil from wells to market. Still the Brent crude oil price tanked 3.2% over the past week with a close of 67.11/bl on Friday along with China – US trade war concerns.

Bjarne Schieldrop, Chief analyst commodities
There are thus a lot of good reasons to be bullish oil but they are currently all being Trumped by the China – US trade war concerns at the moment. Declining German imports and exports in February out this morning highlights the fact that Europe’s largest economy has hit a soft-patch. The inversion of the one-month US overnight indexed swap rate is also a bad signal from the interest rate market.
Markets are rebounding this morning with the S&P 500 futures gaining 0.6% after Friday’s 1.4% sell-off. Brent crude is also rebounding 0.5% to $67.4/bl following Friday’s 1.8% sell-off.
The market is currently concerned for the escalating China – US trade war tensions. And with good reason since this will be bad for global growth and oil demand growth further down the road. However, oil market fundamentals are tightening and oil prices looks set to be squeezed higher as long as OPEC+ sticks to its cuts.
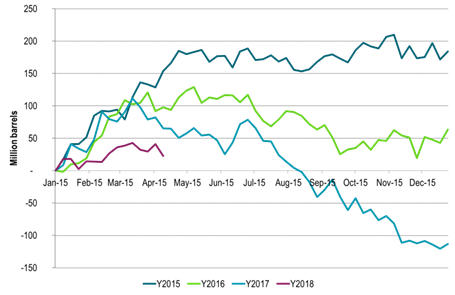
Global crude and product stocks now in decline – down 18 m bl last week
Global inventories declined 18 m bl last week with declines across the board (US, EU, Sing, floating). Inventories have been rising during the first part of this year as is normal seasonally and as has been the case over the past three weeks as well. Though gains this year has been much smaller than in previous years. Last year inventories rose 112 m bl from the start of the year to mid-March. This year they only increased 43 m bl to mid-March and are now clearly in decline. As long as OPEC+ sticks to its cuts we expect inventories to decline here onwards thus leading to a renewed tightening of the crude oil spot market.
Very strong oil demand growth
Though there are clouds on the economic horizon the latest data on oil demand growth is super strong. News out this morning from the Chinese National Development and Reform commission states that Chinese oil product consumption raises 6.4% y/y for January and February. India’s oil product demand is up close to 9% y/y in February on the back of strong growth in transportation. Also the US is experiencing exceptionally strong oil demand growth due to economic growth and cold winter weather. US Oil product demand grew 6% y/y in February. In comparison the IEA this year expects Chinese oil demand to grow at a much lower pace of 3.4% and India to grow by 6.4%. At the start of the year global oil demand growth looks like it is growing at a pace of around 2.5% y/y. That is at the very high end of oil demand growth projections for 2018. It is higher than our current 1.8% 2018 projection and way higher than IEA’s 1.5% growth projection.
Risks on supply – Venezuela, Iran, Libya and US shale oil pipeline bottlenecks
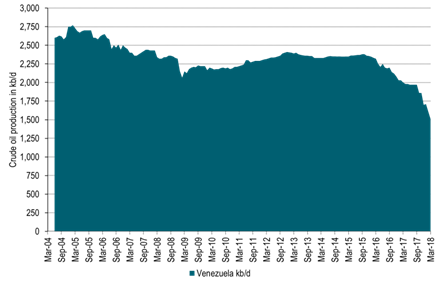
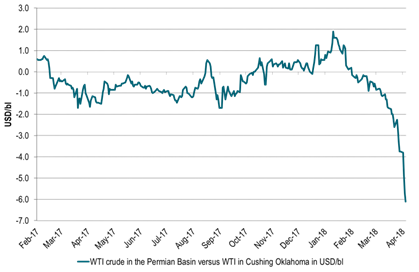
Oil production in Venezuela continued its steep decline in March as it declined from 1.55 to 1.51 m bl/d. That is down 450 k bl/d y/y and the monthly annualized decline rate in March was close to the same at 480 k bl/d. PdV in Venezuela will likely have to close three out of its four refineries due to lack of crude, workers and spare parts. The recent appointment of John Bolton as US national security advisor and Mike Pompeo as US secretary of state makes it highly likely in our view that Donald Trump will revive sanctions towards Iran when it is time to waive the sanctions again on May 12. How much Iranian supply we might loose on this is hard to say but it is at least not positive for Iranian exports and will likely drive Iranian oil exports more strongly towards China and the new renminbi INE oil contract. Libya’s oil exports slipped back in March on the back of disruptions in the southwestern oil filed El Feel. The political situation seems to be deteriorating at the moment with dire political projections for the country. Permian WTI crude prices are trading at deep price discounts versus the US Gulf as oil production is growing much faster than pipeline construction. This is likely to hold back oil flows to market.
Ch1: Weekly oil inventories declined by 18 m bl last week.
Now seems clear they peaked mid-March with decline here onwards
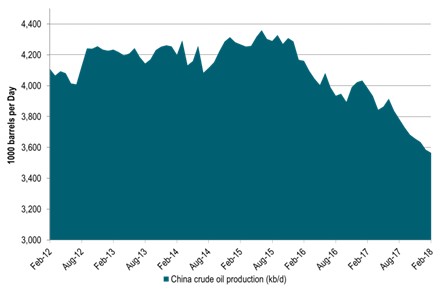
Ch2: Chinese crude production continued lower in February
Ch3: Crude production in Venezuela drops like a rock
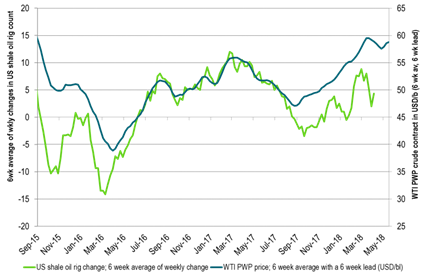
US oil rig count increased by 11 rigs last week to 808
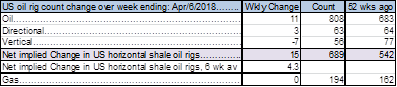
Ch4: US oil rig count keeps rising along with prices
Ch5: Permian price discount deepens as production hits pipe capacity
Kind regards
Bjarne Schieldrop
Chief analyst, Commodities
SEB Markets
Merchant Banking
Brent is climbing higher. Front-month is at USD 106.3/bl this morning, close to a weekly high and a USD 9/bl jump from Mondays open. This is the move we flagged as a risk earlier in the week: the market shifting from ”a deal is around the corner” to ”this is going to take longer than we thought”.

Analyst Commodities, SEB
During April, rest-of-year Brent remained remarkably stable around USD 90/bl. A stability which rested on one single assumption: the SoH reopens around 1 May. That assumption is now slowly falling apart.
As we highlighted yesterday: every week of delay beyond 1 May adds (theoretically) ish USD 5/bl to the rest-of-year average, as global inventories draw 100 million barrels per week. i.e., a mid-May reopening implies rest-of-year Brent closer to USD 100/bl, and anything pushing into June or July takes us meaningfully higher.
What’s changed in the last 48 hours:
#1: The US military has formally warned that clearing suspected sea mines from SoH could take up to six months. That is a completely different timescale from what the financial market is pricing. Even a political deal tomorrow does not immediately reopen the strait.
#2: Trump has shifted his tone from urgency to ”strategic patience”. In yesterday’s press conference: ”Don’t rush me… I want a great deal.” The market is reading this as a president no longer feeling pressured by timelines, with the naval blockade running in the background.
#3: So far, the military activity is escalating, not de-escalating. Axios reports Iran is laying more mines in SoH. The US 3rd carrier strike group (USS George H.W. Bush) is arriving with two countermine vessels. Trump yesterday ordered the US Navy to destroy any Iranian boats caught laying mines. While CNN reports that the Pentagon is actively drawing up plans to strike Iranian SoH capabilities and individual Iranian military leaders if the ceasefire collapses. i.e., NOT a attitude consistent with an imminent deal!
Spot crude and product prices eased off the early-April highs on a combination of system rerouting and deal optimism. Both now weakening. Goldman estimates April Gulf output is reduced by 14.5 mbl/d, or 57% of pre-war supply, a number that keeps getting worse the longer this drags on.
Demand-side adaptation is ongoing: S. Korea has cut its Middle East crude dependence from 69% to 56% by pulling more from the Americas and Africa, and Japan is kicking off a second round of SPR releases from 1 May. But SPRs are finite.
Ref. to the negotiations, we should not bet on speed. The current Iranian leadership is dominated by genuine hardliners willing to absorb economic pain and run the clock to extract concessions. That is not a setup for a rapid resolution. US/Israeli media briefings keep framing the delay as ”internal Iranian divisions”, the reality is more complicated and points toward weeks and months, not days.
Our point is that the complexity is large, and higher prices have only just started (given a scenario where the negotiations drag out in time). The market spent April leaning on the USD 90/bl rest-of-year assumption; that case is diminishing by the hour. If ”early May reopening” is replaced by ”June, July or later” over the next week or two, both crude and products have meaningful room to reprice higher from here. There is a high risk being short energy and betting on any immediate political resolution(!).
Down on Friday. Up on Monday. The Brent June crude oil contract traded down 5.1% last week to a close of $90.38/b. It reached a high of $103.87/b last Monday and a low of $86.09/b on Friday as Iran announced that the Strait of Hormuz was fully open for transit. That quickly changed over the weekend as the US upheld its blockade of Iranian oil exports while Iran naturally responded by closing the SoH again. The US blew a hole in the engine room of the Iranian ship TOUSKA and took custody of the ship on Sunday. Brent crude is up 5.6% this morning to $95.4/b.

The cease-fire is expiring tomorrow. The US has said it will send a delegation for a second round of negotiations in Islamabad in Pakistan. But Iran has for now rejected a second round of talks as it views US demands as unrealistic and excessive while the US is also blocking the Strait of Hormuz.
While Brent is up 5% this morning, the financial market is still very optimistic that progress will be made. That talks will continue and that the SoH will fully open by the start of May which is consistent with a rest-of-year average Brent crude oil price of around $90/b with the market now trading that balance at around $88/b.
Financial optimism vs. physical deterioration. We have a divergence where the financial market is trading negotiations, improvements and resolution while at the same time the physical market is deteriorating day by day. Physical oil flows remain constrained by disrupted flows, longer voyage times and elevated freight and insurance costs.
Financial markets are betting that a US/Iranian resolution will save us in time from violent shortages down the road. But every day that the SoH remains closed is bringing us closer to a potentially very painful point of shortages and much higher prices.
The US blockade is also a weapon of leverage against its European and Asian allies. When Iran closed the SoH it held the world economy as a hostage against the US. The US blockade of the SoH is of course blocking Iranian oil exports. But it is also an action of disruption directed towards Europe and Asia. The US has called for the rest of the world to engaged in the war with Iran: ”If you want oil from the Persian Gulf, then go and get it”. A risk is that the US plays brinkmanship with the global oil market directed towards its European and Asian allies and maybe even towards China to force them to engage and take part. Maybe unthinkable. But unthinkable has become the norm with Trump in the White House.
Wild moves yesterday. Brent crude traded to a high of $114.43/b and a low of $96.0/b and closed at $99.94/b yesterday.
US – Iran negotiations ongoing or not? What a day. Donald Trump announced that good talks were ongoing between Iran and the US and that the 48 hour deadline before bombing Iranian power plants and energy infrastructure was postponed by five days subject to success of ongoing meetings. Iranian media meanwhile stated that no meetings were ongoing at all.
Today we are scratching our heads trying to figure out what yesterday was all about.
Friends and family playing the market? Was it just Trump and his friends and family who were playing with oil and equity markets with $580m and $1.46bn in bets being placed by someone in oil and equity markets just 15 minutes before Trump’s announcement?
Was Trump pulling a TACO as he reached his political and economic pain point: Brent at $112/b, US Gas at $4/gal, SPX below 200dma and US 10yr above 4.4%?
Different Iranian factions with Trump talking with one of them? Are there real negotiations going on but with the US talking to one faction in Iran while another, the hardliners, are not involved and are denying any such negotiations going on?
Extending the ultimatum to attack and invade Kharg island next weekend? Or, is the five day delay of the deadline a tactical decision to allow US amphibious assault ships and marines to arrive in the Gulf in the upcoming weekend while US and Israeli continues to degrade Iranian military targets till then. And then next weekend a move by the US/Israel to attack and conquer for example the Kharg island?
We do not really know which it is or maybe a combination of these.
We did get some kind of TACO ydy. But markets have been waiting for some kind of TACO to happen and yesterday we got some kind of TACO. And Brent crude is now trading at $101.5/b as a result rather than at $112-114/b as it did no the high yesterday.
But what really matters in our view is the political situation on the ground in Iran. Will hardliners continue to hold power or will a more pragmatic faction gain power?
If the hardliners remain in power then oil pain should extend all the way to US midterm elections. The hardliners were apparently still in charge as of last week. Iran immediately retaliated and damaged LNG infrastructure in Qatar after Israel hit Iranian South Pars. The SoH was still closed and all messages coming out of Iran indicated defiance. Hardliners continues in power has a huge consequence for oil prices going forward. The regime has played its ’oil-weapon’ (closing or chocking the Strait of Hormuz). It is using it to achieve political goals. Deterrence: it needs to be so politically and economically expensive to attack Iran that it won’t happen again in the future. Or at least that the US/Israel thinks 10-times over before they attack again. The highest Brent crude oil closing price since the start of the war is $112.19/b last Friday. In comparison the 20-year inflation adjusted Brent price is $103/b. So Brent crude last Friday at $112.19/b isn’t a shockingly high price. And it is still far below the nominal high of $148/b from 2008 which is $220/b if inflation adjusted. So once in a lifetime Iran activates its most powerful weapon. The oil weapon. It needs to show the power of this weapon and it needs to reap political gains. Getting Brent to $112/b and intraday high of $119.5/b (9 March) isn’t a display of the power of that weapon. And it is not a deterrence against future attacks.
So if the hardliners remain in power in Iran, then the SoH will likely remain chocked all the way to US midterm elections and Brent crude will at a minimum go above the historical nominal high of $148/b from 2008.
Thus the outlook for the oil price for the rest of the year doesn’t depend all that much of whether Trump pulls a TACO or not. Stops bombing or not. It depends more on who is in charge in Iran. If it is the hardliners, then deterrence against future attacks via chocking of the SoH and high oil prices is the likely line of action. It is impacting the world but the Iranian ’oil-weapon’ is directed towards the US president and the the US midterm elections.
If a pragmatic faction gets to power in Iran, then a very prosperous future is possible. However, if power is shifting towards a more pragmatic faction in Iran then a completely different direction could evolve. Such a faction could possibly be open for cooperation with the US and the GCC and possibly put its issues versus Israel aside. Then the prosperity we have seen evolving in Dubai could be a possible future also for Iran.
So far it looks like the hardliners are fully in charge. As far as we can see, the hardliners are still fully in control in Iran. That points towards continued chocking of the SoH and oil prices ticking higher as global inventories (the oil market buffers) are drawn lower. And not just for a few more weeks, but possibly all the way to the US midterm elections.


Solkraften pressar elpriserna dagtid

Michel Gubel ger sin syn på oljemarknaden

Svag vårflod dubblar elpriserna
Brent crude up USD 9/bl on the week… ”deal around the corner” narrative fades
Market Still Betting on Timely Resolution, But Each Day Raises Shortage Risk

Det fysiska spotpriset på brentolja har slagit nytt rekord

Marknaden måste börja betrakta de höga kopparpriserna som det nya normala

Christian Kopfer om läget för oljan
Market Still Betting on Timely Resolution, But Each Day Raises Shortage Risk
Brent crude up USD 9/bl on the week… ”deal around the corner” narrative fades
-
 Nyheter4 veckor sedan
Det fysiska spotpriset på brentolja har slagit nytt rekord
-
 Nyheter4 veckor sedan
Marknaden måste börja betrakta de höga kopparpriserna som det nya normala
-
 Nyheter3 veckor sedan
Christian Kopfer om läget för oljan
-
Analys2 veckor sedan
Market Still Betting on Timely Resolution, But Each Day Raises Shortage Risk
-
Analys1 vecka sedan
Brent crude up USD 9/bl on the week… ”deal around the corner” narrative fades
-
 Nyheter5 dagar sedan
Michel Gubel ger sin syn på oljemarknaden
-
Nyheter5 dagar sedan
Svag vårflod dubblar elpriserna
-
 Nyheter3 dagar sedan
Solkraften pressar elpriserna dagtid