

Analys
Market likely to rewrite all Brent crude forecasts for 2018

 Exactly two weeks ago we argued that Brent crude would probably reach $65/b before Christmas. And wow has that delivered quicker than we thought. Of course yesterday’s 3.5% jump to $54.27/b (intraday high of $54.44/b) did come on the back of the political events in Saudi Arabia. Princes, billionaires and ministers were arrested and accused of corruption while the real reason of course was to secure the way to the throne for Prince Mohammed Bin Salman (MBS). In our view the events in Saudi Arabia this weekend were merely a catalyst which drove the oil price higher and more quickly than expected. In general we see little reason to be concerned for the supply of Saudi Arabia’s production. That was probably also the main view by European traders yesterday as Brent crude traded only marginally up in the European season (aligned with some positive moves in metals) before US traders came into the market and kicked it higher.
What is really at the heart of why we think everyone now will revise their Brent crude forecasts for 2018 is the realisation that the Brent crude 1 month contract, the Brent “spot price”, is not really what the US shale oil players are getting for their crude oil. Whatever unhedged oil the US shale oil players currently are producing they will only get $57.3/b or the WTI 1 month price. And they won’t even get that as there is a transportation cost from the well-head to Cushing Oklahoma as a discount to that as well.
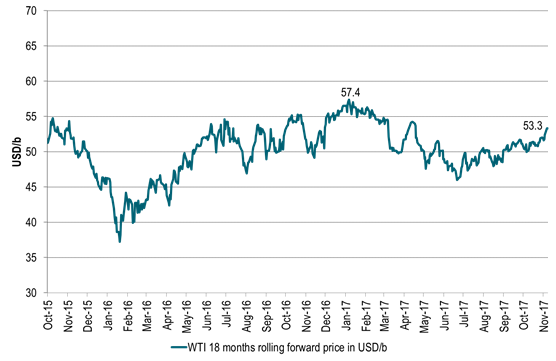
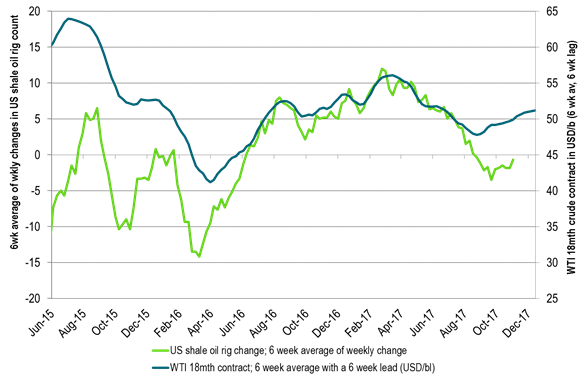
More importantly is what’s dictating shale oil players’ profitability for new investments, new drilling and additional wells. That is not the front month WTI price but the 1.5 year forward WTI price (the WTI 18 month contract) at which they can hedge new investments. And that price yesterday closed at only $53.3/bl. I.e. for new investments US shale oil players are only offered $53.3/bl for delivery at Cushing Oklahoma which is far away from the current Brent 1mth price of $64/b.
The WTI 18 mth contract traded as high as $57.4/b earlier in the year. So while the Brent 1mth price is rising to new highs of the year and highest since 2015, the WTI 18mth contract is still 3 dollar lower than its high this year and not at all giving a strong stimulating investment push for shale oil producers.
This is clearly a dream come true for OPEC. That they can have a high Brent 1mth price close to $65/b while at the same time not giving a strong price stimulus to US shale oil producers as they are only offered $53.3/bl on the curve. Yes, Christmas did indeed come early for OPEC this year! Then of course the question is whether Christmas will last all of 2018 or not. So what is at the heart of this Christmas present?
It is two-fold.
One is the increasing Brent crude oil backwardation with the Brent 1mth contract trading at a $5.1/bl premium to the the Brent 18mth contract. This comes partly as a result of the constant draw down in global crude oil inventories and partly due to the increasing net long Brent speculative positioning. And yes there is a relationship between backwardation and speculative length. When net length is increasing the backwardation is increasing.
At the moment net long Brent is at an all-time high. That will of course not last for ever. So in the next market turn when specs pull out the level of backwardation will soften somewhat as well. However, assume that OPEC+ will “hold” the market all through 2018 so that inventories continue yet lower. Not necessarily steeply lower but at least ticking lower. Then the Brent crude oil backwardation should not fall back to zero. Rather it should hold up at some level and then strengthen with declining stocks. In perspective the Brent 1 to 18 mth backwardation time spread traded around $7/b from mid-2011 to mid-2014 when Brent crude traded around $110/b. So the $5/b backwardation may be a bit rich as we are not quite back to a 2011-2014 situation quite yet.
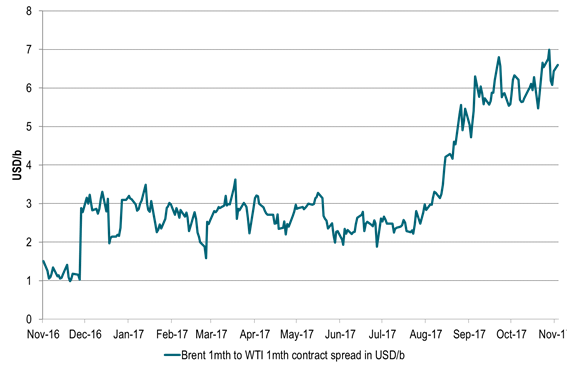
The second and more important one is the increasing Brent to WTI spread we have witnessed this year. And it is not just in the front of the curves where the spread has widened out. It has happened all along the curve. In January the Brent 18mth to WTI 18 mth spread only traded at $1/b while it now trades at close to $6/bl.
When we look at global oil inventories they have been drawing down relentlessly since mid-March this year. In the US we have seen that oil product stocks have drawn down to normal with middle distillate stocks there down to below now ahead of winter. US crude stocks have however been a much more tedious and slow draw down as they in total still stand more than 100 mbl above a fair normal. However, if we split out the US mid-Continent which contains Cushing Oklahoma stocks where the WTI crude is priced we see that non-mid-Continent US crude stocks have been drawn down rapidly. The mid-Continent stocks however are actually now higher than a year ago and rising. And since this is where the WTI crude is priced it is holding down the WTI price.
The WTI crude curve is actually still in contango at the front end of the curve due to this. And since stocks in the mid-Continent are rising higher there is an increasing risk that the WTI crude price might break down into deeper front end contango and an even wider Brent to WTI spread and thus a lower WTI 1mth price.
We are thus likely going to witness a yet widening divergence between Brent and WTI crude oil price. Especially in the front. That is also why the net long speculative positions in WTI is not at an all-time-high as is the case with Brent positions. And those with a long position in WTI are at risk for a break-down in the WTI prices as the mid-Continent stocks continues to rise.
A key question for us at the moment (which we are unable to answer) is whether the rising crude stocks in the US mid-Continent now is due to natural bottlenecks due to lack of pipeline investments or whether it is due to damaged infrastructure following the Hurricane Harvey.
If it is the first then the bottleneck is probably of a lasting character. Then US shale producers have probably reached the short/medium term transportation capacity of getting their oil to the market. It will of course not last for ever as there is always possible to lay more pipes, but it takes time. In that case the Brent crude oil price can continue to rally without having to worry too much because the WTI price which then is stuck in surplus in the mid-US Continent. Then there is no point for US shale oil producers to increase production as they cannot easily get it to market. And the subdued WTI price will be the one telling them not to invest more and not to produce more since it will be low due to high mid-Continent stocks.
If the rising mid-Continental stocks are due to Hurricane Harvey damages then it might be quicker to mend. Then the Brent to WTI spread should contract from current levels once the Harvey damage is mended.
Looking at the US mid-Continent stocks we see that they started to rise at the end of August which was right at the time of Hurricane Harvey and has gone up by some 10 mbl since then. However, this might not be a good indication that Harvey is the culprit as inventories normally rise some 4 mbl during this period anyhow.
We are not quite sure whether it is Hurricane Harvey damage which drives US mid-Continental stocks higher or whether it is structural under investments in pipelines. However, as US shale oil production continues to rise (as we think it will in 2018) the pressure in terms of utilization of US oil pipeline transportation capacities will be increasingly taxed which is likely to hold the Brent – WTI price spread high.
So Brent crude oil price forecasts for 2018 are likely going to be revised up across the board as they now are likely to incorporate a more substantial Brent – WTI 1mth price spread for 2018. Current Brent crude 2018 Bloomberg consensus forecast currently stand at $56/bl with market pricing at $62/bl while SEB’s standing forecast from September is $55/bl.
The fundamental assumption for most forecasting methodologies is still that US shale oil is on the margin. For a long time the assumption has been that US shale oil can deliver almost unlimited at WTI $50/b. That assumption is now breaking down. US shale oil producers have not made money this year with investors now DEMANDING that they deliver profits and not just promises. While it is difficult to say exactly at what level they will create profits it is natural to shift the shale oil base floor price assumption from $50/bl to $55/bl. I.e. assuming that US shale oil production is not going through the roof with a WTI 18 mth price at $55/b. I.e. the WTI price is allowed to trade at $55/bl both in spot and on the curve without creating surplus havoc in the global market.
We thus expect revisions of Brent crude oil forecasts to assume a WTI 1mth crude price delivered at around $55/bl next year and then with a Brent 1mth to WTI 1mth price spread to Brent on top of some $5-7/bl thus placing Brent forecasts for 2018 at around $60-62/bl. Such assumptions are likely to affect our own Brent crude oil forecast for 2018 when we revise it in February next year.
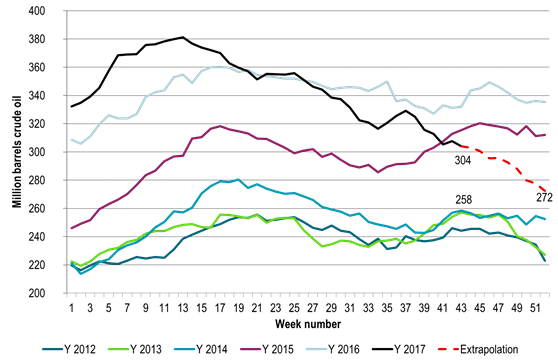
Ch1) US commercial crude oil stocks less the US mid-continent are drawing down rapidly
Getting close to normal by end of year
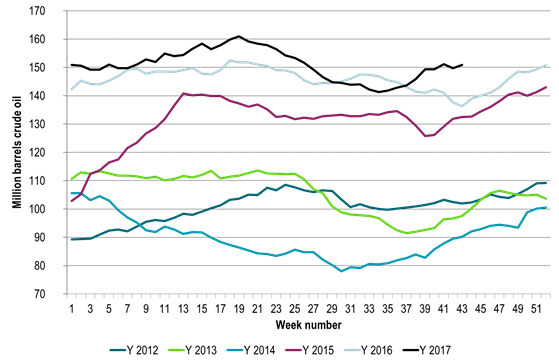
Ch2) US mid-Continent stocks (Pad2) have however rising and above last year.
This is where WTI crude is priced in Cushing Oklahoma and is why the WTI crude curve has front end contango with risk for deeper contango
Ch3) US shale oil regions
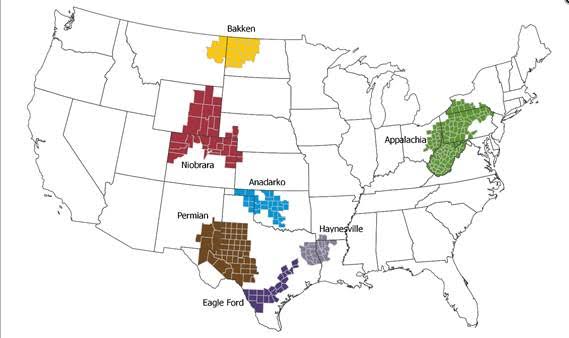
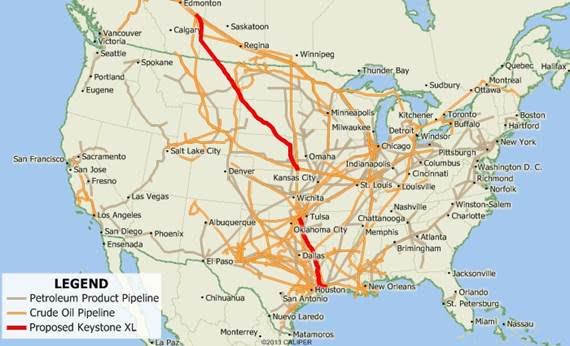
Ch4) Not all shale oil producers need to pass through Cushing Oklahoma
But the exact magnitude and location of bottlenecks getting shale oil to the U.S. Gulf we don’t know.
Looks like Eagle Ford and Permian have more options to bypass Cushing getting right to the US Gulf.
Are Eagle Ford and Permian producers actually getting a price closer to seaborne crude prices than to WTI?
Ch5) Brent and WTI crude curves moving higher over last two weeks
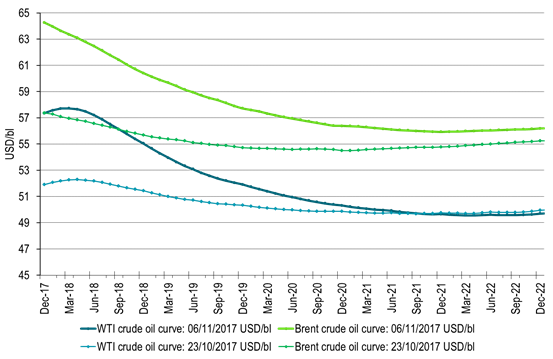
Ch6) Brent 1mth contract has rallied to close to $65/b.
Steepening Brent backwardation and widening Brent – WTI crude spreads has left the WTI 18 mth contract in the doldrums no higher than $53.3/b
Ch7) The WTI 18 mth forward price at $53.3/b still short of year high of $57.4/b
Ch8) Brent 1mth to WTI 1mth crude spread has blown out
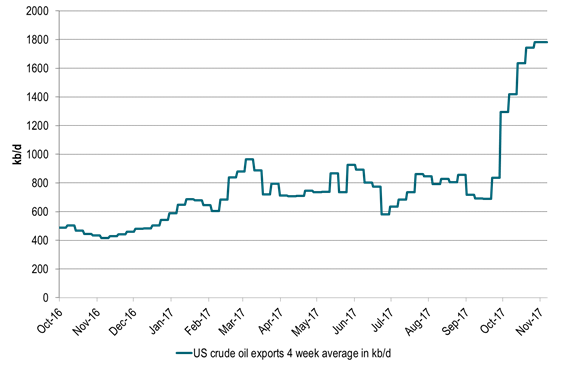
Ch9) And US crude oil is flushing out of the US as exports as a result of the strong widening in Brent to WTI
But as we see above it is not flowing out of the US mid-Continent where WTI is priced
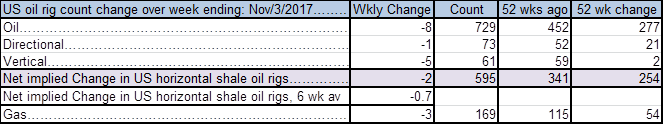
Ch10) US shale oil players are kicking drilling rigs out of the US at a WTI 18mth curve price of $50/bl
They can of course drill more but then they are begging a higher forward WTI price.
Risk for a smoke and mirror in these statistics as shale players are currently running some 100 drilling rigs more than they need.
They need to kick they out in order to align drilling with completions which still ran at a surplus in September as they drilled more than they completed.
We expect shale players to kick out 5-10 rigs every week to Christmas.
It will be sentiment bullish, but unlikely to impact completions all that much in 2018 as they have a load full of DUCs they can complete in 2018
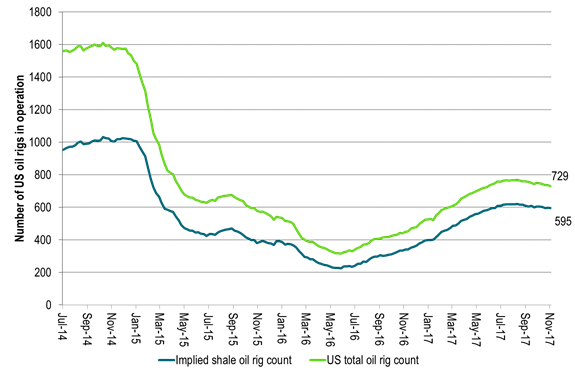
Ch11) US shale players kicking out rigs at a WTI18 curve price of $50/bl
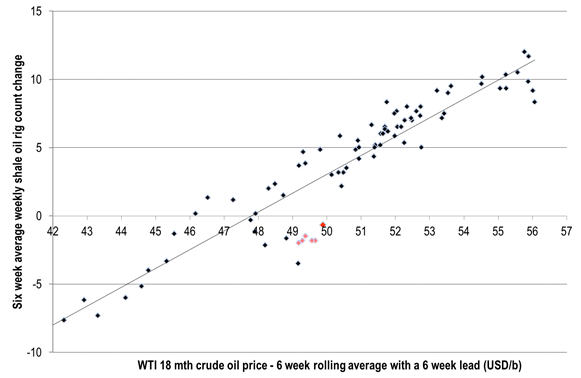
Ch12) Will shale players hold their horses as the mid-term WTI forward price moves higher?
Good reasons to believe that they will kick out more drilling rigs at WTI curve $50/b as investors demand profits
Kind regards
Bjarne Schieldrop
Chief analyst, Commodities
SEB Markets
Merchant Banking
Market is starting to take US/Iran headlines with a pinch of salt. Brent crude rose $2.8/b yesterday to an official close of $112.1/b. But after that it traded as low as $108.05/b before ending late night at around $109.7/b. Through the day it traded in a range of $106.87 – 112.72/b amid a flurry of news or rumors from Iran and the US. ”US temporary sanctions during negotiations” (falls alarm). ”We will bomb Iran” (not anyhow),… etc. While the market is still fluctuating to this kind of news flow, it is starting to take such headlines with a pinch of salt.

We’ll see. Maybe, maybe not. The Brent M1 contract is trading at $110.2/b this morning which very close to the average ticks through yesterday of $110.4/b.
Trump with bearish, verbal intervention whenever Brent trades above $110/b it seems. What seems to be a pattern is that Trump states something like ”very good negotiations going on with Iran”, ”New leaders in Iran are great,..”, ”Great progress in negotiations,…”, ”Deal in sight,..” etc whenever the Brent M1 contract trades above $110/b. An effort to cool the market. These hot air verbal interventions from Trump used to have a heavy bearish impact on prices, but they now seems to have less and less effect unless they are backed by reality.
As far as we can see there has been no real progress in the negotiations between the US and Iran with both sides still standing by their previous demands.
Iran is getting stronger while the cease fire lasts making a return to war for Trump yet harder. Iran is naturally in constant preparation for a return to war given Trump’s steady threats of bombing Iran again. Iran is naturally doing what ever is possible to prepare for a return to war. And every day the cease fire lasts it is better prepared. This naturally makes it more and more difficult and dangerous for the US to return to warring activity versus Iran as the consequences for energy infrastructure in the Persian Gulf will be more and more severe the longer the cease fire lasts. Israel seems to see it this way as well. That the war is not won and that current frozen state of a cease fire gives Iran opportunity to rebuild military and politically.
Global inventories are drawing down day by day. How much? In the meantime the Strait of Hormuz stays closed. There is varying measures and estimates of how much global inventories are drawing down. Our rough estimate, back of the envelope, is that global inventories are drawing down by at least some 10 mb/d or about 300 mb/d in a balance between loss of supply versus demand destruction. Other estimates we see are a monthly draw of 250-270 mb/d. The IEA only ’measured’ a draw in global observable stocks of 117 mb in April with oil on water rising 53 mb while on shore stocks fell 170 mb. But global stocks are hard to measure with large invisible, unmeasured stocks. As such a back of the envelope approach may be better.
Oil products is what the world is consuming. Oil product prices likely to rise while product stocks fall. Strategic Petroleum Reserves (SPR) are predominantly crude oil. Discharging oil from OECD SPR stocks, a sharp reduction in Chinese crude imports and a reduction in global refinery throughput of 6-7 mb/d has helped to keep crude oil markets satisfactorily supplied. But global inventories are drawing down none the less. And oil products is really what the world is consuming. So if global refinery throughput stays subdued, then demand will eventually have to match the supply of oil products. The likely path forward this summer is a steady draw down in jet fuel, diesel and gasoline. Higher prices for these. Then, if possible, higher refinery throughput and higher usage of crude in response to very profitable refinery margins. And lastly sharper draw in crude stocks and higher prices for these. But some 6 mb/d of oil products used to be exported through the Strait of Hormuz. And it may not be so easy to ramp up refinery activity across the world to compensate. Especially as Ukraine continues to damage Russian refineries as well as Russian crude production and export facilities.
Watch oil product stocks and prices as well as Brent calendar 2027. What to watch for this summer is thus oil product inventories falling and oil product premiums to crude rising. Another measure to watch is the Brent crude 2027 contract as it rises steadily day by day as the Strait of Hormuz stays closed and global oil inventories decline. The latter is close to the highest level since the start of the war and keeps rising.
The Brent M1 contract and the Brent 2027 prices and current price of jet fuel in Europe (ARA). All in USD/b

Our back of the envelope calculation of the global shortage created by the closure of the Strait of Hormuz. Note that 3.5 mb/d of discharge from SPR is also a draw. Note also that ’Forced demand loss’ of 2.5 mb/d is probably temporary and will fall back towards zero as logistics are sorted out leaving ’Price demand loss’ to do the job of balancing the market. Thus a shortfall of at least 9 mb/d created by the closure. More if SPR discharge is included and more if Forced demand loss recedes.

Brent is climbing higher. Front-month is at USD 106.3/bl this morning, close to a weekly high and a USD 9/bl jump from Mondays open. This is the move we flagged as a risk earlier in the week: the market shifting from ”a deal is around the corner” to ”this is going to take longer than we thought”.

Analyst Commodities, SEB
During April, rest-of-year Brent remained remarkably stable around USD 90/bl. A stability which rested on one single assumption: the SoH reopens around 1 May. That assumption is now slowly falling apart.
As we highlighted yesterday: every week of delay beyond 1 May adds (theoretically) ish USD 5/bl to the rest-of-year average, as global inventories draw 100 million barrels per week. i.e., a mid-May reopening implies rest-of-year Brent closer to USD 100/bl, and anything pushing into June or July takes us meaningfully higher.
What’s changed in the last 48 hours:
#1: The US military has formally warned that clearing suspected sea mines from SoH could take up to six months. That is a completely different timescale from what the financial market is pricing. Even a political deal tomorrow does not immediately reopen the strait.
#2: Trump has shifted his tone from urgency to ”strategic patience”. In yesterday’s press conference: ”Don’t rush me… I want a great deal.” The market is reading this as a president no longer feeling pressured by timelines, with the naval blockade running in the background.
#3: So far, the military activity is escalating, not de-escalating. Axios reports Iran is laying more mines in SoH. The US 3rd carrier strike group (USS George H.W. Bush) is arriving with two countermine vessels. Trump yesterday ordered the US Navy to destroy any Iranian boats caught laying mines. While CNN reports that the Pentagon is actively drawing up plans to strike Iranian SoH capabilities and individual Iranian military leaders if the ceasefire collapses. i.e., NOT a attitude consistent with an imminent deal!
Spot crude and product prices eased off the early-April highs on a combination of system rerouting and deal optimism. Both now weakening. Goldman estimates April Gulf output is reduced by 14.5 mbl/d, or 57% of pre-war supply, a number that keeps getting worse the longer this drags on.
Demand-side adaptation is ongoing: S. Korea has cut its Middle East crude dependence from 69% to 56% by pulling more from the Americas and Africa, and Japan is kicking off a second round of SPR releases from 1 May. But SPRs are finite.
Ref. to the negotiations, we should not bet on speed. The current Iranian leadership is dominated by genuine hardliners willing to absorb economic pain and run the clock to extract concessions. That is not a setup for a rapid resolution. US/Israeli media briefings keep framing the delay as ”internal Iranian divisions”, the reality is more complicated and points toward weeks and months, not days.
Our point is that the complexity is large, and higher prices have only just started (given a scenario where the negotiations drag out in time). The market spent April leaning on the USD 90/bl rest-of-year assumption; that case is diminishing by the hour. If ”early May reopening” is replaced by ”June, July or later” over the next week or two, both crude and products have meaningful room to reprice higher from here. There is a high risk being short energy and betting on any immediate political resolution(!).
Down on Friday. Up on Monday. The Brent June crude oil contract traded down 5.1% last week to a close of $90.38/b. It reached a high of $103.87/b last Monday and a low of $86.09/b on Friday as Iran announced that the Strait of Hormuz was fully open for transit. That quickly changed over the weekend as the US upheld its blockade of Iranian oil exports while Iran naturally responded by closing the SoH again. The US blew a hole in the engine room of the Iranian ship TOUSKA and took custody of the ship on Sunday. Brent crude is up 5.6% this morning to $95.4/b.
The cease-fire is expiring tomorrow. The US has said it will send a delegation for a second round of negotiations in Islamabad in Pakistan. But Iran has for now rejected a second round of talks as it views US demands as unrealistic and excessive while the US is also blocking the Strait of Hormuz.
While Brent is up 5% this morning, the financial market is still very optimistic that progress will be made. That talks will continue and that the SoH will fully open by the start of May which is consistent with a rest-of-year average Brent crude oil price of around $90/b with the market now trading that balance at around $88/b.
Financial optimism vs. physical deterioration. We have a divergence where the financial market is trading negotiations, improvements and resolution while at the same time the physical market is deteriorating day by day. Physical oil flows remain constrained by disrupted flows, longer voyage times and elevated freight and insurance costs.
Financial markets are betting that a US/Iranian resolution will save us in time from violent shortages down the road. But every day that the SoH remains closed is bringing us closer to a potentially very painful point of shortages and much higher prices.
The US blockade is also a weapon of leverage against its European and Asian allies. When Iran closed the SoH it held the world economy as a hostage against the US. The US blockade of the SoH is of course blocking Iranian oil exports. But it is also an action of disruption directed towards Europe and Asia. The US has called for the rest of the world to engaged in the war with Iran: ”If you want oil from the Persian Gulf, then go and get it”. A risk is that the US plays brinkmanship with the global oil market directed towards its European and Asian allies and maybe even towards China to force them to engage and take part. Maybe unthinkable. But unthinkable has become the norm with Trump in the White House.


Sommarväder skapar prisrally på elbörsen
Oil product price pain is set to rise as the Strait of Hormuz stays closed into summer

Solkraften pressar elpriserna dagtid

Michel Gubel ger sin syn på oljemarknaden