Analys
Market likely to rewrite all Brent crude forecasts for 2018


What is really at the heart of why we think everyone now will revise their Brent crude forecasts for 2018 is the realisation that the Brent crude 1 month contract, the Brent “spot price”, is not really what the US shale oil players are getting for their crude oil. Whatever unhedged oil the US shale oil players currently are producing they will only get $57.3/b or the WTI 1 month price. And they won’t even get that as there is a transportation cost from the well-head to Cushing Oklahoma as a discount to that as well.
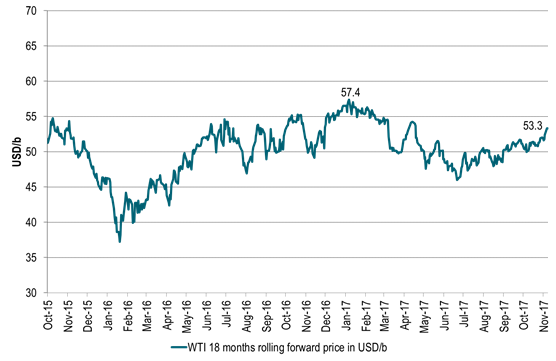
More importantly is what’s dictating shale oil players’ profitability for new investments, new drilling and additional wells. That is not the front month WTI price but the 1.5 year forward WTI price (the WTI 18 month contract) at which they can hedge new investments. And that price yesterday closed at only $53.3/bl. I.e. for new investments US shale oil players are only offered $53.3/bl for delivery at Cushing Oklahoma which is far away from the current Brent 1mth price of $64/b.
The WTI 18 mth contract traded as high as $57.4/b earlier in the year. So while the Brent 1mth price is rising to new highs of the year and highest since 2015, the WTI 18mth contract is still 3 dollar lower than its high this year and not at all giving a strong stimulating investment push for shale oil producers.
This is clearly a dream come true for OPEC. That they can have a high Brent 1mth price close to $65/b while at the same time not giving a strong price stimulus to US shale oil producers as they are only offered $53.3/bl on the curve. Yes, Christmas did indeed come early for OPEC this year! Then of course the question is whether Christmas will last all of 2018 or not. So what is at the heart of this Christmas present?
It is two-fold.
One is the increasing Brent crude oil backwardation with the Brent 1mth contract trading at a $5.1/bl premium to the the Brent 18mth contract. This comes partly as a result of the constant draw down in global crude oil inventories and partly due to the increasing net long Brent speculative positioning. And yes there is a relationship between backwardation and speculative length. When net length is increasing the backwardation is increasing.
At the moment net long Brent is at an all-time high. That will of course not last for ever. So in the next market turn when specs pull out the level of backwardation will soften somewhat as well. However, assume that OPEC+ will “hold” the market all through 2018 so that inventories continue yet lower. Not necessarily steeply lower but at least ticking lower. Then the Brent crude oil backwardation should not fall back to zero. Rather it should hold up at some level and then strengthen with declining stocks. In perspective the Brent 1 to 18 mth backwardation time spread traded around $7/b from mid-2011 to mid-2014 when Brent crude traded around $110/b. So the $5/b backwardation may be a bit rich as we are not quite back to a 2011-2014 situation quite yet.
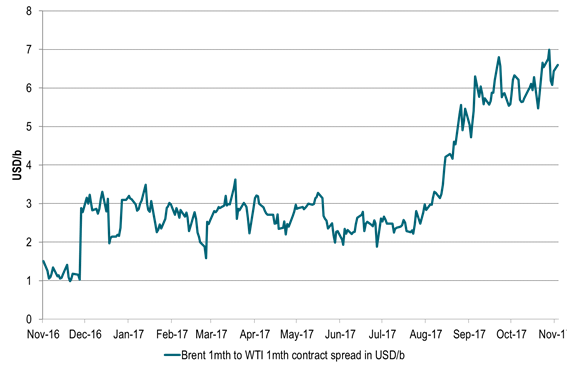
The second and more important one is the increasing Brent to WTI spread we have witnessed this year. And it is not just in the front of the curves where the spread has widened out. It has happened all along the curve. In January the Brent 18mth to WTI 18 mth spread only traded at $1/b while it now trades at close to $6/bl.
When we look at global oil inventories they have been drawing down relentlessly since mid-March this year. In the US we have seen that oil product stocks have drawn down to normal with middle distillate stocks there down to below now ahead of winter. US crude stocks have however been a much more tedious and slow draw down as they in total still stand more than 100 mbl above a fair normal. However, if we split out the US mid-Continent which contains Cushing Oklahoma stocks where the WTI crude is priced we see that non-mid-Continent US crude stocks have been drawn down rapidly. The mid-Continent stocks however are actually now higher than a year ago and rising. And since this is where the WTI crude is priced it is holding down the WTI price.
The WTI crude curve is actually still in contango at the front end of the curve due to this. And since stocks in the mid-Continent are rising higher there is an increasing risk that the WTI crude price might break down into deeper front end contango and an even wider Brent to WTI spread and thus a lower WTI 1mth price.
We are thus likely going to witness a yet widening divergence between Brent and WTI crude oil price. Especially in the front. That is also why the net long speculative positions in WTI is not at an all-time-high as is the case with Brent positions. And those with a long position in WTI are at risk for a break-down in the WTI prices as the mid-Continent stocks continues to rise.
A key question for us at the moment (which we are unable to answer) is whether the rising crude stocks in the US mid-Continent now is due to natural bottlenecks due to lack of pipeline investments or whether it is due to damaged infrastructure following the Hurricane Harvey.
If it is the first then the bottleneck is probably of a lasting character. Then US shale producers have probably reached the short/medium term transportation capacity of getting their oil to the market. It will of course not last for ever as there is always possible to lay more pipes, but it takes time. In that case the Brent crude oil price can continue to rally without having to worry too much because the WTI price which then is stuck in surplus in the mid-US Continent. Then there is no point for US shale oil producers to increase production as they cannot easily get it to market. And the subdued WTI price will be the one telling them not to invest more and not to produce more since it will be low due to high mid-Continent stocks.
If the rising mid-Continental stocks are due to Hurricane Harvey damages then it might be quicker to mend. Then the Brent to WTI spread should contract from current levels once the Harvey damage is mended.
Looking at the US mid-Continent stocks we see that they started to rise at the end of August which was right at the time of Hurricane Harvey and has gone up by some 10 mbl since then. However, this might not be a good indication that Harvey is the culprit as inventories normally rise some 4 mbl during this period anyhow.
We are not quite sure whether it is Hurricane Harvey damage which drives US mid-Continental stocks higher or whether it is structural under investments in pipelines. However, as US shale oil production continues to rise (as we think it will in 2018) the pressure in terms of utilization of US oil pipeline transportation capacities will be increasingly taxed which is likely to hold the Brent – WTI price spread high.
So Brent crude oil price forecasts for 2018 are likely going to be revised up across the board as they now are likely to incorporate a more substantial Brent – WTI 1mth price spread for 2018. Current Brent crude 2018 Bloomberg consensus forecast currently stand at $56/bl with market pricing at $62/bl while SEB’s standing forecast from September is $55/bl.
The fundamental assumption for most forecasting methodologies is still that US shale oil is on the margin. For a long time the assumption has been that US shale oil can deliver almost unlimited at WTI $50/b. That assumption is now breaking down. US shale oil producers have not made money this year with investors now DEMANDING that they deliver profits and not just promises. While it is difficult to say exactly at what level they will create profits it is natural to shift the shale oil base floor price assumption from $50/bl to $55/bl. I.e. assuming that US shale oil production is not going through the roof with a WTI 18 mth price at $55/b. I.e. the WTI price is allowed to trade at $55/bl both in spot and on the curve without creating surplus havoc in the global market.
We thus expect revisions of Brent crude oil forecasts to assume a WTI 1mth crude price delivered at around $55/bl next year and then with a Brent 1mth to WTI 1mth price spread to Brent on top of some $5-7/bl thus placing Brent forecasts for 2018 at around $60-62/bl. Such assumptions are likely to affect our own Brent crude oil forecast for 2018 when we revise it in February next year.
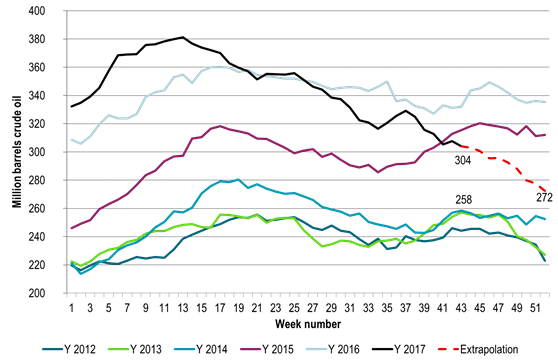
Ch1) US commercial crude oil stocks less the US mid-continent are drawing down rapidly
Getting close to normal by end of year

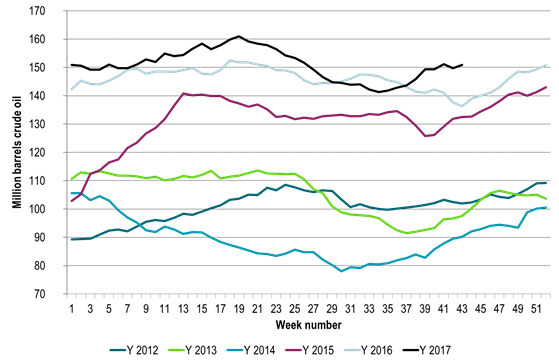
Ch2) US mid-Continent stocks (Pad2) have however rising and above last year.
This is where WTI crude is priced in Cushing Oklahoma and is why the WTI crude curve has front end contango with risk for deeper contango

Ch3) US shale oil regions
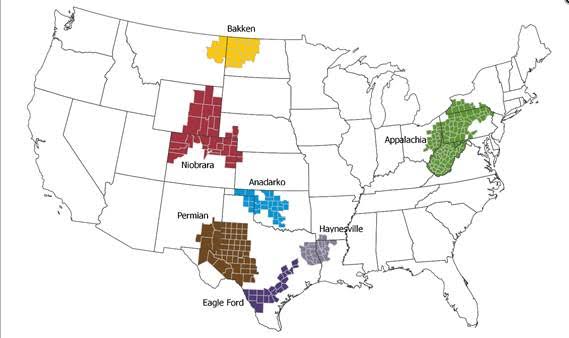

Ch4) Not all shale oil producers need to pass through Cushing Oklahoma
But the exact magnitude and location of bottlenecks getting shale oil to the U.S. Gulf we don’t know.
Looks like Eagle Ford and Permian have more options to bypass Cushing getting right to the US Gulf.
Are Eagle Ford and Permian producers actually getting a price closer to seaborne crude prices than to WTI?

Ch5) Brent and WTI crude curves moving higher over last two weeks
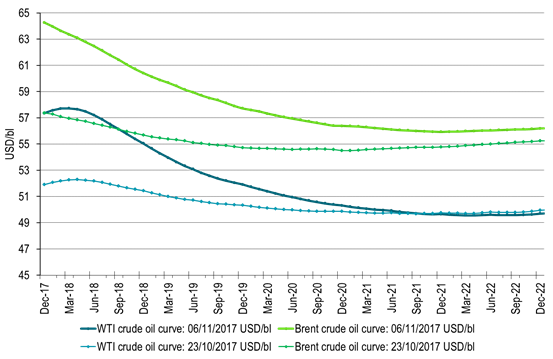

Ch6) Brent 1mth contract has rallied to close to $65/b.
Steepening Brent backwardation and widening Brent – WTI crude spreads has left the WTI 18 mth contract in the doldrums no higher than $53.3/b

Ch7) The WTI 18 mth forward price at $53.3/b still short of year high of $57.4/b

Ch8) Brent 1mth to WTI 1mth crude spread has blown out

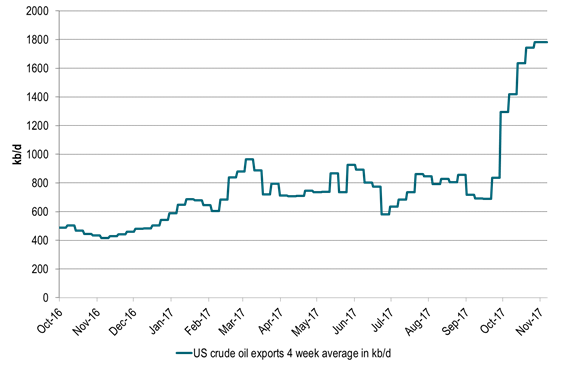
Ch9) And US crude oil is flushing out of the US as exports as a result of the strong widening in Brent to WTI
But as we see above it is not flowing out of the US mid-Continent where WTI is priced

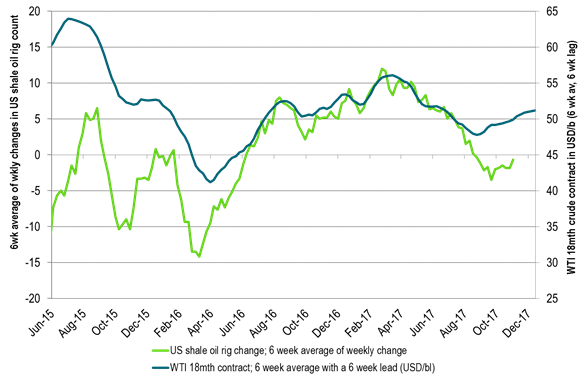
Ch10) US shale oil players are kicking drilling rigs out of the US at a WTI 18mth curve price of $50/bl
They can of course drill more but then they are begging a higher forward WTI price.
Risk for a smoke and mirror in these statistics as shale players are currently running some 100 drilling rigs more than they need.
They need to kick they out in order to align drilling with completions which still ran at a surplus in September as they drilled more than they completed.
We expect shale players to kick out 5-10 rigs every week to Christmas.
It will be sentiment bullish, but unlikely to impact completions all that much in 2018 as they have a load full of DUCs they can complete in 2018
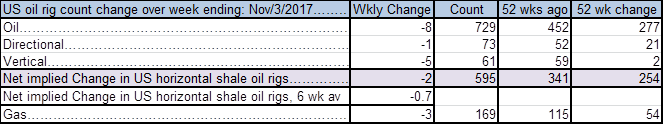


Ch11) US shale players kicking out rigs at a WTI18 curve price of $50/bl

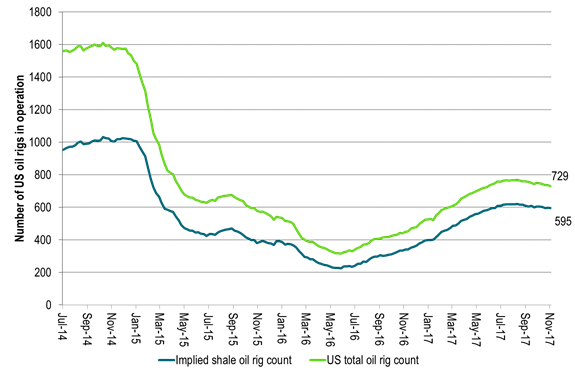
Ch12) Will shale players hold their horses as the mid-term WTI forward price moves higher?
Good reasons to believe that they will kick out more drilling rigs at WTI curve $50/b as investors demand profits

Kind regards
Bjarne Schieldrop
Chief analyst, Commodities
SEB Markets
Merchant Banking