

Analys
Market likely to rewrite all Brent crude forecasts for 2018

 Exactly two weeks ago we argued that Brent crude would probably reach $65/b before Christmas. And wow has that delivered quicker than we thought. Of course yesterday’s 3.5% jump to $54.27/b (intraday high of $54.44/b) did come on the back of the political events in Saudi Arabia. Princes, billionaires and ministers were arrested and accused of corruption while the real reason of course was to secure the way to the throne for Prince Mohammed Bin Salman (MBS). In our view the events in Saudi Arabia this weekend were merely a catalyst which drove the oil price higher and more quickly than expected. In general we see little reason to be concerned for the supply of Saudi Arabia’s production. That was probably also the main view by European traders yesterday as Brent crude traded only marginally up in the European season (aligned with some positive moves in metals) before US traders came into the market and kicked it higher.
What is really at the heart of why we think everyone now will revise their Brent crude forecasts for 2018 is the realisation that the Brent crude 1 month contract, the Brent “spot price”, is not really what the US shale oil players are getting for their crude oil. Whatever unhedged oil the US shale oil players currently are producing they will only get $57.3/b or the WTI 1 month price. And they won’t even get that as there is a transportation cost from the well-head to Cushing Oklahoma as a discount to that as well.
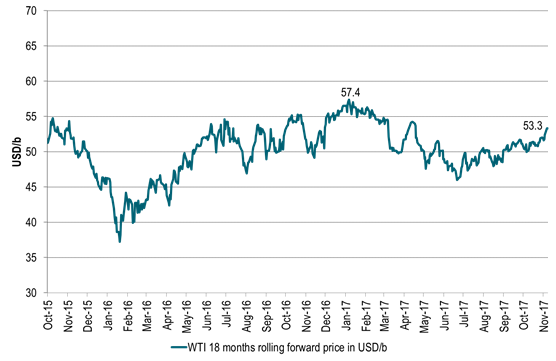
More importantly is what’s dictating shale oil players’ profitability for new investments, new drilling and additional wells. That is not the front month WTI price but the 1.5 year forward WTI price (the WTI 18 month contract) at which they can hedge new investments. And that price yesterday closed at only $53.3/bl. I.e. for new investments US shale oil players are only offered $53.3/bl for delivery at Cushing Oklahoma which is far away from the current Brent 1mth price of $64/b.
The WTI 18 mth contract traded as high as $57.4/b earlier in the year. So while the Brent 1mth price is rising to new highs of the year and highest since 2015, the WTI 18mth contract is still 3 dollar lower than its high this year and not at all giving a strong stimulating investment push for shale oil producers.
This is clearly a dream come true for OPEC. That they can have a high Brent 1mth price close to $65/b while at the same time not giving a strong price stimulus to US shale oil producers as they are only offered $53.3/bl on the curve. Yes, Christmas did indeed come early for OPEC this year! Then of course the question is whether Christmas will last all of 2018 or not. So what is at the heart of this Christmas present?
It is two-fold.
One is the increasing Brent crude oil backwardation with the Brent 1mth contract trading at a $5.1/bl premium to the the Brent 18mth contract. This comes partly as a result of the constant draw down in global crude oil inventories and partly due to the increasing net long Brent speculative positioning. And yes there is a relationship between backwardation and speculative length. When net length is increasing the backwardation is increasing.
At the moment net long Brent is at an all-time high. That will of course not last for ever. So in the next market turn when specs pull out the level of backwardation will soften somewhat as well. However, assume that OPEC+ will “hold” the market all through 2018 so that inventories continue yet lower. Not necessarily steeply lower but at least ticking lower. Then the Brent crude oil backwardation should not fall back to zero. Rather it should hold up at some level and then strengthen with declining stocks. In perspective the Brent 1 to 18 mth backwardation time spread traded around $7/b from mid-2011 to mid-2014 when Brent crude traded around $110/b. So the $5/b backwardation may be a bit rich as we are not quite back to a 2011-2014 situation quite yet.
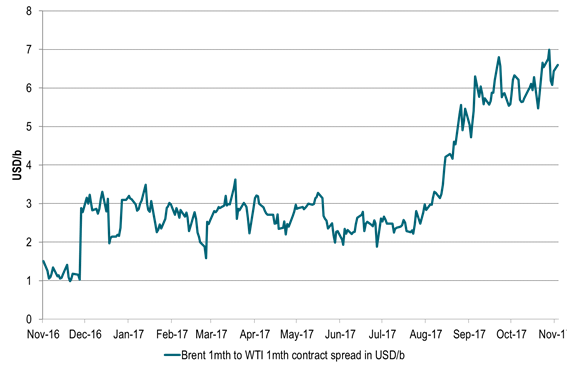
The second and more important one is the increasing Brent to WTI spread we have witnessed this year. And it is not just in the front of the curves where the spread has widened out. It has happened all along the curve. In January the Brent 18mth to WTI 18 mth spread only traded at $1/b while it now trades at close to $6/bl.
When we look at global oil inventories they have been drawing down relentlessly since mid-March this year. In the US we have seen that oil product stocks have drawn down to normal with middle distillate stocks there down to below now ahead of winter. US crude stocks have however been a much more tedious and slow draw down as they in total still stand more than 100 mbl above a fair normal. However, if we split out the US mid-Continent which contains Cushing Oklahoma stocks where the WTI crude is priced we see that non-mid-Continent US crude stocks have been drawn down rapidly. The mid-Continent stocks however are actually now higher than a year ago and rising. And since this is where the WTI crude is priced it is holding down the WTI price.
The WTI crude curve is actually still in contango at the front end of the curve due to this. And since stocks in the mid-Continent are rising higher there is an increasing risk that the WTI crude price might break down into deeper front end contango and an even wider Brent to WTI spread and thus a lower WTI 1mth price.
We are thus likely going to witness a yet widening divergence between Brent and WTI crude oil price. Especially in the front. That is also why the net long speculative positions in WTI is not at an all-time-high as is the case with Brent positions. And those with a long position in WTI are at risk for a break-down in the WTI prices as the mid-Continent stocks continues to rise.
A key question for us at the moment (which we are unable to answer) is whether the rising crude stocks in the US mid-Continent now is due to natural bottlenecks due to lack of pipeline investments or whether it is due to damaged infrastructure following the Hurricane Harvey.
If it is the first then the bottleneck is probably of a lasting character. Then US shale producers have probably reached the short/medium term transportation capacity of getting their oil to the market. It will of course not last for ever as there is always possible to lay more pipes, but it takes time. In that case the Brent crude oil price can continue to rally without having to worry too much because the WTI price which then is stuck in surplus in the mid-US Continent. Then there is no point for US shale oil producers to increase production as they cannot easily get it to market. And the subdued WTI price will be the one telling them not to invest more and not to produce more since it will be low due to high mid-Continent stocks.
If the rising mid-Continental stocks are due to Hurricane Harvey damages then it might be quicker to mend. Then the Brent to WTI spread should contract from current levels once the Harvey damage is mended.
Looking at the US mid-Continent stocks we see that they started to rise at the end of August which was right at the time of Hurricane Harvey and has gone up by some 10 mbl since then. However, this might not be a good indication that Harvey is the culprit as inventories normally rise some 4 mbl during this period anyhow.
We are not quite sure whether it is Hurricane Harvey damage which drives US mid-Continental stocks higher or whether it is structural under investments in pipelines. However, as US shale oil production continues to rise (as we think it will in 2018) the pressure in terms of utilization of US oil pipeline transportation capacities will be increasingly taxed which is likely to hold the Brent – WTI price spread high.
So Brent crude oil price forecasts for 2018 are likely going to be revised up across the board as they now are likely to incorporate a more substantial Brent – WTI 1mth price spread for 2018. Current Brent crude 2018 Bloomberg consensus forecast currently stand at $56/bl with market pricing at $62/bl while SEB’s standing forecast from September is $55/bl.
The fundamental assumption for most forecasting methodologies is still that US shale oil is on the margin. For a long time the assumption has been that US shale oil can deliver almost unlimited at WTI $50/b. That assumption is now breaking down. US shale oil producers have not made money this year with investors now DEMANDING that they deliver profits and not just promises. While it is difficult to say exactly at what level they will create profits it is natural to shift the shale oil base floor price assumption from $50/bl to $55/bl. I.e. assuming that US shale oil production is not going through the roof with a WTI 18 mth price at $55/b. I.e. the WTI price is allowed to trade at $55/bl both in spot and on the curve without creating surplus havoc in the global market.
We thus expect revisions of Brent crude oil forecasts to assume a WTI 1mth crude price delivered at around $55/bl next year and then with a Brent 1mth to WTI 1mth price spread to Brent on top of some $5-7/bl thus placing Brent forecasts for 2018 at around $60-62/bl. Such assumptions are likely to affect our own Brent crude oil forecast for 2018 when we revise it in February next year.
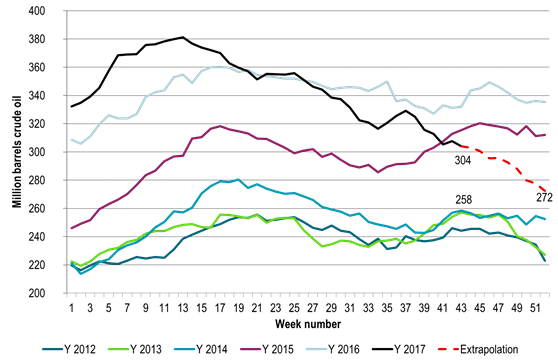
Ch1) US commercial crude oil stocks less the US mid-continent are drawing down rapidly
Getting close to normal by end of year
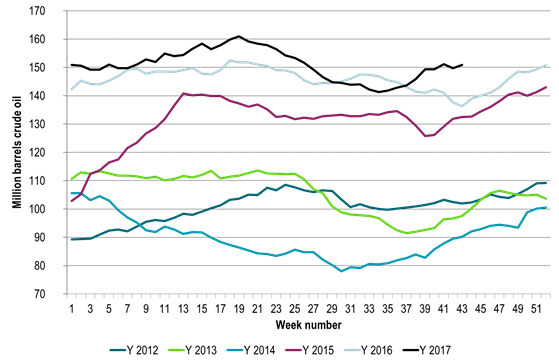
Ch2) US mid-Continent stocks (Pad2) have however rising and above last year.
This is where WTI crude is priced in Cushing Oklahoma and is why the WTI crude curve has front end contango with risk for deeper contango
Ch3) US shale oil regions
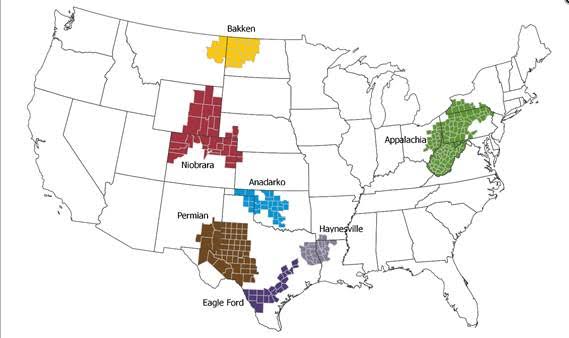
Ch4) Not all shale oil producers need to pass through Cushing Oklahoma
But the exact magnitude and location of bottlenecks getting shale oil to the U.S. Gulf we don’t know.
Looks like Eagle Ford and Permian have more options to bypass Cushing getting right to the US Gulf.
Are Eagle Ford and Permian producers actually getting a price closer to seaborne crude prices than to WTI?
Ch5) Brent and WTI crude curves moving higher over last two weeks
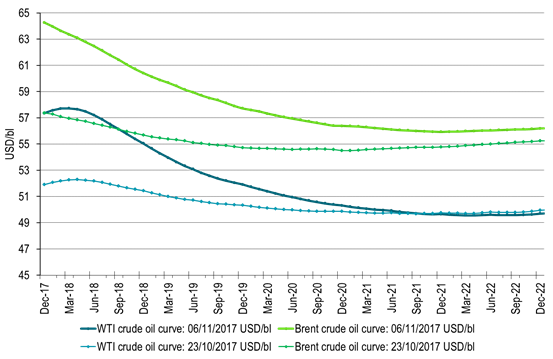
Ch6) Brent 1mth contract has rallied to close to $65/b.
Steepening Brent backwardation and widening Brent – WTI crude spreads has left the WTI 18 mth contract in the doldrums no higher than $53.3/b
Ch7) The WTI 18 mth forward price at $53.3/b still short of year high of $57.4/b
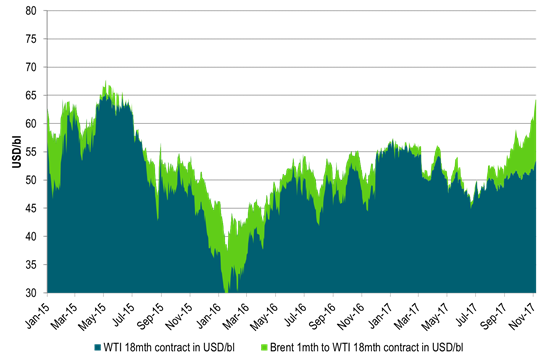
Ch8) Brent 1mth to WTI 1mth crude spread has blown out
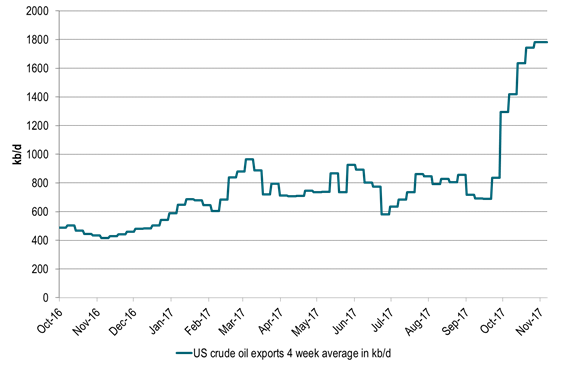
Ch9) And US crude oil is flushing out of the US as exports as a result of the strong widening in Brent to WTI
But as we see above it is not flowing out of the US mid-Continent where WTI is priced
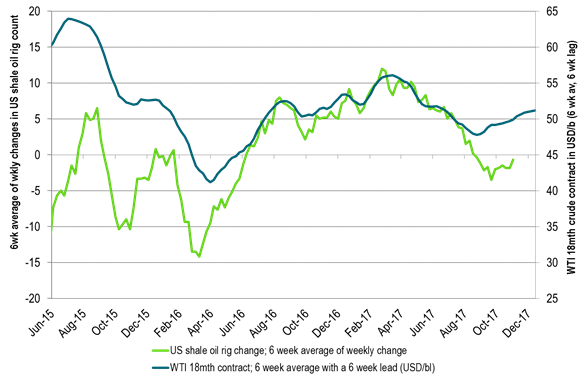
Ch10) US shale oil players are kicking drilling rigs out of the US at a WTI 18mth curve price of $50/bl
They can of course drill more but then they are begging a higher forward WTI price.
Risk for a smoke and mirror in these statistics as shale players are currently running some 100 drilling rigs more than they need.
They need to kick they out in order to align drilling with completions which still ran at a surplus in September as they drilled more than they completed.
We expect shale players to kick out 5-10 rigs every week to Christmas.
It will be sentiment bullish, but unlikely to impact completions all that much in 2018 as they have a load full of DUCs they can complete in 2018
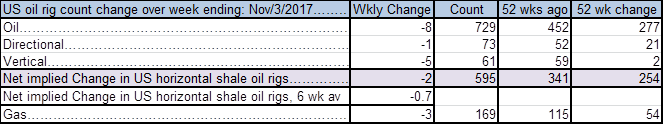
Ch11) US shale players kicking out rigs at a WTI18 curve price of $50/bl
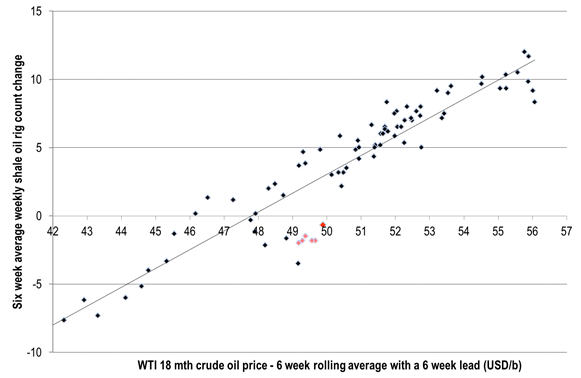
Ch12) Will shale players hold their horses as the mid-term WTI forward price moves higher?
Good reasons to believe that they will kick out more drilling rigs at WTI curve $50/b as investors demand profits
Kind regards
Bjarne Schieldrop
Chief analyst, Commodities
SEB Markets
Merchant Banking
Down on Friday. Up on Monday. The Brent June crude oil contract traded down 5.1% last week to a close of $90.38/b. It reached a high of $103.87/b last Monday and a low of $86.09/b on Friday as Iran announced that the Strait of Hormuz was fully open for transit. That quickly changed over the weekend as the US upheld its blockade of Iranian oil exports while Iran naturally responded by closing the SoH again. The US blew a hole in the engine room of the Iranian ship TOUSKA and took custody of the ship on Sunday. Brent crude is up 5.6% this morning to $95.4/b.

The cease-fire is expiring tomorrow. The US has said it will send a delegation for a second round of negotiations in Islamabad in Pakistan. But Iran has for now rejected a second round of talks as it views US demands as unrealistic and excessive while the US is also blocking the Strait of Hormuz.
While Brent is up 5% this morning, the financial market is still very optimistic that progress will be made. That talks will continue and that the SoH will fully open by the start of May which is consistent with a rest-of-year average Brent crude oil price of around $90/b with the market now trading that balance at around $88/b.
Financial optimism vs. physical deterioration. We have a divergence where the financial market is trading negotiations, improvements and resolution while at the same time the physical market is deteriorating day by day. Physical oil flows remain constrained by disrupted flows, longer voyage times and elevated freight and insurance costs.
Financial markets are betting that a US/Iranian resolution will save us in time from violent shortages down the road. But every day that the SoH remains closed is bringing us closer to a potentially very painful point of shortages and much higher prices.
The US blockade is also a weapon of leverage against its European and Asian allies. When Iran closed the SoH it held the world economy as a hostage against the US. The US blockade of the SoH is of course blocking Iranian oil exports. But it is also an action of disruption directed towards Europe and Asia. The US has called for the rest of the world to engaged in the war with Iran: ”If you want oil from the Persian Gulf, then go and get it”. A risk is that the US plays brinkmanship with the global oil market directed towards its European and Asian allies and maybe even towards China to force them to engage and take part. Maybe unthinkable. But unthinkable has become the norm with Trump in the White House.
Wild moves yesterday. Brent crude traded to a high of $114.43/b and a low of $96.0/b and closed at $99.94/b yesterday.
US – Iran negotiations ongoing or not? What a day. Donald Trump announced that good talks were ongoing between Iran and the US and that the 48 hour deadline before bombing Iranian power plants and energy infrastructure was postponed by five days subject to success of ongoing meetings. Iranian media meanwhile stated that no meetings were ongoing at all.
Today we are scratching our heads trying to figure out what yesterday was all about.
Friends and family playing the market? Was it just Trump and his friends and family who were playing with oil and equity markets with $580m and $1.46bn in bets being placed by someone in oil and equity markets just 15 minutes before Trump’s announcement?
Was Trump pulling a TACO as he reached his political and economic pain point: Brent at $112/b, US Gas at $4/gal, SPX below 200dma and US 10yr above 4.4%?
Different Iranian factions with Trump talking with one of them? Are there real negotiations going on but with the US talking to one faction in Iran while another, the hardliners, are not involved and are denying any such negotiations going on?
Extending the ultimatum to attack and invade Kharg island next weekend? Or, is the five day delay of the deadline a tactical decision to allow US amphibious assault ships and marines to arrive in the Gulf in the upcoming weekend while US and Israeli continues to degrade Iranian military targets till then. And then next weekend a move by the US/Israel to attack and conquer for example the Kharg island?
We do not really know which it is or maybe a combination of these.
We did get some kind of TACO ydy. But markets have been waiting for some kind of TACO to happen and yesterday we got some kind of TACO. And Brent crude is now trading at $101.5/b as a result rather than at $112-114/b as it did no the high yesterday.
But what really matters in our view is the political situation on the ground in Iran. Will hardliners continue to hold power or will a more pragmatic faction gain power?
If the hardliners remain in power then oil pain should extend all the way to US midterm elections. The hardliners were apparently still in charge as of last week. Iran immediately retaliated and damaged LNG infrastructure in Qatar after Israel hit Iranian South Pars. The SoH was still closed and all messages coming out of Iran indicated defiance. Hardliners continues in power has a huge consequence for oil prices going forward. The regime has played its ’oil-weapon’ (closing or chocking the Strait of Hormuz). It is using it to achieve political goals. Deterrence: it needs to be so politically and economically expensive to attack Iran that it won’t happen again in the future. Or at least that the US/Israel thinks 10-times over before they attack again. The highest Brent crude oil closing price since the start of the war is $112.19/b last Friday. In comparison the 20-year inflation adjusted Brent price is $103/b. So Brent crude last Friday at $112.19/b isn’t a shockingly high price. And it is still far below the nominal high of $148/b from 2008 which is $220/b if inflation adjusted. So once in a lifetime Iran activates its most powerful weapon. The oil weapon. It needs to show the power of this weapon and it needs to reap political gains. Getting Brent to $112/b and intraday high of $119.5/b (9 March) isn’t a display of the power of that weapon. And it is not a deterrence against future attacks.
So if the hardliners remain in power in Iran, then the SoH will likely remain chocked all the way to US midterm elections and Brent crude will at a minimum go above the historical nominal high of $148/b from 2008.
Thus the outlook for the oil price for the rest of the year doesn’t depend all that much of whether Trump pulls a TACO or not. Stops bombing or not. It depends more on who is in charge in Iran. If it is the hardliners, then deterrence against future attacks via chocking of the SoH and high oil prices is the likely line of action. It is impacting the world but the Iranian ’oil-weapon’ is directed towards the US president and the the US midterm elections.
If a pragmatic faction gets to power in Iran, then a very prosperous future is possible. However, if power is shifting towards a more pragmatic faction in Iran then a completely different direction could evolve. Such a faction could possibly be open for cooperation with the US and the GCC and possibly put its issues versus Israel aside. Then the prosperity we have seen evolving in Dubai could be a possible future also for Iran.
So far it looks like the hardliners are fully in charge. As far as we can see, the hardliners are still fully in control in Iran. That points towards continued chocking of the SoH and oil prices ticking higher as global inventories (the oil market buffers) are drawn lower. And not just for a few more weeks, but possibly all the way to the US midterm elections.
A brief sigh of relief yesterday as oil infra at Kharg wasn’t damaged. But higher today. Brent crude dabbled around a bit yesterday in relief that oil infrastructure at Iran’s Kharg island wasn’t damaged. It traded briefly below the 100-line and in a range of $99.54 – 106.5/b. Its close was near the low at $100.21/b.
No easy victorious way out for Trump. So no end in sight yet. Brent is up 3.2% today to $103.4/b with no signs that the war will end anytime soon. Trump has no easy way to declare victory and mission accomplished as long as Iran is in full control of the Strait of Hormuz while also holding some 440 kg of uranium enriched to 60% and not far from weapons grade at 90%. As long as these two factors are unresolved it is difficult for Trump to pull out of the Middle East. Naturally he gets increasingly frustrated over the situation as the oil price and US retail gas prices keeps ticking higher while the US is tied into the mess in the Middle East. Trying to drag NATO members into his mess but not much luck there.
When commodity prices spike they spike 2x, 3x, 4x or 5x. Supply and demand for commodities are notoriously inflexible. When either of them shifts sharply, the the price can easily go to zero (April 2022) or multiply 2x, 3x, or even 5x of normal. Examples in case cobalt in 2025 where Kongo restricted supply and the price doubled. Global LNG in 2022 where the price went 5x normal for the full year average. Demand for tungsten in ammunition is up strongly along with full war in the middle east. And its price? Up 537%.
Why hasn’t the Brent crude oil price gone 2x, 3x, 4x or 5x versus its normal of $68/b given close to full stop in the flow of oil of the Strait of Hormuz? We are after all talking about close to 20% of global supply being disrupted. The reason is the buffers. It is fairly easy to store oil. Commercial operators only hold stocks for logistical variations. It is a lot of oil in commercial stocks, but that is predominantly because the whole oil system is so huge. In addition we have Strategic Petroleum Reserves (SPRs) of close to 2500 mb of crude and 1000 mb of oil products. The IEA last week decided to release 400 mb from global SPR. Equal to 20 days of full closure of the Strait of Hormuz. Thus oil in commercial stocks on land, commercial oil in transit at sea and release of oil from SPRs is currently buffering the situation.
But we are running the buffers down day by day. As a result we see gradually increasing stress here and there in the global oil market. Asia is feeling the pinch the most. It has very low self sufficiency of oil and most of the exports from the Gulf normally head to Asia. Availability of propane and butane many places in India (LPG) has dried up very quickly. Local prices have tripled as a result. Local availability of crude, bunker oil, fuel oil, jet fuel, naphtha and other oil products is quickly running down to critical levels many places in Asia with prices shooting up. Oman crude oil is marked at $153/b. Jet fuel in Singapore is marked at $191/b.
Oil at sea originating from Strait of Hormuz from before 28 Feb is rapidly emptied. Oil at sea is a large pool of commercial oil. An inventory of oil in constant move. If we assume that the average journey from the Persian Gulf to its destinations has a volume weighted average of 13.5 days then the amount of oil at sea originating from the Persian Gulf when the the US/Israel attacked on 28 Feb was 13.5 days * 20 mb/d = 269 mb. Since the strait closed, this oil has increasingly been delivered at its destinations. Those closest to the Strait, like Pakistan, felt the emptying of this supply chain the fastest. Propane prices shooting to 3x normal there already last week and restaurants serving cold food this week is a result of that. Some 50-60% of Asia’s imports of Naphtha normally originates from the Persian Gulf. So naphtha is a natural pain point for Asia. The Gulf also a large and important exporter of Jet fuel. That shut in has lifted jet prices above $200/b.
To simplify our calculations we assume that no oil has left the Strait since that date and that there is no increase in Saudi exports from Yanbu. Then the draining of this inventory at sea originated from the Persian Gulf will essentially look like this:
The supply chain of oil at sea originating from the Strait of Hormuz is soon empty. Except for oil allowed through the Strait of Hormuz by Iran and increased exports from Yanbu in the Red Sea. Not included here.

Oil at sea is falling fast as oil is delivered without any new refill in the Persian Gulf. Waivers for Russian crude is also shifting Russian crude to consumers. Brent crude will likely start to feel the pinch much more forcefully when oil at sea is drawn down another 200 mb to around 1000 mb. That is not much more than 10 days from here.

Oil and oil products are starting to become very pricy many places. Brent crude has still been shielded from spiking like the others.


Market Still Betting on Timely Resolution, But Each Day Raises Shortage Risk

Christian Kopfer om läget för oljan

Marknaden måste börja betrakta de höga kopparpriserna som det nya normala

Det fysiska spotpriset på brentolja har slagit nytt rekord

40 minuter med Javier Blas om hur världen verkligen påverkas av energikrisen
40 minuter med Javier Blas om hur världen verkligen påverkas av energikrisen

Elpriserna fördubblas, stor osäkerhet inför sommaren

MP Materials, USA:s svar på Kinas dominans över sällsynta jordartsmetaller
Det fysiska spotpriset på brentolja har slagit nytt rekord

Studsvik har idag ansökt om att få bygga 1200-1600 MW kärnkraft i Valdemarsvik
-
 Nyheter3 veckor sedan
40 minuter med Javier Blas om hur världen verkligen påverkas av energikrisen
-
 Nyheter4 veckor sedan
Elpriserna fördubblas, stor osäkerhet inför sommaren
-
 Nyheter4 veckor sedan
MP Materials, USA:s svar på Kinas dominans över sällsynta jordartsmetaller
-
 Nyheter2 veckor sedan
Det fysiska spotpriset på brentolja har slagit nytt rekord
-
 Nyheter4 veckor sedan
Studsvik har idag ansökt om att få bygga 1200-1600 MW kärnkraft i Valdemarsvik
-
 Nyheter2 veckor sedan
Marknaden måste börja betrakta de höga kopparpriserna som det nya normala
-

 Nyheter4 veckor sedan
Matproduktion är beroende av gödsel, Gulfkriget skapar brist
-
Analys4 veckor sedan
TACO (or Whatever It Was) Sends Oil Lower — Iran Keeps Choking Hormuz