

Analys
Gold and oil back in favour as geopolitical risks rise

 Geopolitical risk took another lurch for the worse last week, with Russia imposing a full ban on food imports and the US intervening in Iraq. While most macro data continues to point to a pick-up in global growth, benefiting cyclical assets, investors remain jittery and largely on the sidelines. With the geopolitical situation likely to remain tense, we expect defensive assets to continue to see strong demand in the near-term.
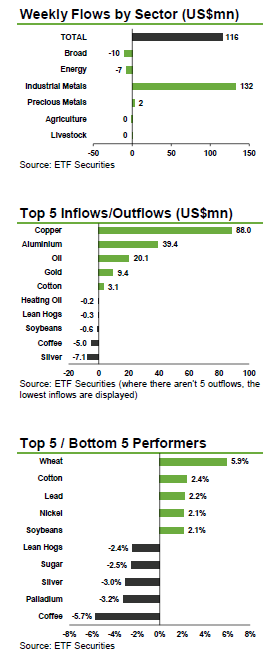 Gold and oil back in favour as geopolitical risks linger. Total inflows into gold and oil ETPs reached US$223mn and US$82mn respectively over the past month as geopolitical risks in Russia and the Middle East cloud the positive global economic outlook. The US authorised limited air strikes in Iraq last week, while Russia banned imports of food from the EU and the US, increasing risk aversion. While oil production and export facilities in southern Iraq have yet to be affected, a further push by ISIS into the south would likely trigger another spike in oil prices. With the geopolitical situation expected to remain tense, demand for defensive assets is likely to remain strong. Meanwhile, ETFS Physical Silver (PHAG) saw US$8.5mn of outflows as the silver price came under pressure last week. Nearterm headwinds are likely to continue to weigh on silver until it is clear that industrial demand is coming through. With the US manufacturing ISM rising to its highest level since 2011 and China demand picking up, we anticipate that industrial demand support will ultimately offset negative pressure from expectations of rising real interest rates.
Copper and aluminium receive combined inflows of US$127mn as investors buy into China’s growth story. While weak China’s import data and heightened geopolitical risks weighed on most industrial metal prices last week, growth in the world’s second largest economy remains robust and with strong government support the industrial metal rally looks set to continue. Stronger US growth combined with a rebound in Chinese manufacturing data and more decisive monetary stimulus in the euro area should continue to be supportive of commodity prices, metals in particular, in the coming months.
Long wheat ETPs receive US$2.7mn of inflows as abundant rainfall in Europe decreased the availability of high quality wheat. Wheat prices reacting strongly to the news and were up 5.9% last week, after having lost over 7% since the beginning of the year. Long cotton ETPs also saw inflows last week, totalling US$2.6mn, on expectations of a drought in Australia, the world’s cotton 3rd largest cotton exporter. At the same time, investors reduced their coffee exposure, with long and leveraged coffee ETPs seeing over US$5mn of outflows, as price plummeted 5.7% last week.
Key events to watch this week. Industrial production statistics for a number of countries will be coming out this week, with China, the US and the Eurozone’s likely to be watched closely. Bank of England Inflation Report will also be looked at by investors, as inflationary pressure might prompt an earlier-than-expected rate hike.


After reaching USD 66.78 per barrel on Friday afternoon, Brent crude has since traded mostly sideways, yet dipping lower this morning. The market appears to be consolidating last week’s sharp gains, with Brent now easing back to around USD 64.5 per barrel, roughly USD 2.3 below Friday’s peak but still well above last Monday’s USD 60.07 low.

The rebound last week was initially driven by Washington’s decision to blacklist Russia’s two largest oil producers, Rosneft and Lukoil, which together account for nearly half of the country’s crude exports. The move sparked a wave of risk repricing and short covering, with Brent rallying almost 10% from Monday’s trough. Yet, the market is now questioning the actual effectiveness of the sanctions. While a full blacklisting sounds dramatic, the mechanisms for enforcement remain unclear, and so far, there are no signs of disrupted Russian flows.
In practice, these measures are unlikely to materially affect Russian supply or revenues in the near term, yet we have now seen Indian refiners reportedly paused new orders for Russian barrels pending government guidance. BPCL is expected to issue a replacement spot tender within 7–10 days, potentially sourcing crude from non-sanctioned entities instead. Meanwhile, Lukoil is exploring the sale of overseas assets, and Germany has requested extra time for Rosneft to reorganize its refining interests in the country.
The broader market focus is now shifting toward this week’s Fed decision and Sunday’s OPEC+ meeting, both seen as potential short-term price drivers. Renewed U.S.-China trade dialogue ahead of Trump’s meeting with President Xi Jinping in South Korea is also lending some macro support.
In short, while the White House’s latest move adds to geopolitical noise, it does not yet represent a true supply disruption. If Washington had intended to apply real pressure, it could have advanced the long-standing Senate bill enforcing secondary sanctions on buyers of Russian oil, legislation with overwhelming backing, or delivered more direct military assistance to Ukraine. Instead, the latest action looks more like political theatre than policy shift, projecting toughness without imposing material economic pain.
Still, while the immediate supply impact appears limited, the episode has refocused attention on Russia’s export vulnerability and underscored the ongoing geopolitical risk premium in the oil market. Combined with counter-seasonal draws in U.S. crude inventories, record-high barrels at sea, and ongoing uncertainty ahead of the OPEC+ meeting, short-term fundamentals remain somewhat tighter than the broader surplus story suggests.
i.e., the sanctions may prove mostly symbolic, but the combination of geopolitics and uneven inventory draws is likely to keep Brent volatile around the low to mid-USD 60s in the days ahead.
Hesitant today. Brent jumped to an intraday high of $66.36/b yesterday after having touched an intraday low of $60.07/b on Monday as Indian and Chinese buyers cancelled some Russian oil purchases and instead redirected their purchases towards the Middle East due to the news US sanctions. Brent is falling back 0.4% this morning to $65.8/b.

It’s our strong view that the only sensible thing is to sell this rally. In all Trump’s unpredictability he has become increasingly predictable. Again and again he has rumbled about how he is going to be tough on Putin. Punish Putin if he won’t agree to peace in Ukraine. Recent rumbling was about the Tomahawk rockets which Trump threatened on 10 October and 12 October to sell/send to Ukraine. Then on 17 October he said that ”the U.S. didn’t want to give away weapons (Tomahawks) it needs”.
All of Trump’s threats towards Putin have been hot air. So far Trump’s threats have been all hot air and threats which later have evaporated after ”great talks with Putin”. After all these repetitions it is very hard to believe that this time will be any different. The new sanctions won’t take effect before 21. November. Trump has already said that: ”he was hoping that these new sanctions would be very short-lived in any case”. Come 21. November these new sanctions will either evaporate like all the other threats Trump has thrown at Putin before fading them. Or the sanctions will be postponed by another 4 weeks or 8 weeks with the appearance that Trump is even more angry with Putin. But so far Trump has done nothing that hurt Putin/Russia. We can’t imagine that this will be different. The only way forward in our view for a propre lasting peace in Ukraine is to turn Ukraine into defensive porcupine equipped with a stinging tail if need be.
China will likely stand up to Trump if new sanctions really materialize on 21 Nov. Just one country has really stood up to Trump in his tariff trade war this year: China. China has come of age and strength. I will no longer be bullied. Trump upped tariffs. China responded in kind. Trump cut China off from high-end computer chips. China put on the breaks on rare earth metals. China won’t be bullied any more and it has the power to stand up. Some Chinese state-owned companies like Sinopec have cancelled some of their Russian purchases. But China’s Foreign Ministry spokesperson Guo Jiakun has stated that China “oppose unilateral sanctions which lack a basis in international law and authorization of the UN Security Council”. Thus no one, not even the US shall unilaterally dictate China from whom they can buy oil or not. This is yet another opportunity for China to show its new strength and stand up to Trump in a show of force. Exactly how China choses to play this remains to be seen. But China won’t be bullied by over something as important as its oil purchases. So best guess here is that China will defy Trump on this. But probably China won’t need to make a bid deal over this. Firstly because these new sanctions will either evaporate as all the other threats or be postponed once we get to 21 November. Secondly because the sanctions are explicit towards US persons and companies but only ”may” be enforced versus non-US entities.
Sanctions is not a reduction in global supply of oil. Just some added layer of friction. Anyhow, the new sanctions won’t reduce the supply of Russian crude oil to the market. It will only increase the friction in the market with yet more need for the shadow fleet and ship to ship transfer of Russian oil to dodge the sanctions. If they materialize at all.
The jump in crude oil prices is probably due to redirections of crude purchases to the Mid-East and not because all speculators are now turned bullish. Has oil rallied because all speculators now suddenly have turned bullish? We don’t think so. Brent crude has probably jumped because some Indian and Chinese oil purchasers of have redirected their purchases from Russia towards the Mid-East just in case the sanctions really materializes on 21 November.
Parts of the Brent crude curve dipping into the high $50ies/b. Brent crude fell 2.3% over the week to Friday. It closed the week at $61.29/b, a slight gain on the day, but also traded to a low of $60.14/b that same day and just barely avoided trading into the $50ies/b. This morning it is risk-on in equities which seems to help industrial metals a little higher. But no such luck for oil. It is down 0.8% at $60.8/b. This week looks set for Brent crude to dip its feet in the $50ies/b. The Brent 3mth contract actually traded into the high $50ies/b on Friday.
The front-end backwardation has been on a weakening foot and is now about to fully disappear. The lowest point of the crude oil curve has also moved steadily lower and lower and its discount to the 5yr contract is now $6.8/b. A solid contango. The Brent 3mth contract did actually dip into the $50ies/b intraday on Friday when it traded to a low point of $59.93/b.
More weakness to come as lots of oil at sea comes to ports. Mid-East OPEC countries have boosted exports along with lower post summer consumption and higher production. The result is highly visibly in oil at sea which increased by 17 mb to 1,311 mb over the week to Sunday. Up 185 mb since mid-August. On its way to discharge at a port somewhere over the coming month or two.
Don’t forget that the oil market path ahead is all down to OPEC+. Remember that what is playing out in the oil market now is all by design by OPEC+. The group has decided that the unwind of the voluntary cuts is what it wants to do. In a combination of meeting demand from consumers as well as taking back market share. But we need to remember that how this plays out going forward is all at the mercy of what OPEC+ decides to do. It will halt the unwinding at some point. It will revert to cuts instead of unwind at some point.
A few months with Brent at $55/b and 40-50 US shale oil rigs kicked out may be what is needed. We think OPEC+ needs to see the exit of another 40-50 drilling rigs in the US shale oil patches to set US shale oil production on a path to of a 1 mb/d year on year decline Dec-25 to Dec-26. We are not there yet. But a 2-3 months period with Brent crude averaging $55/b would probably do it.
Oil on water increased 17 mb over the week to Sunday while oil in transit increased by 23 mb. So less oil was standing still. More was moving.

Crude oil floating storage (stationary more than 7 days). Down 11 mb over week to Sunday

The lowest point of the Brent crude oil curve versus the 5yr contract. Weakest so far this year.

Crude oil 1mth to 3mth time-spreads. Dubai held out strongly through summer, but then that center of strength fell apart in late September and has been leading weakness in crude curves lower since then.


Brent slips to USD 64.5: sanction doubts and OPEC focus reduce gains

Ett samtal om guld, silver, olja och skog
Sell the rally. Trump has become predictable in his unpredictability

Gruvbolaget Boliden överträffade analytikernas förväntningar

Australien och USA investerar 8,5 miljarder USD för försörjningskedja av kritiska mineraler

Goldman Sachs höjer prognosen för guld, tror priset når 4900 USD

Blykalla och amerikanska Oklo inleder ett samarbete

Guld nära 4000 USD och silver 50 USD, därför kan de fortsätta stiga

Leading Edge Materials är på rätt plats i rätt tid

Nytt prisrekord, guld stiger över 4000 USD
-
 Nyheter3 veckor sedan
Goldman Sachs höjer prognosen för guld, tror priset når 4900 USD
-
 Nyheter4 veckor sedan
Blykalla och amerikanska Oklo inleder ett samarbete
-
 Nyheter4 veckor sedan
Guld nära 4000 USD och silver 50 USD, därför kan de fortsätta stiga
-
 Nyheter2 veckor sedan
Leading Edge Materials är på rätt plats i rätt tid
-
 Nyheter3 veckor sedan
Nytt prisrekord, guld stiger över 4000 USD
-

 Nyheter4 veckor sedan
Ett samtal om guld, olja, koppar och stål
-
Analys4 veckor sedan
OPEC+ will likely unwind 500 kb/d of voluntary quotas in October. But a full unwind of 1.5 mb/d in one go could be in the cards
-

 Nyheter4 veckor sedan
Neptune Energy bekräftar enorma litiumfyndigheter i Tyskland