

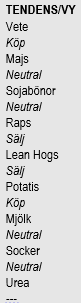
Analys
SEB Jordbruksprodukter, 11 augusti 2014


 Rysslands importstopp, i strid med WTO-reglerna och av allt att döma genomförd med hjälp av Brasilien, har sänkt terminspriset för mjölkråvara på terminsmarknaden för leverans under hösten och framöver med 15%, från 3.70 Kr / Kg till 3.15 Kr / Kg på ett par dagar. Detta kommer sannolikt att leda till kraftigt försämrad lönsamhet och problem när förändringen i världsmarknadspriset via mejerierna når mjölkbönderna i Europa. I Brasilien hyllas landets president Dilma Rousseff då flera aktörer framförallt inom köttsektorn ser fram emot att öka sin export till Ryssland. Dilma Rousseff leder opinionsundersökningarna med en liten marginal inför presidentvalet i höst.
Spannmålsmarknaden på Matif har präglats av osäkerhet om vilken kvalitet som ska kunna levereras på kontraktet. Priset rörde sig 13 euro uppåt och nedåt på grund av bristfällig handläggning och kommunikation av Euronextbörsen. Till slut gjorde man ingen förändring av vilken kvalitet som skulle få levereras, men det var först efter att stora spannmålshandlare helt slutat att handla på börsen. Förtroendet för Matifs integritet återställdes något, men inte helt. Korrelationen mellan svenska spotpriser och Chicagos terminer är pratiskt taget lika bra som med Matifs terminer.
Prisrörelserna har annars varit små på vete i Chicago, majs, sojabönor och raps. Det amerikanska jordbruksdepartementet publicerar sin augusti-WASDE på tisdag den 12 augusti.
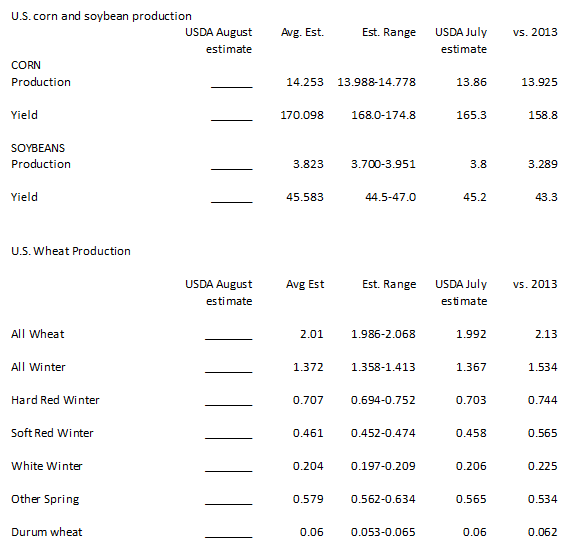
WASDE-förväntningar
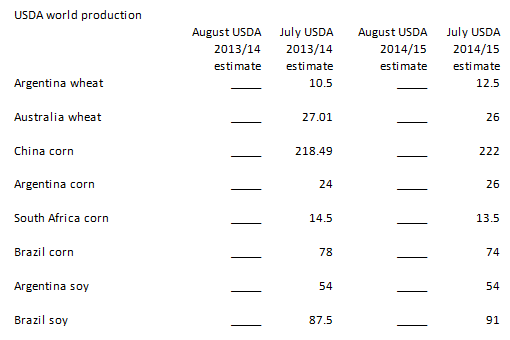
Reuters har sammanställt analytikerkårens förväntningar på WASDE-rapporten på tisdag:
Rysslands importstopp
Den 7 augusti meddelade Rysslands premiärminister Medvedev ett importstopp på kött, mejeriprodukter, fisk, frukt och grönsaker från EU, USA, Norge, Kanada och Australien. Förra året importerade Ryssland dessa varor till ett värde av 25 miljarder dollar.
Jordbruksverket publicerade en rapport om det ryska importstoppet. De skriver att effekten är liten för Sveriges del. De skriver samtidigt att priser kan förändras. Och det är naturligtvis genom priset som påverkan sker för Sverige. Jordbruksverket har nog inte rätt att effekten för Sverige kommer att vara försumbar. Terminspriset på smör har t ex redan fallit med 15% på Eurexbörsen och detta kommer att påverka Sveriges mjölkbönder om ett tag.
Rysslands importstopp på en rad matvaror är ett svar på EU:s och USA:s sanktion riktad mot statligt kontrollerade ryska banker genom att neka dessa tillträde till kapitalmarknaden i EU och USA. Den ryska jordbruksbanken är en av de drabbade bankerna. Sanktionen av dessa banker är inte ett brott mot någon internationell lag eller avtal. Rysslands importstopp är däremot ett brott mot WTO-reglerna, vilket är något som EU:s politiker påpekat. Ryssland har redan brutit mot WTO-reglerna genom att redan i juni neka import av polska äpplen. Importstoppet av griskött efter att ett vildsvin i Polen / Litauen visat sig ha ASF (som finns i Ryssland) är också en sådan åtgärd som kan ifrågasättas då Ryssland förbjöd import från hela EU. Rysslands beslut är i linje med Rysslands tidigare agerande. Putin har en uttalad vilja att Ryssland ska bli självförsörjande på mat.
Importstoppet drabbar främst länder som tidigare varit en del av Sovjetunionen, eller ockuperade av Sovjetunionen, samt Finland, som varit en del av Ryssland. Dessa länders export av jordbruksprodukter måste nu söka sig västerut och det finns en latent överkapacitet som måste reduceras genom nedläggning av produktionskapacitet – där den är minst lönsam inom EU. Ryssland har länge strävat i den här riktningen och det måste anses ytterst osannolikt att Ryssland ska återgå till importberoende för varor som kött, grönsaker och mejeriprodukter. Detta måste betraktas som en permanent marknadschock.
Vi kan se på världsmarknadspriserna för t ex mejeriprodukter, att eftersom dessa priser sjunkit tyder det på att marknaden gör den korrekta bedömningen att efterfrågan på global basis har minskat i ett slag. Marknaden gör tolkningen att ryssar inte kommer att kunna konsumera lika stor mängd som tidigare i det korta perspektivet och i ett lite längre perspektiv bygga upp en egen produktion. Dels betyder detta att Putin så att säga svälter sin egen befolkning, dels betyder det att produktionskapacitet utanför Ryssland måste minska. Båda dessa signaler går naturligtvis genom ett högt pris i Ryssland och ett lågt pris utanför Ryssland. Att detta skulle ha en liten påverkan på Sverige, som jordbruksverket skriver, stämmer inte, eftersom världsmarknadspriset styr lika mycket här som i resten av den fria världen.
Seniora jordbruksexperter från samtliga av EU-28:s medlemsländer kommer att träffas nästa torsdag för att analysera effekten av Rysslands importstopp på mat från EU, meddelade EU Kommissionen i fredags. Kommissionen tillsätter en egen arbetsgrupp på måndag för att bedöma situationen.
Ungefär 10% av EU:s totala jordbruksproduktion exporteras till Ryssland till ett värde av 11 miljarder euro per år. Ryssland är USA:s 23:e största exportdestination för mat. Vita Huset nöjde sig med att säga att Rysslands importstopp huvudsakligen skadar ryska medborgare genom att inflationen i Ryssland stiger.
Den franska tidningen Le Figaro skrev i fredags att EU kan använda 400 MEUR för att stödja unionens jordbrukssektor. Jordbrukskommissionären Dacian Ciolos sade till Le Figaro att EU:s CAP innefattar krisreserver som kan användas omedelbart.
Att dra Ryssland inför WTO, såsom man gjort med de polska äpplena i juni, tar lång tid och man kan fråga sig hur meningsfullt det är idag.
Omedelbart efter meddelandet av importstoppet den 7 augusti bjöds en rad Syd- och Mellanamerikanska länder in till Kreml för att höra hur de kan exportera mat till Ryssland. Enligt Bloomberg befann sig en brasiliansk delegation redan i Moskva den 6 augusti. Redan den 7 augusti blev 90 företag i Brasilien godkända för export till Ryssland. De länder som svarade på Rysslands inbjudan var Argentina, Ecuador och Brasilien.
Det är svårt att föreställa sig att Ryssland inte säkerställt att det fanns en ersättning för matförsörjningen innan man inrättade importstoppet från EU och USA med flera. Att en delegation från Brasilien redan befann sig i Moskva dagen innan Medvedevs beslut och att hela 90 företag godkändes på dagen tyder på att Brasilien samarbetat med Ryssland för att Ryssland skulle kunna genomföra det här importstoppet – och brottet mot WTO-reglerna. Överenskommelsen mellan Brasilien och Ryssland har troligtvis tagit flera veckor att förbereda, och kanske började redan när Putin vistades en vecka som gäst hos Brasiliens president i juni. Detta innebär att handelskriget har fått globala dimensioner och att Brasilien, Argentina och Ecuador är allierade till Ryssland. För några månader sedan bildade de tillsammans med Indien och Kina, den så kallade BRIC-banken, som ett alternativ till World Bank. Det är svårt att tänka sig att detta inte skulle få konsekvenser vad gäller Argentinas, Brasiliens och Ecuadors relation med i första hand USA, men kanske även till EU. I Brasilien är lantbrukarna mycket glada och Dilma Rousseff hyllas. Hon räknar med att vinna presidentvalet i höst. Samtidigt kommer detta att leda till konkurser främst för mjölkbönder i Sverige, Finland och andra länder.
Argentina har som bekant förlorat i en domstol i New York och gått i konkurs igen. Argentina har överklagat till domstolen i Haag. Domaren i New York har då hotat Argentina att döma det för domstolstrots, en rätt så intressant situation.
Odlingsväder
Europa väntas fortsätta vara blötare än normalt de kommande två veckorna. Ingen förändring.
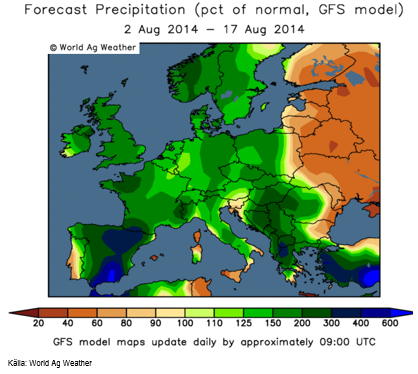
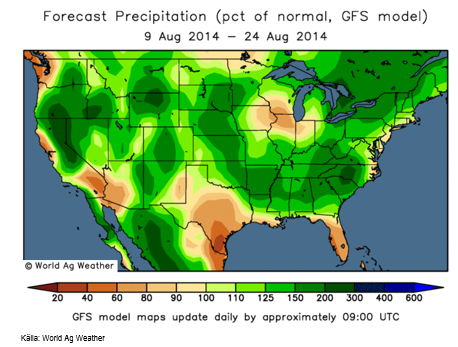
Prognoskartan för nederbörden i USA de kommande två veckorna ser fortsatt ”bearish” ut för majs och sojabönor:
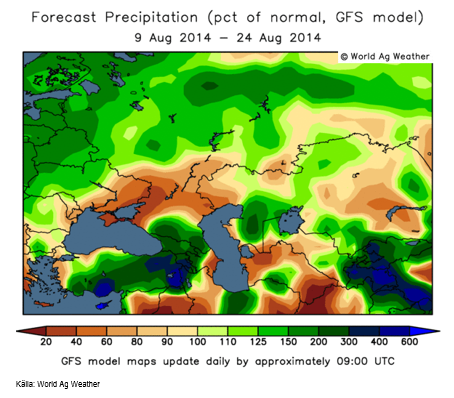
Prognosen för Ryssland och Ukraina visar regn och därmed tar perioden av torka slut. Detta är bearish för spannmål.
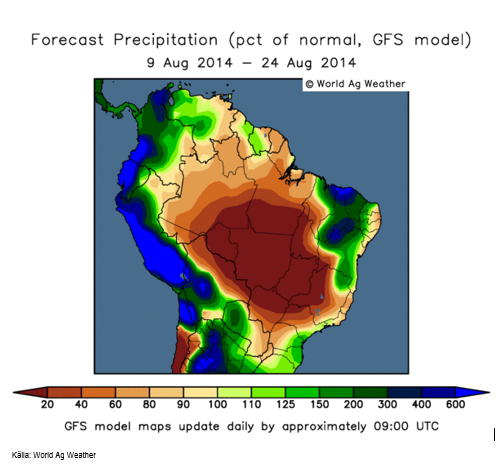
Brasilien kommer att fortsätta torka upp och väntas få nästan inget regn alls.
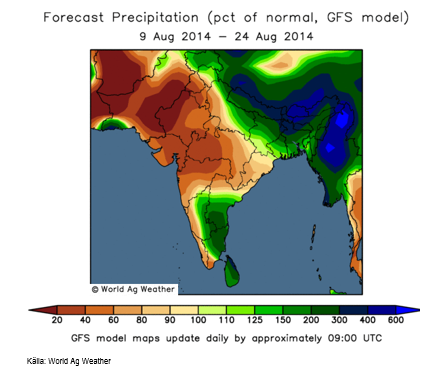
Indien har fått väsentligt mer nederbörd den senaste veckan än de brukar ha så här års under monsunen. Enligt prognoskartan fortsätter nederbörden att vara starkare än normalt.
Vete
Matifvetets prisrörelser i veckan påverkades till största delen av osäkerheten – och klargörandet – av vilken kvalitet som terminskontraktet skulle avse. Matif har länge haft problem med att Senalia är en för liten leveranspunkt för den omfattning som Matifkontraktet med åren har fått. Euronext / Matif har därför förhandlat om att även Soufflets Socomac-silo i Rouen ska bli en leveranspunkt. Det har dock varit oklart vilken kvalitet Socomac-silon skulle acceptera. Det oroade marknaden allt mer att besked om detta drog ut på tiden och gissningen var att Socomac skulle ha ett lägre kvalitetskrav än Senalia, vilket omedelbart hade sänkt Matif-kontraktets kvalitetskrav till den nivån, med prisfall som följd. Osäkerheten gick så långt att en mycket stor handelsfirma slutade att handla på Matif. Flera firmor övervägde att flytta sin handel till Chicagokontraktet. Matif hade därför inget val och meddelade att Socomac skulle ha exakt samma kvalitetskrav som Senalia. Beskedet fick priset på novemberkontraktet att öppna kraftigt uppåt i onsdags och priset rörde vid 180 euro innan det föll tillbaka igen. Många passade på att sälja på uppstället i pris. Bondekooperativen i Frankrike har fortsatt att sälja terminer och köpa säljoptioner.
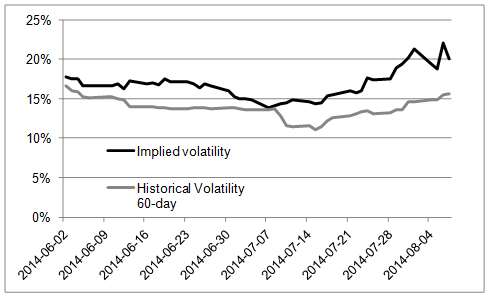
Volatiliteten som optioner prissätts med har stigit under hela juli samtidigt som terminerna har fallit. Detta är ovanligt. Det har antagits att osäkerheten om vilken kvalitet som skulle levereras i november har ökat hopprisken i priset och därmed gjort optioner dyrare. Om det vore så, skulle volatiliteten sjunkit direkt efter Euronexts klargörande i onsdags. Men volatiliteten har fortsatt upp. Alltså är det troligare att det är paniken hos bondekooperativen som ligger bakom.
Nedan ser vi en bild på historisk volatilitet (hur mycket terminspriset faktiskt rört sig omräknat till årsbasis) de senaste 60 handelsdagarna och implicit volatilitet, dvs den volatilitet som optioner prissätts med. Vi ser att båda har ökat sedan början av juli, men implicit volatilitet har ökat mest.
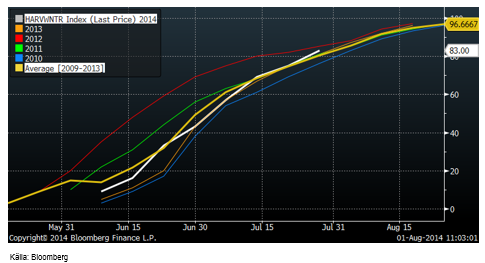
Den franska veteskörden var till 92% klar den 4 augusti, upp från 76% veckan innan enligt FranceAgriMer. Förra året samma tid var 61% skördat. Det är fortfarande oklart hur mycket som inte klarar kvarnvetekraven.
Öppen balans har minskat sedan mitten av juli, men ökat de senaste dagarna. Minskningen kan bero på att de som tidigare sålt, köpt tillbaka kontrakt och det minskade intresset kan också bero på det ovan nämnda missnöjet med osäkerheten i vad kontraktet avser för kvalitet. Vi har inte sett motsvarande minskande intresse (öppen balans) i Chicago. Att öppen balans ökat de senaste dagarna, efter Euronexts besked, tyder på att kvalitetsosäkerheten i kontraktet är det som ligger bakom detta fenomen, snarare än skiftande tro om priset.
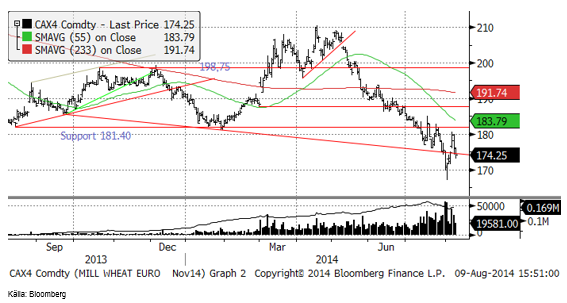
Matif november stängde i fredags i nivå med ett tekniskt stöd.
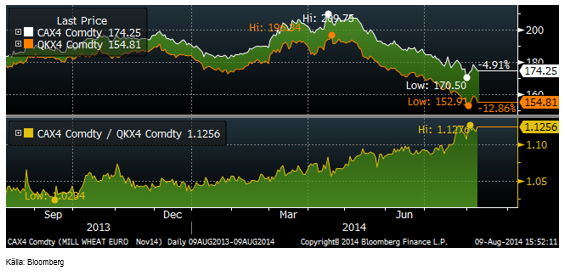
Skillnaden mellan ”London-vete” (foder) och Matif (kvarnvete) har fortsatt att öka den senaste veckan, om än marginellt.
Chicagovetet (december) steg under större delen av veckan, men föll ganska kraftigt i fredags.
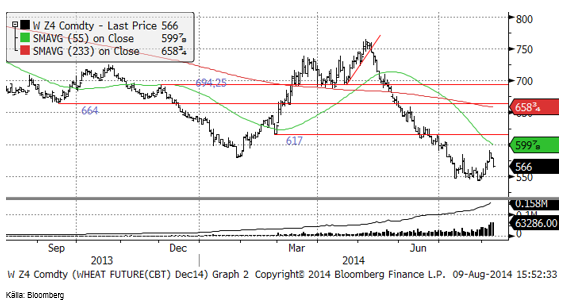
Nedan ser vi terminskurvorna för Chicagovete och Matif i fredags och veckan innan. Matif och Chicago gick upp båda två.
Skörden av höstvetet i USA hade i måndags för en vecka sedan avancerat 7% till 90% skördat. Därmed är skörden i praktiken klar nu i USA.
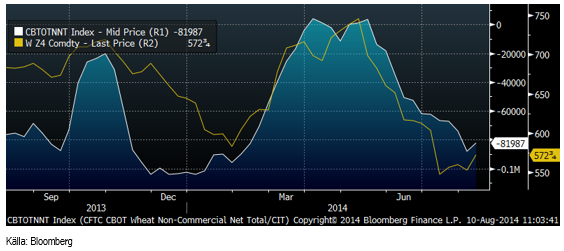
Non-commercials i CFTC:s rapport var för två veckor sedan nettosålda nästan 90,000 kontrakt på Chicago. Prisuppgången i Chicago kan ha fått extra stöd av att dessa köpte tillbaka kontrakt. Non-commercials är fortfarande nettosålda 82,000 kontrakt. Detta betyder också att ”Commercials” är netto köpta lika många. Då commercials består av bönder, spannmålshandlare och kvarnar, får vi anta att bönder inte har så många sålda kontrakt, kanske inte heller spannmålshandlare, men att kvarnar är rätt väl prissäkrade inför nästa år. Kommer bönder att sälja på den här nivån? Troligtvis inte.
Allt detta talar sammantaget för att nedsidan faktiskt är ganska begränsad i vete. Det är större risk på uppsidan. Vi fortsätter därför med köprekommendation, trots. allt.
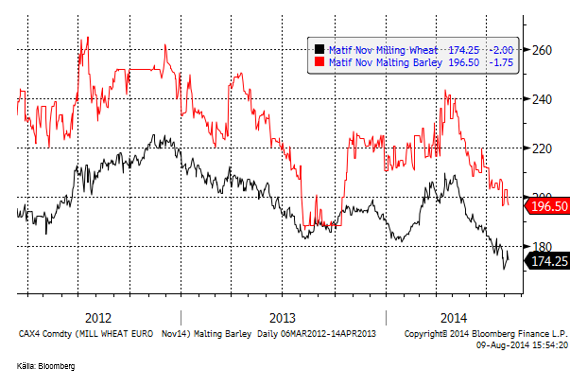
Maltkorn
Maltkornsterminen för leverans i november föll under 200 euro och skillnaden till kvarnvete har minskat till 20 euro. Det här kontraktet har endast ett par hundra terminer öppen balans och endast i novemberkontraktet. Allt talar för att Euronext kommer att avveckla marknaden. Det är vad de borde göra.
Majs
Majspriset, stängde ner kraftigt i fredags på högre volym och ökande öppen balans. Det ser ut som om det är ny prissäkring som pågår, vilket talar för att det finns styrka i nedgången. Det är möjligt att 350 cent kommer att testas i veckan som kommer.
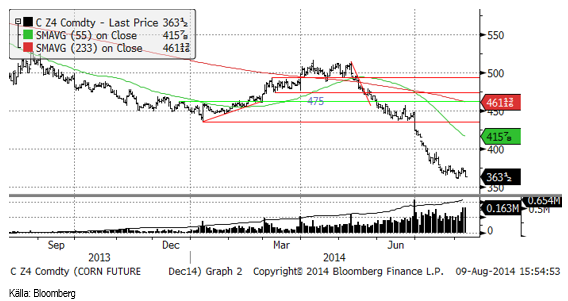
Crop condition backade ytterligare 2% till 73% good/excellent.
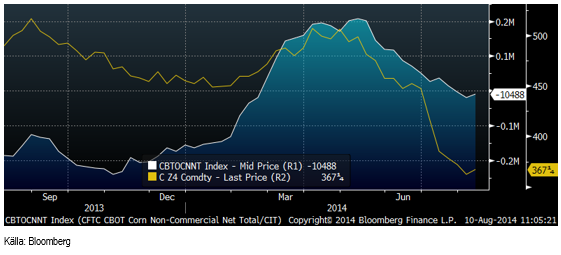
Non-commercials är nettosålda 10,500 kontrakt, vilket inte är en så stor position historiskt sett. Non-commercials har potential att sälja lika mycket till innan de kommer till den sålda nivå de hade i början av året.
CONAB höjde Brasiliens produktionsestimat marginellt till 78.6 mt.
Tisdagens WASDE-rapport blir viktig. Vi såg ovan att USDA:s estimat i förra rapporten var 165.3. Informa ligger nu på 178 och är lägst. FC Stone ligger på 172 bushels per acre. Medelvärdet av estimaten ligger på 170 bushels per acre. Att ”betta” på vad siffran kommer att bli med en köp eller säljrekommendation är detsamma som att spela tärning, så vi fortsätter med neutral rekommendation.
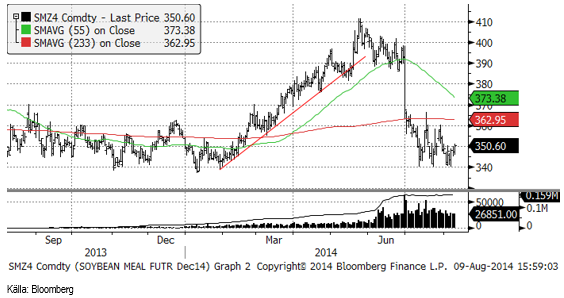
Sojabönor
Sojabönorna avslutade veckan med en liten uppgång. 1050 har hållit vid två försök att bryta nivån. Den konsolidering som har ägt rum den senaste månaden, kan antingen följas a en uppgång mot 1100 cent eller ett fall ner mot 950 cent. Vi vet inte än.
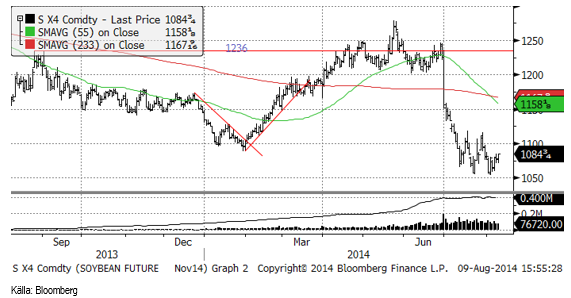
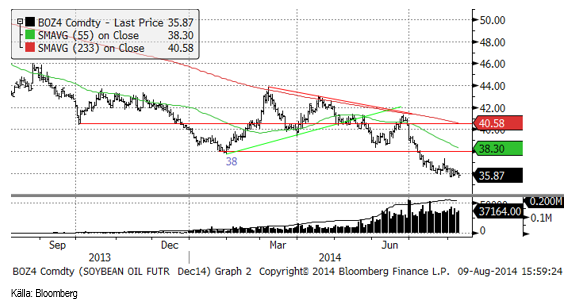
Priset på sojamjöl har varit nere vid 340 dollar tre (eller fyra) gånger den senaste månaden och nivån har hållit. Någon eller några har bestämt sig för att det är en bra nivå att köpa på. Det verkar vara dessa köpare av sojamjöl som håller hela sojakomplexet från att falla. Sojaoljan fortsätter att sjunka sakta.
Sojaoljans prisnedgång i maklig takt ser vi nedan.
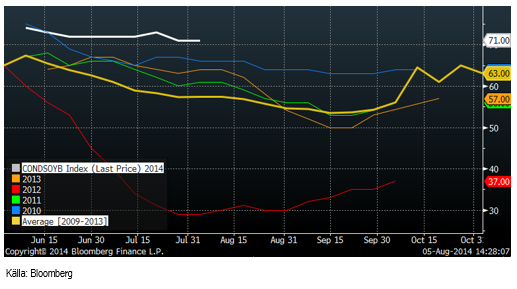
Crop condition för sojabönor var oförändrat på 71% good/excellent.
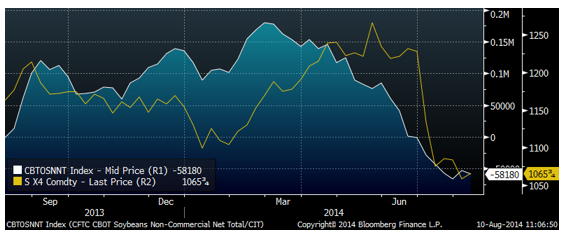
Non-commmercials är nettosålda 58,000 kontrakt, vilket är ovanligt mycket. När de redan är så sålda är det sannolikt inte nya säljare från den kategorin som kommer att trycka ner priset ytterligare.
CONAB justerade i veckan ner skörden 2013/14 med 0.6 mt till 85.7 mt. Brasilien och Argentina väntas öka arealen av sojabönor med 4-5% i höst, vilket leder till ca 5 mt större skörd, allt annat lika. I jämförelse med vårens skörd som blev ca 5 mt lägre än väntat pga torkan i januari och februari, kan skörden bli 10 mt 2014/15 jämfört med 2013/14.
Vi fortsätter med neutral rekommendation tills vidare.
Raps
Novemberkontraktet på Matif steg efter att veckan börjat med fallande kurser. Kursrörelserna är tämligen små.
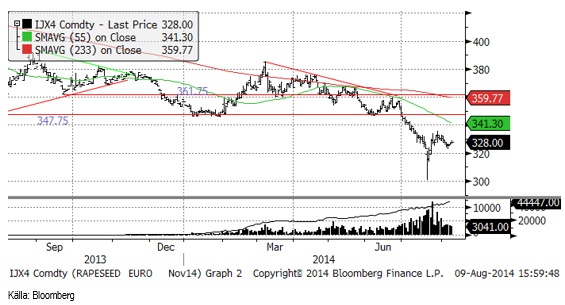
Oil World höjer skördeestimaten för raps i Europa. Tyskland 6.2 mt (5.8 mt förra året), Frankrike 5.3 mt (4.4 mt), Polen 2.9 (2.8), UK 2.5 mt (2.1 mt) och för EU som helhet till 23.1 mt (21.2 mt). Det är högre än den senaste prognosen från StrategieGrains på 22.9 mt.
Vi behåller säljrekommendationen på rapsfröterminer.
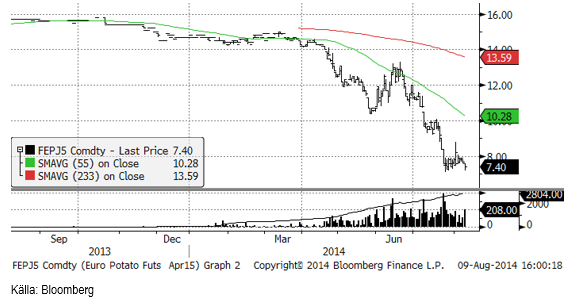
Potatis
Priset på potatis som konsoliderats under 8 euro per ton, fortsatte prisfallet i fredags. Potatis och potatisprodukter tillhör de varor som Ryssland inte kommer att importera, vilket sätter press på priset på EUREX.
Gris
Lean hogs fortsatte prisfallet i veckan som gick. Griskött tillhör de produkter som Ryssland inte importerar längre.
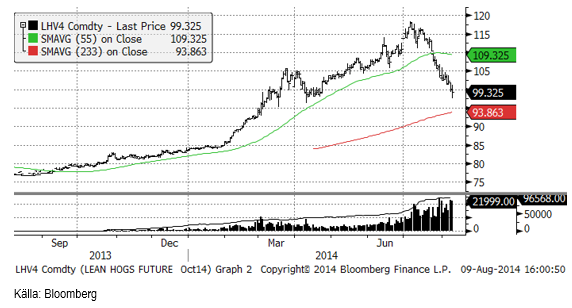
Nedan ser vi kursdiagrammet för septemberkontraktet på EUREX Hogs. Som vi ser föll priset från 1.73 till 1.70 euro per Kg direkt efter Rysslands importstopp.

Mjölk
Mjölk är den vara som påverkats mest av Rysslands importstopp. Valio fick avsluta sin export omedelbart. Arla har tillverkning i Ryssland, men exporterar även en hel del som produceras utanför Ryssland. Det handlar säkerligen en hel del om ost och smör.
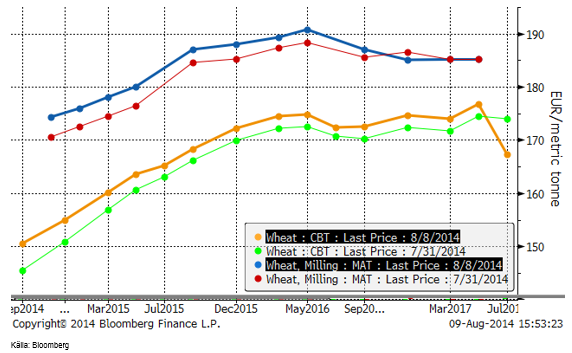
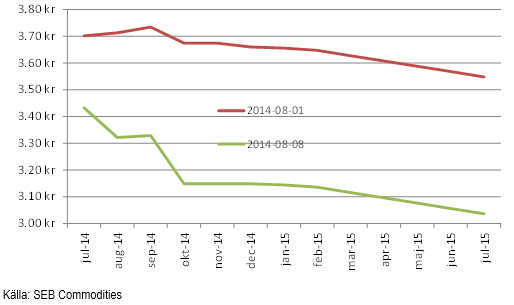
I diagrammet nedan ser vi hur prisfallet på mjölkprodukter fortsatt på alla marknader.
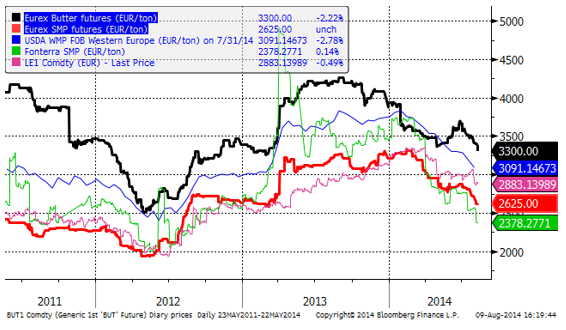
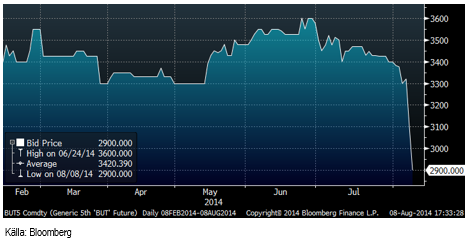
Decemberkontraktet på smör har fallit med 15% i pris hittills i augusti. Nästan hela prisfallet inträffade efter och som följd av Rysslands importstopp avseende smör.
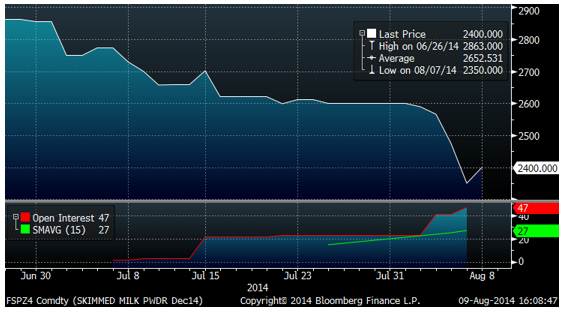
Även terminerna på SMP föll abrupt. Nedan ser vi terminskontrakten för SMP på EUREX.
I USA har terminerna på Non-Fat Dry Milk fallit med ett par procent. Marknaden gör alltså tolkningen att Rysslands importstopp kommer att innebära att global konsumtion minskar genom att den ryska befolkningen konsumerar mindre mjölkprodukter. Marknaden gör alltså tolkningen att den ryska regeringen valt att aktivt ”svälta” sin befolkning på kort sikt och på längre sikt bygga upp en egen produktion.
Pga att den globala produktionen av mjölk och kött av allt att döma initialt blir mindre, kommer detta rimligtvis också att innebära att konsumtionen av foderspannmål och sojamjöl blir mindre.
Terminspriserna för mjölkråvara, basis SMP och smör föll kraftigt efter Rysslands importstopp. Vi ser att terminen för oktober 2014 sjönk från ca 3.70 kr / Kg till 3.15 kr, ett prisfall på nästan 50 öre per kilo.
Vi kan inte bedöma om detta är rätt nivå just nu, så vi gör över till neutral rekommendation.
Socker
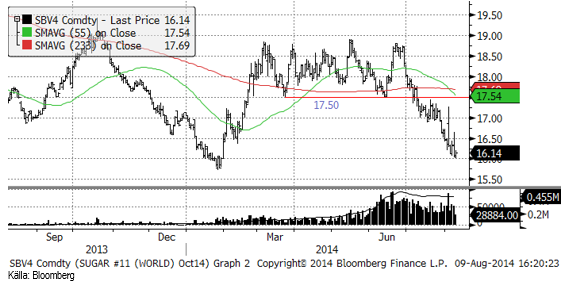
Priset på socker fortsatte falla i veckan och är nu nere på bottennivåerna som registrerades i början av året.
[box]SEB Veckobrev Jordbruksprodukter är producerat av SEB Commodities Sales desk och publiceras i samarbete och med tillstånd på Råvarumarknaden.se[/box]
Detta marknadsföringsmaterial, framtaget av SEB’s Commodities Sales desk, har upprättats enbart i informationssyfte.
Även om innehållet är baserat på källor som SEB bedömt som tillförlitliga ansvarar SEB inte för fel eller brister i informationen. Den utgör inte oberoende, objektiv investeringsanalys och skyddas därför inte av de bestämmelser som SEB har infört för att förebygga potentiella intressekonflikter. Yttranden från SEB’s Commodities Sales desk kan vara oförenliga med tidigare publicerat material från SEB, då den senare hänvisas uppmanas du att läsa den fullständiga rapporten innan någon åtgärd vidtas.
Dokumentationen utgör inte någon investeringsrådgivning och tillhandahålls till dig utan hänsyn till dina investeringsmål. Du uppmanas att självständigt bedöma och komplettera uppgifterna i denna dokumentation och att basera dina investeringsbeslut på material som bedöms erforderligt. Alla framåtblickande uttalanden, åsikter och förväntningar är föremål för risker, osäkerheter och andra faktorer och kan orsaka att det faktiska resultatet avviker väsentligt från det förväntade. Historisk avkastning är ingen garanti för framtida resultat. Detta dokument utgör inte ett erbjudande att teckna några värdepapper eller andra finansiella instrument. SEB svarar inte för förlust eller skada – direkt eller indirekt, eller av vad slag det vara må – som kan uppkomma till följd av användandet av detta material eller dess innehåll.
Observera att det kan förekomma att SEB, dess ledamöter, dess anställda eller dess moder- och/eller dotterbolag vid olika tillfällen innehar, har innehaft eller kommer att inneha aktier, positioner, rådgivningsuppdrag i samband med corporate finance-transaktioner, investment- eller merchantbankinguppdrag och/eller lån i de bolag/finansiella instrument som nämns i materialet.
Materialet är avsett för mottagaren, all spridning, distribuering mångfaldigande eller annan användning av detta meddelande får inte ske utan SEB:s medgivande. Oaktat detta får SEB tillåta omfördelning av materialet till utvald tredje part i enlighet med gällande avtal. Materialet får inte spridas till fysiska eller juridiska personer som är medborgare eller har hemvist i ett land där sådan spridning är otillåten enligt tillämplig lag eller annan bestämmelse.
Skandinaviska Enskilda Banken AB (publ) är ett [publikt] aktiebolag och står under tillsyn av Finansinspektionen samt de lokala finansiella tillsynsmyndigheter i varje jurisdiktionen där SEB har filial eller dotterbolag.

Market is starting to take US/Iran headlines with a pinch of salt. Brent crude rose $2.8/b yesterday to an official close of $112.1/b. But after that it traded as low as $108.05/b before ending late night at around $109.7/b. Through the day it traded in a range of $106.87 – 112.72/b amid a flurry of news or rumors from Iran and the US. ”US temporary sanctions during negotiations” (falls alarm). ”We will bomb Iran” (not anyhow),… etc. While the market is still fluctuating to this kind of news flow, it is starting to take such headlines with a pinch of salt.

We’ll see. Maybe, maybe not. The Brent M1 contract is trading at $110.2/b this morning which very close to the average ticks through yesterday of $110.4/b.
Trump with bearish, verbal intervention whenever Brent trades above $110/b it seems. What seems to be a pattern is that Trump states something like ”very good negotiations going on with Iran”, ”New leaders in Iran are great,..”, ”Great progress in negotiations,…”, ”Deal in sight,..” etc whenever the Brent M1 contract trades above $110/b. An effort to cool the market. These hot air verbal interventions from Trump used to have a heavy bearish impact on prices, but they now seems to have less and less effect unless they are backed by reality.
As far as we can see there has been no real progress in the negotiations between the US and Iran with both sides still standing by their previous demands.
Iran is getting stronger while the cease fire lasts making a return to war for Trump yet harder. Iran is naturally in constant preparation for a return to war given Trump’s steady threats of bombing Iran again. Iran is naturally doing what ever is possible to prepare for a return to war. And every day the cease fire lasts it is better prepared. This naturally makes it more and more difficult and dangerous for the US to return to warring activity versus Iran as the consequences for energy infrastructure in the Persian Gulf will be more and more severe the longer the cease fire lasts. Israel seems to see it this way as well. That the war is not won and that current frozen state of a cease fire gives Iran opportunity to rebuild military and politically.
Global inventories are drawing down day by day. How much? In the meantime the Strait of Hormuz stays closed. There is varying measures and estimates of how much global inventories are drawing down. Our rough estimate, back of the envelope, is that global inventories are drawing down by at least some 10 mb/d or about 300 mb/d in a balance between loss of supply versus demand destruction. Other estimates we see are a monthly draw of 250-270 mb/d. The IEA only ’measured’ a draw in global observable stocks of 117 mb in April with oil on water rising 53 mb while on shore stocks fell 170 mb. But global stocks are hard to measure with large invisible, unmeasured stocks. As such a back of the envelope approach may be better.
Oil products is what the world is consuming. Oil product prices likely to rise while product stocks fall. Strategic Petroleum Reserves (SPR) are predominantly crude oil. Discharging oil from OECD SPR stocks, a sharp reduction in Chinese crude imports and a reduction in global refinery throughput of 6-7 mb/d has helped to keep crude oil markets satisfactorily supplied. But global inventories are drawing down none the less. And oil products is really what the world is consuming. So if global refinery throughput stays subdued, then demand will eventually have to match the supply of oil products. The likely path forward this summer is a steady draw down in jet fuel, diesel and gasoline. Higher prices for these. Then, if possible, higher refinery throughput and higher usage of crude in response to very profitable refinery margins. And lastly sharper draw in crude stocks and higher prices for these. But some 6 mb/d of oil products used to be exported through the Strait of Hormuz. And it may not be so easy to ramp up refinery activity across the world to compensate. Especially as Ukraine continues to damage Russian refineries as well as Russian crude production and export facilities.
Watch oil product stocks and prices as well as Brent calendar 2027. What to watch for this summer is thus oil product inventories falling and oil product premiums to crude rising. Another measure to watch is the Brent crude 2027 contract as it rises steadily day by day as the Strait of Hormuz stays closed and global oil inventories decline. The latter is close to the highest level since the start of the war and keeps rising.
The Brent M1 contract and the Brent 2027 prices and current price of jet fuel in Europe (ARA). All in USD/b

Our back of the envelope calculation of the global shortage created by the closure of the Strait of Hormuz. Note that 3.5 mb/d of discharge from SPR is also a draw. Note also that ’Forced demand loss’ of 2.5 mb/d is probably temporary and will fall back towards zero as logistics are sorted out leaving ’Price demand loss’ to do the job of balancing the market. Thus a shortfall of at least 9 mb/d created by the closure. More if SPR discharge is included and more if Forced demand loss recedes.

Brent is climbing higher. Front-month is at USD 106.3/bl this morning, close to a weekly high and a USD 9/bl jump from Mondays open. This is the move we flagged as a risk earlier in the week: the market shifting from ”a deal is around the corner” to ”this is going to take longer than we thought”.

Analyst Commodities, SEB
During April, rest-of-year Brent remained remarkably stable around USD 90/bl. A stability which rested on one single assumption: the SoH reopens around 1 May. That assumption is now slowly falling apart.
As we highlighted yesterday: every week of delay beyond 1 May adds (theoretically) ish USD 5/bl to the rest-of-year average, as global inventories draw 100 million barrels per week. i.e., a mid-May reopening implies rest-of-year Brent closer to USD 100/bl, and anything pushing into June or July takes us meaningfully higher.
What’s changed in the last 48 hours:
#1: The US military has formally warned that clearing suspected sea mines from SoH could take up to six months. That is a completely different timescale from what the financial market is pricing. Even a political deal tomorrow does not immediately reopen the strait.
#2: Trump has shifted his tone from urgency to ”strategic patience”. In yesterday’s press conference: ”Don’t rush me… I want a great deal.” The market is reading this as a president no longer feeling pressured by timelines, with the naval blockade running in the background.
#3: So far, the military activity is escalating, not de-escalating. Axios reports Iran is laying more mines in SoH. The US 3rd carrier strike group (USS George H.W. Bush) is arriving with two countermine vessels. Trump yesterday ordered the US Navy to destroy any Iranian boats caught laying mines. While CNN reports that the Pentagon is actively drawing up plans to strike Iranian SoH capabilities and individual Iranian military leaders if the ceasefire collapses. i.e., NOT a attitude consistent with an imminent deal!
Spot crude and product prices eased off the early-April highs on a combination of system rerouting and deal optimism. Both now weakening. Goldman estimates April Gulf output is reduced by 14.5 mbl/d, or 57% of pre-war supply, a number that keeps getting worse the longer this drags on.
Demand-side adaptation is ongoing: S. Korea has cut its Middle East crude dependence from 69% to 56% by pulling more from the Americas and Africa, and Japan is kicking off a second round of SPR releases from 1 May. But SPRs are finite.
Ref. to the negotiations, we should not bet on speed. The current Iranian leadership is dominated by genuine hardliners willing to absorb economic pain and run the clock to extract concessions. That is not a setup for a rapid resolution. US/Israeli media briefings keep framing the delay as ”internal Iranian divisions”, the reality is more complicated and points toward weeks and months, not days.
Our point is that the complexity is large, and higher prices have only just started (given a scenario where the negotiations drag out in time). The market spent April leaning on the USD 90/bl rest-of-year assumption; that case is diminishing by the hour. If ”early May reopening” is replaced by ”June, July or later” over the next week or two, both crude and products have meaningful room to reprice higher from here. There is a high risk being short energy and betting on any immediate political resolution(!).
Down on Friday. Up on Monday. The Brent June crude oil contract traded down 5.1% last week to a close of $90.38/b. It reached a high of $103.87/b last Monday and a low of $86.09/b on Friday as Iran announced that the Strait of Hormuz was fully open for transit. That quickly changed over the weekend as the US upheld its blockade of Iranian oil exports while Iran naturally responded by closing the SoH again. The US blew a hole in the engine room of the Iranian ship TOUSKA and took custody of the ship on Sunday. Brent crude is up 5.6% this morning to $95.4/b.
The cease-fire is expiring tomorrow. The US has said it will send a delegation for a second round of negotiations in Islamabad in Pakistan. But Iran has for now rejected a second round of talks as it views US demands as unrealistic and excessive while the US is also blocking the Strait of Hormuz.
While Brent is up 5% this morning, the financial market is still very optimistic that progress will be made. That talks will continue and that the SoH will fully open by the start of May which is consistent with a rest-of-year average Brent crude oil price of around $90/b with the market now trading that balance at around $88/b.
Financial optimism vs. physical deterioration. We have a divergence where the financial market is trading negotiations, improvements and resolution while at the same time the physical market is deteriorating day by day. Physical oil flows remain constrained by disrupted flows, longer voyage times and elevated freight and insurance costs.
Financial markets are betting that a US/Iranian resolution will save us in time from violent shortages down the road. But every day that the SoH remains closed is bringing us closer to a potentially very painful point of shortages and much higher prices.
The US blockade is also a weapon of leverage against its European and Asian allies. When Iran closed the SoH it held the world economy as a hostage against the US. The US blockade of the SoH is of course blocking Iranian oil exports. But it is also an action of disruption directed towards Europe and Asia. The US has called for the rest of the world to engaged in the war with Iran: ”If you want oil from the Persian Gulf, then go and get it”. A risk is that the US plays brinkmanship with the global oil market directed towards its European and Asian allies and maybe even towards China to force them to engage and take part. Maybe unthinkable. But unthinkable has become the norm with Trump in the White House.


Oil product price pain is set to rise as the Strait of Hormuz stays closed into summer

Solkraften pressar elpriserna dagtid

Michel Gubel ger sin syn på oljemarknaden

Svag vårflod dubblar elpriserna
Brent crude up USD 9/bl on the week… ”deal around the corner” narrative fades
Brent crude up USD 9/bl on the week… ”deal around the corner” narrative fades
Solkraften pressar elpriserna dagtid
Michel Gubel ger sin syn på oljemarknaden
Svag vårflod dubblar elpriserna
Oil product price pain is set to rise as the Strait of Hormuz stays closed into summer
-
Analys4 veckor sedan
Brent crude up USD 9/bl on the week… ”deal around the corner” narrative fades
-
 Nyheter3 veckor sedan
Solkraften pressar elpriserna dagtid
-
 Nyheter3 veckor sedan
Michel Gubel ger sin syn på oljemarknaden
-
Nyheter3 veckor sedan
Svag vårflod dubblar elpriserna
-
Analys1 dag sedan
Oil product price pain is set to rise as the Strait of Hormuz stays closed into summer