

Analys
Going green? The unexpected investments helping to reduce vehicle emissions


Globally about 15% of the world’s Greenhouse Gas (GHG) emissions come from the transportation sector. Despite improving fuel efficiency in cars over the past seven decades, the fact that more people in the world use cars means that global emissions from the transport sector continue to rise. However, pollution abatement equipment can help reduce emissions from cars. Autocatalysts are a key technology in this regard.
Platinum and palladium in autocatalysts

An autocatalyst is a device installed in internal combustion engine cars that converts harmful pollutants into safer gases. Platinum group metals (PGM) including platinum, palladium and rhodium are key ingredients in the autocatalysts that generate this chemical conversion. Autocatalysts were first introduced in the mid-1970s and today, are used in almost all internal combustion engine vehicles (including hybrid vehicles). In addition, fuel cell vehicles also use platinum (not palladium or rhodium) as the main catalyst in the reactions to produce electricity and water from hydrogen fuel and water.
How important are autocatalysts for PGM demand?
In 2019, automobiles accounted for 34% of platinum demand and 84% of palladium demand. So, the auto industry is the key driver of demand for both platinum and palladium.
Vehicle sales versus regulation
Tightening emission regulations generally increases the demand for the platinum group metals. Demand for platinum group metals will also vary with the volume of vehicle sales. Historically it has been emission regulation that has had a greater influence on demand. According to World Platinum Investment Council’s calculations, global vehicle sales between 1990 and 2019 rose by 1.6 times whereas the combined demand for platinum, palladium and rhodium in cars rose by 6.2 times. The fact that the rise in automobile platinum group metal demand was more than the increase in car sales indicates that higher loadings have been the chief driver of demand growth. Emission regulations are continuing to tighten globally for both passenger and commercial vehicles.
Gasoline vs. diesel cars
Today, there are higher loadings of palladium in gasoline autocatalysts and higher loadings of platinum in diesel autocatalysts. However, both autocatalysts carry some loadings of each metal. The catalytic efficiency of each metal is influenced by engine temperature, fuel type, all fuel quality and durability of the autocatalyst’s washcoat. Diesel engines operate at lower temperatures than gasoline engines and run with a leaner gas stream containing lots of oxygen. Under these conditions, platinum is a more active catalyst for the conversion of carbon monoxide (CO) and hydrocarbons (HC) to harmless emissions. However, the addition of some palladium to the platinum catalyst can improve its thermal stability. This is an advantage when reducing diesel particulate matter from the exhaust. This process involves trapping the particulate matter in a filter and then raising the temperature of the system to oxidise the matter to CO2. At these higher temperatures, palladium improves the thermal durability of the catalyst, helping it perform optimally for the lifetime of the vehicle.
Diesel cars falling out of favour
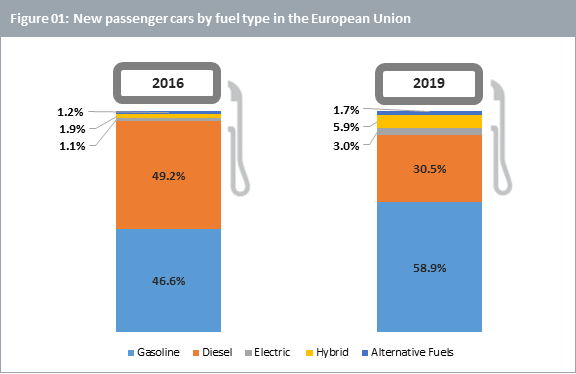
Europe is the largest diesel passenger car market in the world. In most of the rest of the world, gasoline cars dominate. However, even in Europe, diesel cars have fallen out of favour following ‘Dieselgate’ and tightening particulate emissions standards across Europe, where diesel cars do not perform as well as their gasoline equivalents (see figure 01 below).
Platinum versus palladium price
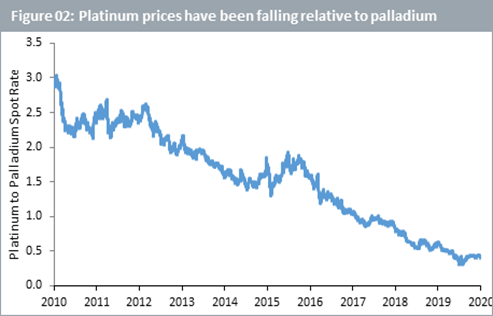
In 2010, platinum used to trade close to 3 times the price of palladium. Dieselgate accelerated the trend of rising palladium relative to platinum prices. Today, platinum trades below half the price of palladium. Palladium’s growing demand and tightening supply have been a boon for prices (see figure 02 below).
Economical to substitute?
With such a wide price differential between platinum and palladium, it’s a natural question to ask if platinum can be substituted for palladium? Industry experts including Johnson Matthey, believe there is some limited scope for substitution. Not necessarily in gasoline cars but more in terms of substituting out palladium in diesel cars with higher loadings of platinum. However, auto manufacturers are notoriously secretive about their technologies which makes it difficult to comment on what scale this will occur. In addition, it is rumoured that auto manufacturers are using their scarce engineers to develop electric vehicles and so auto manufacturers are averse to divert them to PGM substitution projects.
Trucking industry
While globally more passenger cars use gasoline than diesel, trucks generally use more diesel. Emission standards for trucks are tightening. Notably in India the government has tightened regulations to broadly match European standards in 20205. China will implement similar standards phased between 2021 and 2023. This is likely to be a strong catalyst for platinum demand.
Car sales in COVID-19 era
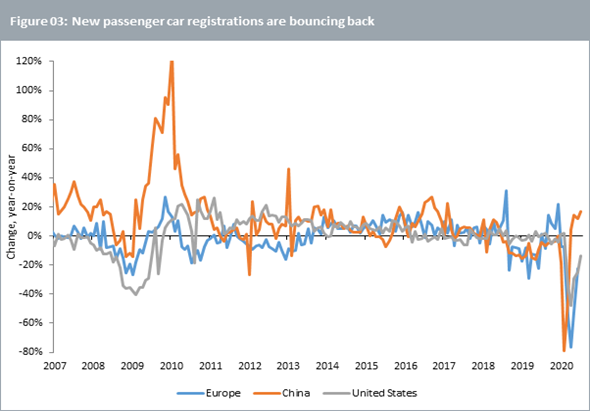
Passenger car sales had fallen hard during the COVID-19 pandemic, but as lockdown conditions ease, car sales appear to be rebounding strongly in China, Europe, and US (see figure 03 below). China and US are predominantly gasoline markets so the rebound in sales there mainly helps boost palladium prices. The rebound in European car sales should also help platinum prices.
The concentration in supply
Supply in both platinum and palladium is highly concentrated. South Africa accounts for nearly 70% of platinum’s global supply while South Africa and Russia collectively provide around 70% of palladium supply globally. While platinum is expected to be in a slight supply surplus this year, palladium continues to be in an acute supply deficit with demand continuing to grow and supply relatively stable.
Conclusions
Both platinum and palladium are important materials for pollution abatement technology in cars. Platinum, which has been heavily utilised in diesel passenger cars, has fallen out of favour in recent years. However, with tightening regulations for commercial vehicles globally we are likely to see that demand rise. Palladium, which has seen growing demand and is in a supply deficit is likely to see constructive fundamentals for years to come.


The latest weekly report from the US DOE showed a substantial drawdown across key petroleum categories, adding more upside potential to the fundamental picture.

Commercial crude inventories (excl. SPR) fell by 5.8 million barrels, bringing total inventories down to 415.1 million barrels. Now sitting 11% below the five-year seasonal norm and placed in the lowest 2015-2022 range (see picture below).
Product inventories also tightened further last week. Gasoline inventories declined by 2.1 million barrels, with reductions seen in both finished gasoline and blending components. Current gasoline levels are about 3% below the five-year average for this time of year.
Among products, the most notable move came in diesel, where inventories dropped by almost 4.1 million barrels, deepening the deficit to around 20% below seasonal norms – continuing to underscore the persistent supply tightness in diesel markets.
The only area of inventory growth was in propane/propylene, which posted a significant 5.1-million-barrel build and now stands 9% above the five-year average.
Total commercial petroleum inventories (crude plus refined products) declined by 4.2 million barrels on the week, reinforcing the overall tightening of US crude and products.


A classic case of “buy the rumor, sell the news” played out in oil markets, as Brent crude has dropped sharply – down nearly USD 10 per barrel since yesterday evening – following Iran’s retaliatory strike on a U.S. air base in Qatar. The immediate reaction was: “That was it?” The strike followed a carefully calibrated, non-escalatory playbook, avoiding direct threats to energy infrastructure or disruption of shipping through the Strait of Hormuz – thus calming worst-case fears.
After Monday morning’s sharp spike to USD 81.4 per barrel, triggered by the U.S. bombing of Iranian nuclear facilities, oil prices drifted sideways in anticipation of a potential Iranian response. That response came with advance warning and caused limited physical damage. Early this morning, both the U.S. President and Iranian state media announced a ceasefire, effectively placing a lid on the immediate conflict risk – at least for now.
As a result, Brent crude has now fallen by a total of USD 12 from Monday’s peak, currently trading around USD 69 per barrel.
Looking beyond geopolitics, the market will now shift its focus to the upcoming OPEC+ meeting in early July. Saudi Arabia’s decision to increase output earlier this year – despite falling prices – has drawn renewed attention considering recent developments. Some suggest this was a response to U.S. pressure to offset potential Iranian supply losses.
However, consensus is that the move was driven more by internal OPEC+ dynamics. After years of curbing production to support prices, Riyadh had grown frustrated with quota-busting by several members (notably Kazakhstan). With Saudi Arabia cutting up to 2 million barrels per day – roughly 2% of global supply – returns were diminishing, and the risk of losing market share was rising. The production increase is widely seen as an effort to reassert leadership and restore discipline within the group.
That said, the FT recently stated that, the Saudis remain wary of past missteps. In 2018, Riyadh ramped up output at Trump’s request ahead of Iran sanctions, only to see prices collapse when the U.S. granted broad waivers – triggering oversupply. Officials have reportedly made it clear they don’t intend to repeat that mistake.
The recent visit by President Trump to Saudi Arabia, which included agreements on AI, defense, and nuclear cooperation, suggests a broader strategic alignment. This has fueled speculation about a quiet “pump-for-politics” deal behind recent production moves.
Looking ahead, oil prices have now retraced the entire rally sparked by the June 13 Israel–Iran escalation. This retreat provides more political and policy space for both the U.S. and Saudi Arabia. Specifically, it makes it easier for Riyadh to scale back its three recent production hikes of 411,000 barrels each, potentially returning to more moderate increases of 137,000 barrels for August and September.
In short: with no major loss of Iranian supply to the market, OPEC+ – led by Saudi Arabia – no longer needs to compensate for a disruption that hasn’t materialized, especially not to please the U.S. at the cost of its own market strategy. As the Saudis themselves have signaled, they are unlikely to repeat previous mistakes.
Conclusion: With Brent now in the high USD 60s, buying oil looks fundamentally justified. The geopolitical premium has deflated, but tensions between Israel and Iran remain unresolved – and the risk of missteps and renewed escalation still lingers. In fact, even this morning, reports have emerged of renewed missile fire despite the declared “truce.” The path forward may be calmer – but it is far from stable.
Analys
A muted price reaction. Market looks relaxed, but it is still on edge waiting for what Iran will do
Brent crossed the 80-line this morning but quickly fell back assigning limited probability for Iran choosing to close the Strait of Hormuz. Brent traded in a range of USD 70.56 – 79.04/b last week as the market fluctuated between ”Iran wants a deal” and ”US is about to attack Iran”. At the end of the week though, Donald Trump managed to convince markets (and probably also Iran) that he would make a decision within two weeks. I.e. no imminent attack. Previously when when he has talked about ”making a decision within two weeks” he has often ended up doing nothing in the end. The oil market relaxed as a result and the week ended at USD 77.01/b which is just USD 6/b above the year to date average of USD 71/b.

Brent jumped to USD 81.4/b this morning, the highest since mid-January, but then quickly fell back to a current price of USD 78.2/b which is only up 1.5% versus the close on Friday. As such the market is pricing a fairly low probability that Iran will actually close the Strait of Hormuz. Probably because it will hurt Iranian oil exports as well as the global oil market.
It was however all smoke and mirrors. Deception. The US attacked Iran on Saturday. The attack involved 125 warplanes, submarines and surface warships and 14 bunker buster bombs were dropped on Iranian nuclear sites including Fordow, Natanz and Isfahan. In response the Iranian Parliament voted in support of closing the Strait of Hormuz where some 17 mb of crude and products is transported to the global market every day plus significant volumes of LNG. This is however merely an advise to the Supreme leader Ayatollah Ali Khamenei and the Supreme National Security Council which sits with the final and actual decision.
No supply of oil is lost yet. It is about the risk of Iran closing the Strait of Hormuz or not. So far not a single drop of oil supply has been lost to the global market. The price at the moment is all about the assessed risk of loss of supply. Will Iran choose to choke of the Strait of Hormuz or not? That is the big question. It would be painful for US consumers, for Donald Trump’s voter base, for the global economy but also for Iran and its population which relies on oil exports and income from selling oil out of that Strait as well. As such it is not a no-brainer choice for Iran to close the Strait for oil exports. And looking at the il price this morning it is clear that the oil market doesn’t assign a very high probability of it happening. It is however probably well within the capability of Iran to close the Strait off with rockets, mines, air-drones and possibly sea-drones. Just look at how Ukraine has been able to control and damage the Russian Black Sea fleet.
What to do about the highly enriched uranium which has gone missing? While the US and Israel can celebrate their destruction of Iranian nuclear facilities they are also scratching their heads over what to do with the lost Iranian nuclear material. Iran had 408 kg of highly enriched uranium (IAEA). Almost weapons grade. Enough for some 10 nuclear warheads. It seems to have been transported out of Fordow before the attack this weekend.
The market is still on edge. USD 80-something/b seems sensible while we wait. The oil market reaction to this weekend’s events is very muted so far. The market is still on edge awaiting what Iran will do. Because Iran will do something. But what and when? An oil price of 80-something seems like a sensible level until something do happen.


Ryska staten siktar på att konfiskera en av landets största guldproducenter

Hur säkrar vi Sveriges tillgång till kritiska metaller och mineral i en ny geopolitisk verklighet?

Lundin Mining ska bli en av de tio största kopparproducenterna i världen

Sommarvädret styr elpriset i Sverige

Samtal om flera delar av råvarumarknaden

Stor uppsida i Lappland Guldprospekterings aktie enligt analys
Silverpriset släpar efter guldets utveckling, har mer uppsida

Uppgången i oljepriset planade ut under helgen

Mahvie Minerals växlar spår – satsar fullt ut på guld

Låga elpriser i sommar – men mellersta Sverige får en ökning
-
 Nyheter4 veckor sedan
Stor uppsida i Lappland Guldprospekterings aktie enligt analys
-
 Nyheter4 veckor sedan
Silverpriset släpar efter guldets utveckling, har mer uppsida
-
 Nyheter3 veckor sedan
Uppgången i oljepriset planade ut under helgen
-
 Nyheter2 veckor sedan
Mahvie Minerals växlar spår – satsar fullt ut på guld
-
 Nyheter3 veckor sedan
Låga elpriser i sommar – men mellersta Sverige får en ökning
-
Analys3 veckor sedan
Very relaxed at USD 75/b. Risk barometer will likely fluctuate to higher levels with Brent into the 80ies or higher coming 2-3 weeks
-

 Nyheter2 veckor sedan
Oljan, guldet och marknadens oroande tystnad
-

 Nyheter2 veckor sedan
Jonas Lindvall är tillbaka med ett nytt oljebolag, Perthro, som ska börsnoteras