

Analys
SHB Råvarubrevet 31 maj 2013

 Råvaror allmänt
Dagen före dopparedagen
Denna vecka har makromässigt varit lätt och en uppladdning för morgondagens kinesiska inköpschefsindex och USA:s dito som kommer på måndag. Kinas preliminära siffra var svagare än väntat och förväntningarna på morgondagens siffra är 50.0 att jämföra med utfallet för april på 50.6. I USA har konsumtionsdata varit bra på sistone och den felande länken just nu är att inköpschefsindex som mer speglar tillverkningsindustrins konjunktur inte har visat samma styrka. Om den amerikanska siffran kommer in på bra nivåer så kommer vi förkasta vår oro under senvåren för den amerikanska konjunkturen då både husmarknaden och konsumtionen varit bra.
Annars har marknaden känt av volatilitet efter att Fed chefen hintade om eventuellt nedskuret stöd till marknaden redan under tredje kvartalet. Metallerna har varit speciellt volatila på denna signal och USA:s stödpolitik är svår att bedöma just nu. Generellt kan man säga att USA har fått en klart starkare betydelse för råvarumarknaden den här våren efter att förväntningarna på Kina fallit samtidigt som de trissats upp på USA.
Kinesiska data fortsätter vara något svagare än väntat med lägre aktivitet över lag. Få eller inga signaler om ytterligare stimulanser gör att marknaden kontinuerligt sänker förväntningarna på Kina. Problembarnet Europa fortsätter på svaga nivåer och indikatorer pekar på recession, men i alla fall en mildare sådan än för några månader sedan. Givet att förväntansbilden nu är så lågt ställd på Europa så tror vi snarare att Europeisk data har potential att överraska åt det positiva hållet i närtid.
Basmetaller
Basmetallerna finner stöd
Vårt Basmetallindex ligger kvar oförändrat över veckan efter att Aluminium, Zink och Bly stigit medan övriga basmetaller fallit tillbaka något. Freeport-McMoran har återstartat en viss del av produktionen vid Grasberg (Koppar) i Indonesien efter explosionen tidigare i maj där 28 gruvarbetare miste livet. Vidare noteras att Kinesiska myndigheter håller på att utveckla en plan för att minska överkapaciteten inom stål- och aluminiumsektorn i landet där kapacitetsutnyttjandet för närvarande ligger kring 70 procent. En del mindre verk i Hebeiprovinsen har stängts ned de senaste veckorna vilket i sin tur bidragit till att pressa järnmalmen med hela 19 procent sedan mitten av april. Vi uppskattar att ca 25 av aluminiumproduktionen idag sker till förlust och man successivt stänger ned äldre kapacitet.
Bland metallerna håller vi Aluminium som en liten favorit inte minst om man tittar på den tekniska bilden. Nedan ser ni prisutvecklingen samt marknadens forwardpris i blått och vår egen prognos i gult.
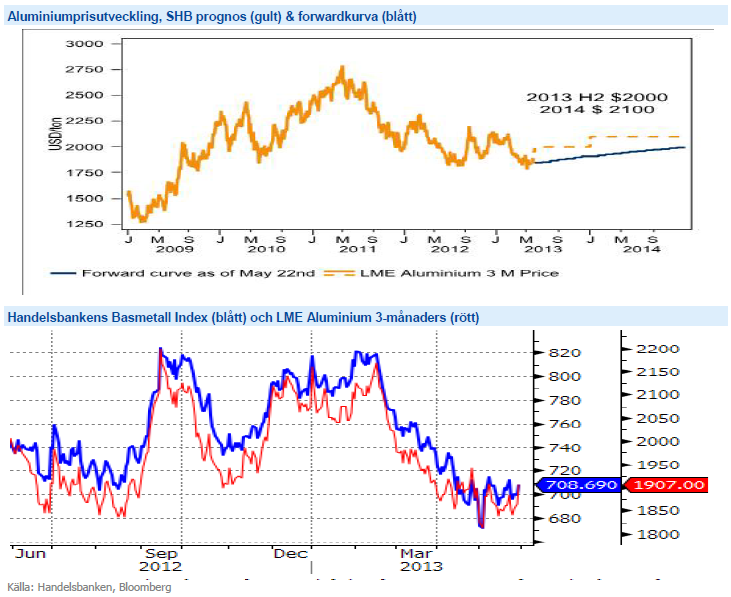
Den fysiska marknaden för basmetaller är stark och efter vårens nedgång ser vi basmetallerna som köpvärda på dessa nivåer. Vi tror på: LONG BASMET H
Ädelmetaller
På guldfronten intet nytt!
En vecka med stora börssvängningar i Japan framför allt, som trots en stark avslutning stänger ner nästan 6 % har präglat marknaden. Generellt minskad riskaptit har lockat in en del nya köpare i guldet, och i skrivande stund noteras den ädla metallen drygt 2 % högre än förra veckan. Vi bibehåller vår negativa syn, veckan som gått borde ha stärkt guldet betydligt mer än vad som skett, särskilt mot bakgrund av att veckan också bjudit på en ganska ordentlig dollarförsvagning.
Vi ser det fortfarande som att guldmarknaden är ”lång” i sin positionering, och uppgångarna blir än så länge beskedliga och kortlivade, i en miljö som borde passa guldet. Vi vill påminna om att guldprisets uppgång bygger på att det hela tiden tillkommer nya köpare som är beredda att betala mer än föregående köpare. När priset istället – som de senaste månaderna – faller, då blir det svårt att motivera långa positioner. Till skillnad från övriga råvaror, som faktiskt går åt till något, så är det få guldinvesterare som förbrukar sitt guld. Det är inte kul att smälta ner guldtackan och göra ett örhänge för att priset faller.
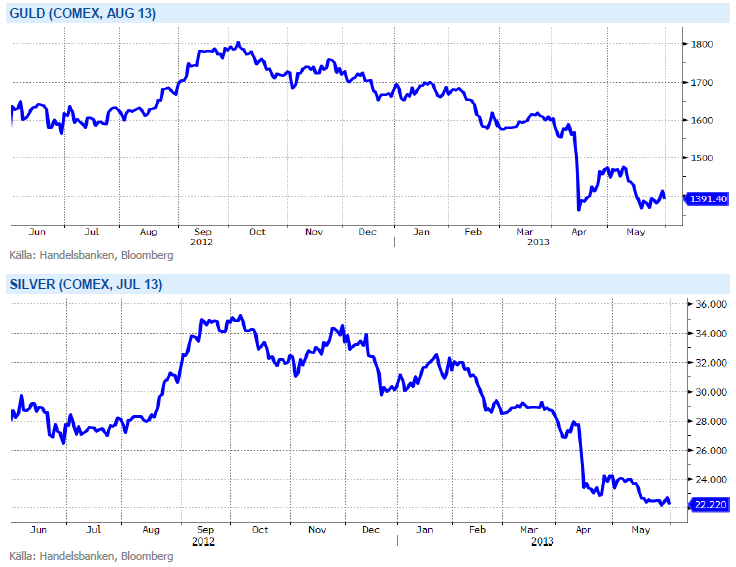
Urprisningen av QE driver ner guldet ytterligare samtidigt som dollarn stärks – vilket i sin tur ger lägre guld. Vi tror på: SHRT GULD H
Energi
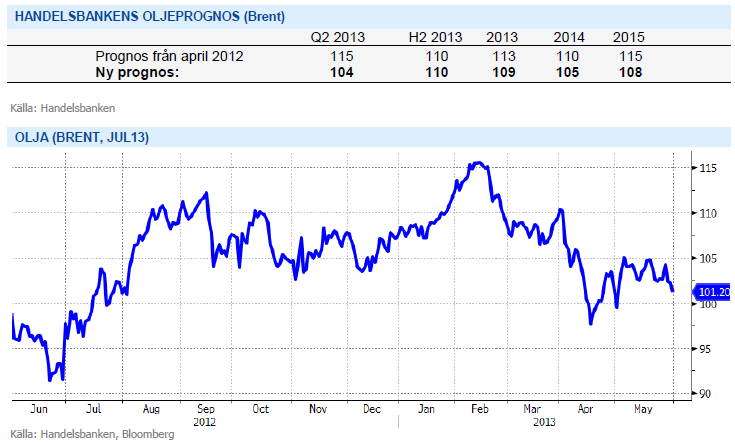
OPEC håller produktionen oförändrad
Fokus var denna vecka på OPECs möte i Wien och huruvida man skulle komma att dra ner produktionen för att balansera överskottet i marknaden. Disciplinen har blivit bättre inom OPEC bland medlemsländerna men man producerar fortfarande mer än målet om 30 miljoner fat per dag. Saudiarabien producerar på högsta nivån sedan november 2012, dvs 9.35 miljoner fat per dag, vilket gör det svårt för dem att tvinga andra medlemmar att dra ned sin produktion. OPEC beslutade därför vid sitt möte i Wien att hålla produktionsmålet om 30 miljoner fat per dag oförändrat, trots att det bidrar till överskottet. I övrigt var det mest effekterna av den amerikanska skifferproduktionen som stod i fokus. Skiffer-produktionen minskar det amerikanska importbehovet vilket i sin tur leder till en större konkurrens kring marknadsandelar i Asien för OPECs medlemmar. Oljan backar med en dollar under veckan bla till följd av EIA´s lagersiffror som visade på en ökning mot förväntan till rekordhöga nivåer.
Sidledes utveckling på den Nordiska elmarknaden där den inledande handeln präglats av våta väderprognoser men där prognoserna svängt om mot ett något torrare scenario (energibalansen landar på ca -9 TWh). Ser vi till bränslekomplexet så balanseras ett vikande kolpris av stigande gaspriser och en stabiliserad utsläppsmarknad så för att sammanfatta är det egentligen bara kolet som verkar för nedsidan. Vi räknar dock med att elmarknaden handlas kvar på nuvarande nivåer.
Livsmedel
Kommande skörd väntas bli hög
Priserna på majs i Chicago för ny skörd har gått upp under veckan, påverkat främst av att regn fördröjer den sista delen av den amerikanska sådden. Det är dock en liten del av sådden som återstår nu och regnet gynnar redan sådd gröda. Väderprognosen för kommande vecka är ganska osäker men inte mycket lär återstå av sådden när vi kommit en bit in i veckan. Andelen av grödan som nått uppkomststadiet ligger efter det normala men hopp finns om en återhämtning även där. I Argentina fortsätter skörden utan större problem i torrt och varmt väder, omkring 80 procent av skörden uppges nu vara klar. Kommande prisbild kommer vara väldigt beroende av utvecklingen för grödan i USA och än finns alla chanser för att kommande skörd blir hög.
Vetepriset handlats på veckan i princip oförändrat. Det amerikanska höstvetet har fått en del regnskurar men framförallt har temperaturen stigit, vilket bör gynna grödorna något. En del regnskurar fortsätter att fördröja den amerikanska vårsådden men andelen av sådden som är avklarad ligger nu inte långt efter genomsnittet för de senaste fem åren och ingen större oro verkar finnas. Mer regn fortsätter även att störa sådden i Kanada men generellt upplevs mer torrt än blött väder. I EU är fortfarande generellt sett ganska kallt och regnigt, vilket gör att inte mycket händer med de redan sent utvecklade grödorna. Mer värme och sol önskas och ser också ut att komma i nästa vecka. Kommande prisutveckling är väldigt beroende av vädret den närmsta tiden, inte minst för majsen i USA men även i Europa där värmen behövs. I dagsläget upplevs dock större problem enbart för det amerikanska vetet. Mycket kan hända innan skörd men i dagsläget är vi kvar i vår tro om större skördar och ökade lagernivåer med lägre priser längre fram på året som följd.
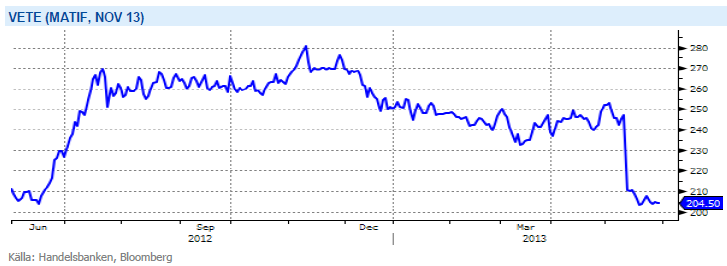
Efter att alla frön är i jorden och prognoser på rekordskördar duggar tätt så finns alla förutsättningar för att priserna på de tre stora grödorna soja, majs och vete att falla fram till skörden är bärgad. Vi tror på: SHRT LIVSMEDEL H
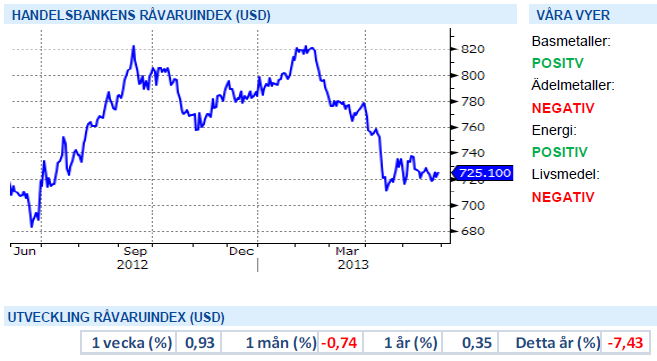
Handelsbankens Råvaruindex
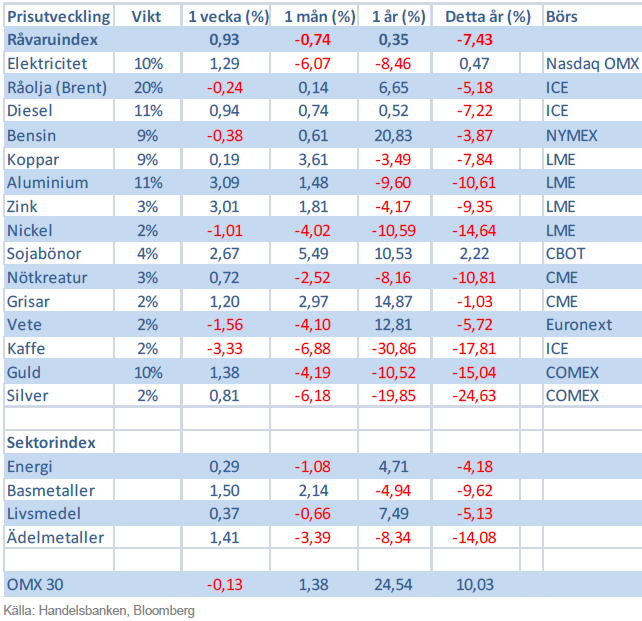
Handelsbankens råvaruindex består av de underliggande indexen för respektive råvara. Vikterna är bestämda till hälften från värdet av nordisk produktion (globala produktionen för sektorindex) och till hälften från likviditeten i terminskontrakten.
[box]SHB Råvarubrevet är producerat av Handelsbanken och publiceras i samarbete och med tillstånd på Råvarumarknaden.se[/box]
Ansvarsbegränsning
Detta material är producerat av Svenska Handelsbanken AB (publ) i fortsättningen kallad Handelsbanken. De som arbetar med innehållet är inte analytiker och materialet är inte oberoende investeringsanalys. Innehållet är uteslutande avsett för kunder i Sverige. Syftet är att ge en allmän information till Handelsbankens kunder och utgör inte ett personligt investeringsråd eller en personlig rekommendation. Informationen ska inte ensamt utgöra underlag för investeringsbeslut. Kunder bör inhämta råd från sina rådgivare och basera sina investeringsbeslut utifrån egen erfarenhet.
Informationen i materialet kan ändras och också avvika från de åsikter som uttrycks i oberoende investeringsanalyser från Handelsbanken. Informationen grundar sig på allmänt tillgänglig information och är hämtad från källor som bedöms som tillförlitliga, men riktigheten kan inte garanteras och informationen kan vara ofullständig eller nedkortad. Ingen del av förslaget får reproduceras eller distribueras till någon annan person utan att Handelsbanken dessförinnan lämnat sitt skriftliga medgivande. Handelsbanken ansvarar inte för att materialet används på ett sätt som strider mot förbudet mot vidarebefordran eller offentliggörs i strid med bankens regler.


Some rebound but not much. Brent crude rebounded 1.5% yesterday to $65.47/b. This morning it is inching 0.2% up to $65.6/b. The lowest close last week was on Thursday at $64.11/b.

The curve structure is almost as week as it was before the weekend. The rebound we now have gotten post the message from OPEC+ over the weekend is to a large degree a rebound along the curve rather than much strengthening at the front-end of the curve. That part of the curve structure is almost as weak as it was last Thursday.
We are still on a weakening path. The message from OPEC+ over the weekend was we are still on a weakening path with rising supply from the group. It is just not as rapidly weakening as was feared ahead of the weekend when a quota hike of 500 kb/d/mth for November was discussed.
The Brent curve is on its way to full contango with Brent dipping into the $50ies/b. Thus the ongoing weakening we have had in the crude curve since the start of the year, and especially since early June, will continue until the Brent crude oil forward curve is in full contango along with visibly rising US and OECD oil inventories. The front-month Brent contract will then flip down towards the $60/b-line and below into the $50ies/b.
At what point will OPEC+ turn to cuts? The big question then becomes: When will OPEC+ turn around to make some cuts? At what (price) point will they choose to stabilize the market? Because for sure they will. Higher oil inventories, some more shedding of drilling rigs in US shale and Brent into the 50ies somewhere is probably where the group will step in.
There is nothing we have seen from the group so far which indicates that they will close their eyes, let the world drown in oil and the oil price crash to $40/b or below.
The message from OPEC+ is also about balance and stability. The world won’t drown in oil in 2026. The message from the group as far as we manage to interpret it is twofold: 1) Taking back market share which requires a lower price for non-OPEC+ to back off a bit, and 2) Oil market stability and balance. It is not just about 1. Thus fretting about how we are all going to drown in oil in 2026 is totally off the mark by just focusing on point 1.
When to buy cal 2026? Before Christmas when Brent hits $55/b and before OPEC+ holds its last meeting of the year which is likely to be in early December.
Brent crude oil prices have rebounded a bit along the forward curve. Not much strengthening in the structure of the curve. The front-end backwardation is not much stronger today than on its weakest level so far this year which was on Thursday last week.

The front-end backwardation fell to its weakest level so far this year on Thursday last week. A slight pickup yesterday and today, but still very close to the weakest year to date. More oil from OPEC+ in the coming months and softer demand and rising inventories. We are heading for yet softer levels.

Down to the lowest since early May. Brent crude has fallen sharply the latest four days. It closed at USD 64.11/b yesterday which is the lowest since early May. It is staging a 1.3% rebound this morning along with gains in both equities and industrial metals with an added touch of support from a softer USD on top.
What stands out the most to us this week is the collapse in the Dubai one to three months time-spread.
Dubai is medium sour crude. OPEC+ is in general medium sour crude production. Asian refineries are predominantly designed to process medium sour crude. So Dubai is the real measure of the balance between OPEC+ holding back or not versus Asian oil demand for consumption and stock building.
A sharp weakening of the front-end of the Dubai curve. The front-end of the Dubai crude curve has been holding out very solidly throughout this summer while the front-end of the Brent and WTI curves have been steadily softening. But the strength in the Dubai curve in our view was carrying the crude oil market in general. A source of strength in the crude oil market. The core of the strength.
The now finally sharp decline of the front-end of the Dubai crude curve is thus a strong shift. Weakness in the Dubai crude marker is weakness in the core of the oil market. The core which has helped to hold the oil market elevated.
Facts supports the weakening. Add in facts of Iraq lifting production from Kurdistan through Turkey. Saudi Arabia lifting production to 10 mb/d in September (normal production level) and lifting exports as well as domestic demand for oil for power for air con is fading along with summer heat. Add also in counter seasonal rise in US crude and product stocks last week. US oil stocks usually decline by 1.3 mb/week this time of year. Last week they instead rose 6.4 mb/week (+7.2 mb if including SPR). Total US commercial oil stocks are now only 2.1 mb below the 2015-19 seasonal average. US oil stocks normally decline from now to Christmas. If they instead continue to rise, then it will be strongly counter seasonal rise and will create a very strong bearish pressure on oil prices.
Will OPEC+ lift its voluntary quotas by zero, 137 kb/d, 500 kb/d or 1.5 mb/d? On Sunday of course OPEC+ will decide on how much to unwind of the remaining 1.5 mb/d of voluntary quotas for November. Will it be 137 kb/d yet again as for October? Will it be 500 kb/d as was talked about earlier this week? Or will it be a full unwind in one go of 1.5 mb/d? We think most likely now it will be at least 500 kb/d and possibly a full unwind. We discussed this in a not earlier this week: ”500 kb/d of voluntary quotas in October. But a full unwind of 1.5 mb/d”
The strength in the front-end of the Dubai curve held out through summer while Brent and WTI curve structures weakened steadily. That core strength helped to keep flat crude oil prices elevated close to the 70-line. Now also the Dubai curve has given in.

Brent crude oil forward curves

Total US commercial stocks now close to normal. Counter seasonal rise last week. Rest of year?

Total US crude and product stocks on a steady trend higher.

Analys
OPEC+ will likely unwind 500 kb/d of voluntary quotas in October. But a full unwind of 1.5 mb/d in one go could be in the cards
Down to mid-60ies as Iraq lifts production while Saudi may be tired of voluntary cut frugality. The Brent December contract dropped 1.6% yesterday to USD 66.03/b. This morning it is down another 0.3% to USD 65.8/b. The drop in the price came on the back of the combined news that Iraq has resumed 190 kb/d of production in Kurdistan with exports through Turkey while OPEC+ delegates send signals that the group will unwind the remaining 1.65 mb/d (less the 137 kb/d in October) of voluntary cuts at a pace of 500 kb/d per month pace.
Signals of accelerated unwind and Iraqi increase may be connected. Russia, Kazakhstan and Iraq were main offenders versus the voluntary quotas they had agreed to follow. Russia had a production ’debt’ (cumulative overproduction versus quota) of close to 90 mb in March this year while Kazakhstan had a ’debt’ of about 60 mb and the same for Iraq. This apparently made Saudi Arabia angry this spring. Why should Saudi Arabia hold back if the other voluntary cutters were just freeriding? Thus the sudden rapid unwinding of voluntary cuts. That is at least one angle of explanations for the accelerated unwinding.
If the offenders with production debts then refrained from lifting production as the voluntary cuts were rapidly unwinded, then they could ’pay back’ their ’debts’ as they would under-produce versus the new and steadily higher quotas.
Forget about Kazakhstan. Its production was just too far above the quotas with no hope that the country would hold back production due to cross-ownership of oil assets by international oil companies. But Russia and Iraq should be able to do it.
Iraqi cumulative overproduction versus quotas could reach 85-90 mb in October. Iraq has however steadily continued to overproduce by 3-5 mb per month. In July its new and gradually higher quota came close to equal with a cumulative overproduction of only 0.6 mb that month. In August again however its production had an overshoot of 100 kb/d or 3.1 mb for the month. Its cumulative production debt had then risen to close to 80 mb. We don’t know for September yet. But looking at October we now know that its production will likely average close to 4.5 mb/d due to the revival of 190 kb/d of production in Kurdistan. Its quota however will only be 4.24 mb/d. Its overproduction in October will thus likely be around 250 kb/d above its quota with its production debt rising another 7-8 mb to a total of close to 90 mb.
Again, why should Saudi Arabia be frugal while Iraq is freeriding. Better to get rid of the voluntary quotas as quickly as possible and then start all over with clean sheets.
Unwinding the remaining 1.513 mb/d in one go in October? If OPEC+ unwinds the remaining 1.513 mb/d of voluntary cuts in one big go in October, then Iraq’s quota will be around 4.4 mb/d for October versus its likely production of close to 4.5 mb/d for the coming month..
OPEC+ should thus unwind the remaining 1.513 mb/d (1.65 – 0.137 mb/d) in one go for October in order for the quota of Iraq to be able to keep track with Iraq’s actual production increase.
October 5 will show how it plays out. But a quota unwind of at least 500 kb/d for Oct seems likely. An overall increase of at least 500 kb/d in the voluntary quota for October looks likely. But it could be the whole 1.513 mb/d in one go. If the increase in the quota is ’only’ 500 kb/d then Iraqi cumulative production will still rise by 5.7 mb to a total of 85 mb in October.
Iraqi production debt versus quotas will likely rise by 5.7 mb in October if OPEC+ only lifts the overall quota by 500 kb/d in October. Here assuming historical production debt did not rise in September. That Iraq lifts its production by 190 kb/d in October to 4.47 mb/d (August level + 190 kb/d) and that OPEC+ unwinds 500 kb/d of the remining quotas in October when they decide on this on 5 October.


Blykalla, Evroc och Studsvik vill bygga kärnkraftsdrivna datacenter i Sverige

Toppmöte om framtidens kärnkraft runt Östersjön hölls idag

Nytt prisrekord, guld stiger över 4000 USD

Goldman Sachs höjer prognosen för guld, tror priset når 4900 USD
More weakness and lower price levels ahead, but the world won’t drown in oil in 2026

Mahvie Minerals i en guldtrend
Volatile but going nowhere. Brent crude circles USD 66 as market weighs surplus vs risk

Aktier i guldbolag laggar priset på guld

Kinas elproduktion slog nytt rekord i augusti, vilket även kolkraft gjorde

Tyskland har så höga elpriser att företag inte har råd att använda elektricitet
-
 Nyheter4 veckor sedan
Mahvie Minerals i en guldtrend
-
Analys4 veckor sedan
Volatile but going nowhere. Brent crude circles USD 66 as market weighs surplus vs risk
-
 Nyheter4 veckor sedan
Aktier i guldbolag laggar priset på guld
-
 Nyheter3 veckor sedan
Kinas elproduktion slog nytt rekord i augusti, vilket även kolkraft gjorde
-
Nyheter3 veckor sedan
Tyskland har så höga elpriser att företag inte har råd att använda elektricitet
-

 Nyheter4 veckor sedan
Guld når sin högsta nivå någonsin, nu även justerat för inflation
-

 Nyheter3 veckor sedan
Det stigande guldpriset en utmaning för smyckesköpare
-
Analys4 veckor sedan
Waiting for the surplus while we worry about Israel and Qatar